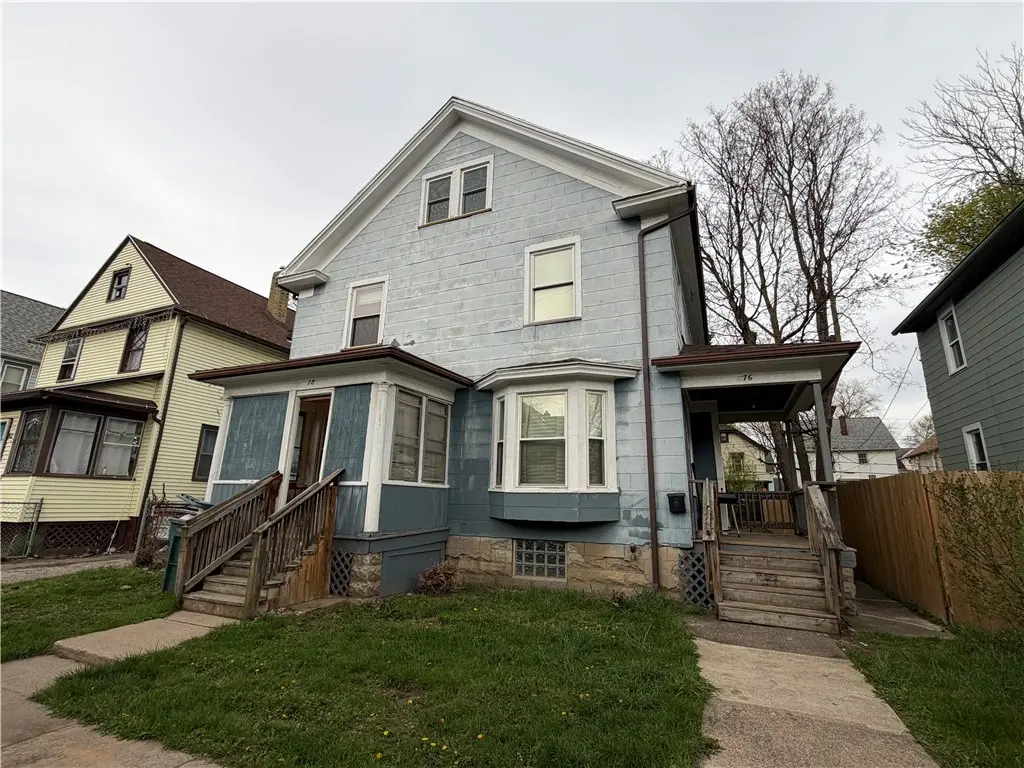
76 Ellison St · Rochester, NY
Flood risk 6/10 · Moderate
- FEMA flood zone
- X (unshaded)
- Chance of flooding over 30 yrs
- 0.68%
- Est. flood insurance / yr
- $473 – $860
Fire risk 1/10 · Minimal
- Est. fire insurance / yr
- $691 – $1,283
Heat risk 2/10 · Minimal
- Hot days now (above 95°F)
- 7 days/yr
- Hot days in 30 yrs
- 14 days/yr
Wind risk 1/10 · Minimal
- Chance of severe wind over 30 yrs
- —
Air-quality risk 2/10 · Minimal
- Unhealthy air days now
- 1 days/yr
- Unhealthy air days in 30 yrs
- 2 days/yr
Risk factors via First Street. Map © Google.
Why this score? — see what drove the B- grade
The composite is a weighted blend of 9 inputs, each scored 0–100. Each bar is that input's sub-score; the figure is the points it added to the 100-point composite (weight × sub-score).
- Cash flow +30.0/30.0
- 1% rule +10.0/10.0
- DSCR +10.0/10.0
- ARV discount +5.0/15.0
- Rent growth +4.5/5.0
- Livability +3.8/5.0
- Condition / age +2.5/5.0
- Schools +1.9/10.0
- Appreciation +0.0/10.0
$119,900
🖨 Deal sheet 📄 Offer letter ✓ Due diligence
Listing remarks
Another rockin’ Rochester investment opportunity! This fully occupied side-by-side duplex features 3 bedrooms in each unit and is already cash flowing. Both units have been updated with vinyl windows throughout, vinyl flooring, and modernized kitchens. Current Certificate of Occupancy is valid through 4/1/2027. Current annual gross income is $29,100. Don’t miss your chance to add this solid income-producing property to your portfolio! Delayed negotiations are on file. All offers are due by 5/21/2026 at 3:00 PM.
Key facts
- Vinyl windows
- Vinyl flooring
- Side-by-side duplex
Tags
Property features AI
Finance
- Financial info: Owner pays grounds care and water; Operating expenses include trash and water/sewer
Exterior
- Parking: No driveway
- Utilities: Public water connected; Sewer connected
- Home design: Two-story property; Resale condition
- Construction: Composite siding; Asphalt roof; Block foundation; Built previously (existing)
- Exterior features: Covered porch
Interior
- Flooring: Ceramic tile; Vinyl; Varies
- Bathrooms: 2 full bathrooms
- Heating & cooling: Gas forced air heating
- Interior features: Thermal windows; Full basement
- Laundry & utility: Gas water heater
Neighborhood map
What this means for you Summary
Snapshot
- This is a 6-bed/2.0-bath townhouse listed at $120k.
Deal economics
- At list price, monthly cash flow is $827 ($10k/yr) — positive.
- The deal already cash-flows at list — no discount required.
- Meets the 1% rule at list price ($2k rent vs $120k).
- Cap rate 14.6% vs local median 9.3% in Rochester — top-decile yield for the area; either an underpriced asset or a hidden risk that comps aren't pricing in. Stress-test before assuming the spread holds.
Location & tenants
- Location reads 76/100 on livability (#222 in NY, #3,482 nationally) — a middle-class / working-renter tenant base. Strengths: commute A+, cost of living A+, housing A+; Watch: schools D+, crime F, employment F.
- Rochester City School District (urban): math 21% / reading 26% proficiency, ranked #589 of 590 in NY (top 100%) — low school quality limits family demand, transient renter base, plan for 1-2y turnover; 82% free/reduced lunch — lower-income household profile, screen leases tightly.
- Market conditions: Rents rising fast (+7.9%/yr); 199 active listings in the ZIP; 1,169 units permitted in Monroe County in 2024 (591 in 5+ unit buildings).
- This rent runs 39% of the median local income ($65k/yr) — at the standard rent-burdened threshold; future hikes will face affordability resistance.
Forward outlook
- Local home prices are declining (-3.0%/yr); year-one equity from $829 of loan paydown is wiped out by about $4k of value loss. Plan a longer hold.
- Monroe County population projected to shrink 6% by 2050 — rents likely to lag national; underwrite the cash flow, not the appreciation.
- At projected returns (-3.0% appreciation + 7.9% rent growth), your $34k cash investment doubles in ~4 years — after that, you're playing with house money.
Negotiation context
- Only 14 days on market — expect competitive offers; lowballing is unlikely to land.
- 2 sale attempts since 13y ago with the ask held roughly flat each time — persistent listings suggest the price (not the market) is what's stuck; bring a comps-based counter.
Risks & watch-outs
- Watch-outs: built in 1915 — expect roof / HVAC / electrical / plumbing capex.
- Climate carrying-cost: major flood risk — expect insurance premiums to compound above CPI over the hold.
Questions for the listing agent
- Built in 1915 — when were the roof, HVAC, electrical panel, plumbing, and water heater last replaced?
- Is there a deadline driving the sale (1031 exchange, divorce, estate, relocation)? That informs how much negotiation room exists.
- Schools are D-rated, which usually means shorter tenancies and higher turnover. Who's the typical renter profile here, and what's been the actual vacancy rate?
- Crime grade is F in this area — have there been break-ins, vandalism, or insurance claims at this property in the last 3 years? What carrier currently insures it and at what premium?
- What's the average days-on-market for RENTAL listings here right now (not sales)? A rising rental-DOM trend means longer vacancies and softer asking-rent achievability than the comps imply.
- What's the recent tenant-quality profile in this submarket — average credit score on applications, eviction rate, late-payment / NSF rate, and stable-employment percentage? A property-management company in the area should have these aggregated.
- How much new for-sale + rental construction is in the pipeline within 1–3 miles? Heavy new supply typically softens prices + rents 12–24 months out; constrained supply supports both.
Investment metrics
- 1% rule
- 1.75% ✓
- Cap rate
- 14.57%
- Cash-on-cash
- 29.57%
- DSCR
- 2.32
- GRM
- 4.8
CMA / ARV
- ARV (median comp)
- $113,654
- List price
- $119,900
- Delta
- 5.50%
- Verdict
- FAIR
- Comps
- 20 within 1.0 mi
Show comp detail 10 sales within ~0.75 mi
| Address | Dist | Beds/Ba | Sqft | Sold | Price | $/sf | Match |
|---|---|---|---|---|---|---|---|
| 54-56 Melville St | 0.28mi | 6/2.0 | 2,220 (-3%) | 2mo | $185,000 | $83 | 79 |
| 129-131 Winterroth St | 0.27mi | 6/2.0 | 2,409 (+5%) | 13mo | $125,000 | $52 | 68 |
| 208-210 Cummings St | 0.35mi | 6/2.0 | 2,436 (+6%) | 9mo | $130,000 | $53 | 66 |
| 36 Ferndale Cres | 0.40mi | 5/2.0 (-1) | 2,394 (+4%) | 14mo | $65,000 | $27 | 58 |
| 6 8th St | 0.31mi | 5/2.0 (-1) | 2,114 (-8%) | 20mo | $84,900 | $40 | 51 |
| 63 Peck St | 0.63mi | 6/2.0 | 2,571 (+12%) | 2mo | $119,999 | $47 | 49 |
| 32 Quincy St | 0.67mi | 6/2.0 | 2,418 (+5%) | 15mo | $135,000 | $56 | 48 |
| 194 3rd St | 0.60mi | 6/2.0 | 2,016 (-12%) | 14mo | $79,900 | $40 | 40 |
| 1291 N Goodman St | 0.56mi | 5/2.0 (-1) | 2,030 (-12%) | 22mo | $135,000 | $67 | 31 |
| 1342 Clifford Ave | 0.74mi | 7/4.0 (+1) | 2,600 (+13%) | 24mo | $100,000 | $38 | 10 |
Match score weights: distance 35% · size 25% · config 20% · recency 20%. Top-matched comps best support the ARV.
Projected returns pro-forma
-3.0% appreciation · 7.89% rent growth · sell at horizon
- IRR
- 29.5%
- Equity multiple
- 2.31×
- Total profit
- $44,111
- Equity at exit
- $17,877
- IRR
- 39.6%
- Equity multiple
- 5.63×
- Total profit
- $155,522
- Equity at exit
- $10,367
Cash invested: $33,572 (down + closing). Projections, not guarantees.
Landlord ↔ Tenant lean methodology
- Overall (STATE)
- 15 Strongly Tenant-Friendly
- State New York
- 15 Strongly Tenant-Friendly · D+10
- County
- — inherits STATE
- City
- — inherits STATE
ZIP-level market 14609
- Home prices YoY
- -30.4%
- Rents YoY
- 7.9%
- Active inventory
- 199
- Price-to-rent
- 4.8×
Monthly cashflow live
- Estimated rent
- $2,096 medium interval (Pro) →
- Mortgage (P&I)
- −$629
- Tax est. 1.5%
- −$150 /mo · $1,798/yr
- Insurance
- −$50
- HOA
- −$0
- Vacancy / Maint / Mgmt
- −$440
- Net cashflow
- $827
Break-even live
UW: 25.0% down · 7.5% · 30yr · 1.5% tax · 5.0% vac · 8.0% maint · 8.0% mgmt
Financing live
Cash to close
- Down payment
- $29,975
- Closing costs
- $3,597
- Reserves months
- —
- Total cash needed
- —
Loan-product check · same deal, 3 products live
Conventional
25% down · 7.5% · 30yr
- Down + closing
- —
- Monthly P&I
- —
- Monthly cashflow
- —
- DSCR
- —
- Eligible?
- —
Personal DTI + credit; lowest rate.
DSCR
20% down · 8.5% · 30yr
- Down + closing
- —
- Monthly P&I
- —
- Monthly cashflow
- —
- DSCR
- —
- Eligible?
- —
No personal income docs; deal must DSCR.
Hard money
10% down · 12.0% · 12mo
- Down + closing
- —
- Monthly P&I
- —
- Monthly cashflow
- —
- DSCR
- —
- Eligible?
- —
Short-term bridge; refi at stabilization.
Listing history 2 events
-
2026-05-11$119,900 Active 529-char remark
-
2013-07-10$44,900
ⓘ Source: listings_history table (triggers on properties + properties_extension) + one-shot
backfill from property_details.listing_events for pre-trigger history.
Climate risk First Street
- Flood 6/10 Major FEMA zone X (unshaded) · 68% chance over 30 yrs
- Wildfire 1/10 Low
- Heat 2/10 Low 7 d/yr ≥95°F today · 14 d/yr by 30 yrs out
- Wind 1/10 Low
- Air quality 2/10 Low 1 unhealthy d/yr today · 2 by 30 yrs out
Nearby sold comps map
Loading sold comps map…
Walkable amenities ~0.75 mi
Loading nearby amenities…
Taxation est. · year 1
- Rental income
- $25,152
- − Mortgage interest
- −$6,716
- − Property taxes
- −$1,798
- − Insurance
- −$600
- − Repairs & maintenance
- −$2,012
- − Management
- −$2,012
- − Depreciation
- −$3,488
- Taxable income
- $8,525
- Est. tax owed @ 24.0%
- −$2,046
- After-tax cash flow
- $7,881/yr
For passive investors: Depreciation is non-cash, so a rental often shows a tax loss while cash-flowing — sheltering income. Rental losses are passive: they offset passive income freely, and up to $25,000/yr can offset ordinary (W-2) income if you actively participate and your MAGI is under $100k (phasing out to $0 by $150k); unused losses carry forward. On sale, claimed depreciation is recaptured at up to 25%, and gains may owe capital-gains tax (a 1031 exchange can defer both). Figures are a year-1 estimate at your 24.0% rate — not tax advice; consult a CPA.
Schools (NCES district)
- District
- Rochester City School District
- NCES district ID
- 3624750
- Math proficiency
- 21% ▬ 0.00%
- Reading proficiency
- 26% ▲ 4.00%
- Median HH income
- $30,923
- Composite
- 18.98/100
- National rank
- #8850
- State rank
- #589 of 590 in NY
Livability — Rochester
- Score
- 76/100
- State rank
- #222
- US rank
- #3482
Category grades
Schools grade is shown separately in the Schools card above.
Census & demographics
- Census place
- Rochester, NY
- County
- Monroe County · 674,131 people
- City population
- 432,803
- Metro
- Rochester, NY
- Population (ZIP)
- 40,274
- Household income
- $64,603
- Rent vs Own
- Severe rent burden
- 2183.0
Population outlook (Monroe County) Hauer SSP2
- Today (2025)
- 759,460 people
- By 2030
- 757,154 · -0.3%
- By 2040
- 740,644 · -2.5%
- By 2050
- 714,443 · -5.9%
- By 2075
- 645,883 · -15.0%
- By 2100
- 547,084 · -28.0%
Race, ethnicity, and origin ACS 2023
- Neighborhood character
- Diverse neighborhood (Simpson 0.69)
- Race & ethnicity
- White 44% Black 28% Hispanic / Latino 20% Two or more races 10% Asian 2%
- Hispanic origin (detail)
- Puerto Rican 15% Cuban 1% Dominican 1%
- Common ancestry
- Romanian 4% Lithuanian 2% Iranian 1%
- Foreign-born
- 8% · Canada
- Languages at home
- 81% English-only · Spanish 14% Russian/Polish/Slavic 2% Other Indo-European 1%
Political lean MEDSL · Monroe
- 2024 margin
- D (+19.1) · D 59.5% · R 40.5%
- 2008→2024 swing
- +1.4pp toward D · 2008: 17.7pp · 2024: 19.1pp
- All cycles
- 2024: D+19.1 2020: D+21.0 2016: D+14.1 2012: D+17.4 2008: D+17.7
Not yet ingested
- Civics
- —
Market trends
- HPI YoY
- ▼ -143.57%
- Current HPI
- 328.7053
- Rent YoY
- ▲ 7.89%
- Metro
- Rochester, NY
- State GDP YoY
- ▲ 2.60%
- F500 in state
- 92
Industry mix (Fortune 500 HQ in NY)
| Industry | F500 HQs | Revenue |
|---|---|---|
| Financial Services | 10 | $950B |
|
||
| Consumer Goods | 9 | $162B |
|
||
| Insurance | 4 | $225B |
|
||
| Telecommunications | 2 | $144B |
|
||
| Pharmaceuticals | 2 | $112B |
|
||
| Media / Entertainment | 2 | $69B |
|
||
Price history
+167.0% since first listed3 events — show timeline
- 2026-05-28 Pending — UNYREIS
- 2026-05-11 Listed $119,900 UNYREIS
- 2013-07-10 Listed $44,900 UNYREIS
Cash-flow waterfall
monthlySold comps — $/sqft
last 12 mo · ≤1 miLoading sold comps…