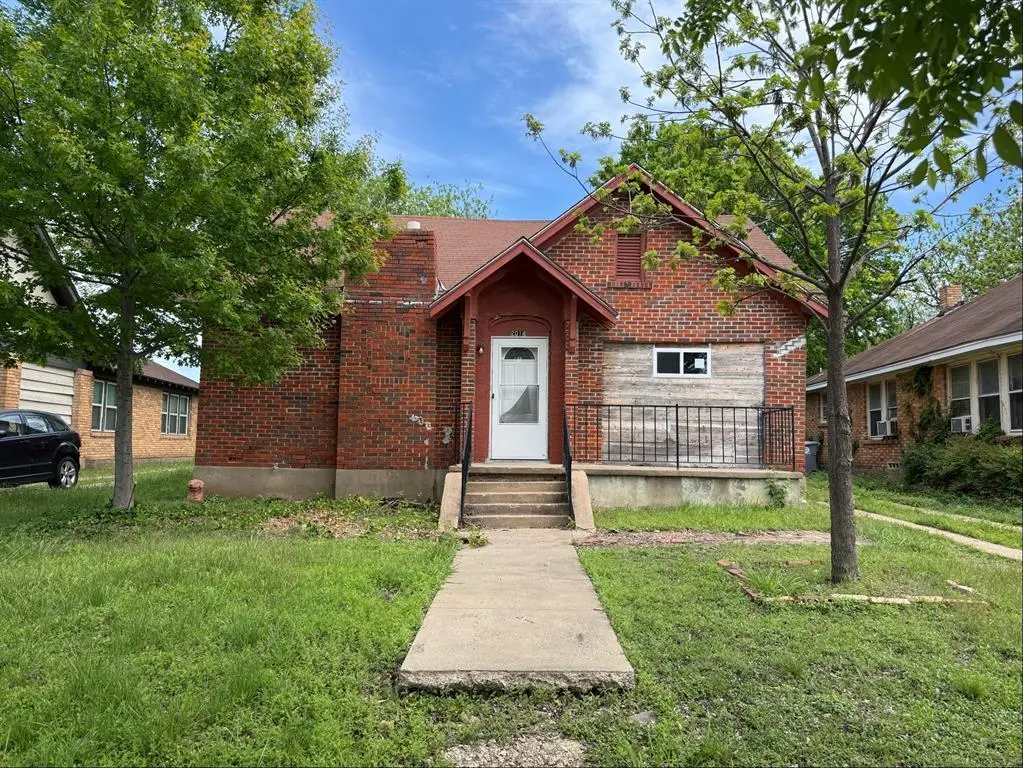
2014 Berwick Ave · Dallas, TX
Flood risk 1/10 · Minimal
- FEMA flood zone
- X (unshaded)
- Chance of flooding over 30 yrs
- 0.0%
- Est. flood insurance / yr
- $507 – $1,088
Fire risk 1/10 · Minimal
- Est. fire insurance / yr
- $1,222 – $2,270
Heat risk 7/10 · Major
- Hot days now (above 109°F)
- 7 days/yr
- Hot days in 30 yrs
- 22 days/yr
Wind risk 6/10 · Moderate
- Chance of severe wind over 30 yrs
- 27.0%
Air-quality risk 2/10 · Minimal
- Unhealthy air days now
- 1 days/yr
- Unhealthy air days in 30 yrs
- 2 days/yr
Risk factors via First Street. Map © Google.
Why this score? — see what drove the B+ grade
The composite is a weighted blend of 9 inputs, each scored 0–100. Each bar is that input's sub-score; the figure is the points it added to the 100-point composite (weight × sub-score).
- Cash flow +23.8/30.0
- ARV discount +15.0/15.0
- Appreciation +10.0/10.0
- 1% rule +8.3/10.0
- DSCR +7.7/10.0
- Livability +4.0/5.0
- Schools +2.8/10.0
- Condition / age +2.5/5.0
- Rent growth +1.8/5.0
$139,999
🖨 Deal sheet 📄 Offer letter ✓ Due diligence
Listing remarks
INVESTOR SPECIAL! Rare opportunity to acquire a true fixer upper on a large lot with tremendous upside potential. This AS IS property is ideal for investors, flippers, landlords, buy and hold investors, BRRRR operators, seller finance investors, and cash buyers looking for their next project. Property needs rehab, repairs, updates, and TLC throughout but offers strong value-add potential for the right buyer. Whether your strategy is a full renovation and resale, fixxer upper, long-term rental, owner finance exit, or portfolio addition, this property presents multiple investment opportunities. Seller is motivated and ready to make a deal but will make absolutely no repairs. Bring your contra
Key facts
- Large lot
- 8,189 sq ft lot
- Built 1925
Tags
Property features AI
Finance
- Other: No special taxing entities; No known restrictions; Will not subdivide
- Financial info: Listing accepts Cash and FHA-203K
- HOA & community: No association; Other community features
Exterior
- Parking: Driveway
- Security: Other security features
- Utilities: City water; City sewer; Other utilities; Not in a municipal utility district
- Home design: Single family residence; One-story; Residential property; Preowned (built in 1925)
- Construction: Composition roof; Other construction materials; Other foundation details; Built in 1925
- Exterior features: Deck; Other exterior features; Few trees on the lot; Wood fencing
Interior
- Kitchen: Other appliances
- Bedrooms: Three bedrooms (primary bedroom on main level)
- Flooring: Wood flooring
- Bathrooms: One full bathroom
- Heating & cooling: Other heating
- Interior features: Two total rooms (one living area and one dining area); Accessible entrance; Other interior features
- Laundry & utility: Other laundry features
Neighborhood map
What this means for you Summary
Snapshot
- This is a 2-bed/1.0-bath single-family listed at $140k.
Deal economics
- At list price, monthly cash flow is $268 ($3k/yr) — positive.
- The deal already cash-flows at list — no discount required.
- Meets the 1% rule at list price ($2k rent vs $140k).
- Cap rate 8.6% vs local median 2.3% in Dallas — top-decile yield for the area; either an underpriced asset or a hidden risk that comps aren't pricing in. Stress-test before assuming the spread holds.
Location & tenants
- Location reads 81/100 on livability (#24 in TX, #1,380 nationally) — a professional / high-income tenant draw. Strengths: amenities A+, commute A+, housing A+; Watch: crime F.
- Dallas ISD (urban): math 31% / reading 36% proficiency, ranked #559 of 826 in TX (top 68%) — families likely to look elsewhere, expect single-tenant / working-renter base with shorter leases; 83% free/reduced lunch — lower-income household profile, screen leases tightly.
- Zoned schools: Cedar Crest El (math 52% / reading 37%, grade F, #1,155 of 4,322 statewide, top 29%, 321 students, 100% FRL) — zoned schools average 100% FRL vs 83% district-wide (16 pts higher); higher-poverty schools than district average — tighter screening recommended.
- Market conditions: Rents soft (-2.7%/yr); 142 active listings in the ZIP; 34 comparable units currently listed for rent nearby; rentals at typical pace (median 24d on market — plan ~3-4 weeks tenant-placement turnaround); 12,577 units permitted in Dallas County in 2024 (6,829 in 5+ unit buildings).
- At $1,862/mo this rent would consume 48% of the median local household income ($47k/yr) (locally 948% of renters already pay >50% of income on rent) — very limited rent-growth headroom before tenants either downsize or default.
Forward outlook
- In year one you build about $15k of equity ($968 loan paydown + $14k appreciation (10.0% local appreciation)).
- Dallas County population projected at +35% by 2050 — long-run rental-demand tailwind backs the buy-and-hold thesis.
- At projected returns (10.0% appreciation + 0.0% rent growth), your $39k cash investment doubles in ~3 years — after that, you're playing with house money.
- By year 3, paydown + projected appreciation supports a ~$38k cash-out refi (75% LTV) — recoverable capital for the next deal without selling this one.
Negotiation context
- Only 2 days on market — expect competitive offers; lowballing is unlikely to land.
Risks & watch-outs
- Watch-outs: property tax is 3.5% of price; built in 1925 — expect roof / HVAC / electrical / plumbing capex.
- Climate carrying-cost: major wind risk, 27% chance of damaging wind over 30y; extreme-heat days projected 7→22/yr by 2055 (HVAC capex compounding) — expect insurance premiums to compound above CPI over the hold.
Questions for the listing agent
- Built in 1925 — when were the roof, HVAC, electrical panel, plumbing, and water heater last replaced?
- Property tax is high relative to price — has the assessment been appealed recently, and will the sale trigger a re-assessment?
- Is there a deadline driving the sale (1031 exchange, divorce, estate, relocation)? That informs how much negotiation room exists.
- Crime grade is F in this area — have there been break-ins, vandalism, or insurance claims at this property in the last 3 years? What carrier currently insures it and at what premium?
- What's the average days-on-market for RENTAL listings here right now (not sales)? A rising rental-DOM trend means longer vacancies and softer asking-rent achievability than the comps imply.
- What's the recent tenant-quality profile in this submarket — average credit score on applications, eviction rate, late-payment / NSF rate, and stable-employment percentage? A property-management company in the area should have these aggregated.
- How much new for-sale + rental construction is in the pipeline within 1–3 miles? Heavy new supply typically softens prices + rents 12–24 months out; constrained supply supports both.
Investment metrics
- 1% rule
- 1.33% ✓
- Cap rate
- 8.59%
- Cash-on-cash
- 8.20%
- DSCR
- 1.37
- GRM
- 6.3
CMA / ARV
- ARV (on-the-fly)
- $264,228
- Comps found
- 12
Show comp detail 12 sales within ~0.75 mi
| Address | Dist | Beds/Ba | Sqft | Sold | Price | $/sf | Match |
|---|---|---|---|---|---|---|---|
| 1721 Essex Ave | 0.06mi | 2/1.0 | 1,275 (-6%) | 9mo | $265,000 | $208 | 79 |
| 2014 Huntingdon Ave | 0.32mi | 3/2.0 (+1) | 1,320 (-3%) | 8mo | $240,000 | $182 | 64 |
| 1431 Carson St | 0.60mi | 3/2.0 (+1) | 1,345 (-1%) | 1mo | $299,000 | $222 | 60 |
| 1356 S Denley Dr | 0.54mi | 3/2.0 (+1) | 1,400 (+3%) | 3mo | $245,000 | $175 | 59 |
| 1826 Norfolk Ave | 0.22mi | 2/2.0 | 1,200 (-12%) | 9mo | $259,000 | $216 | 58 |
| 1411 E Waco Ave | 0.60mi | 3/2.0 (+1) | 1,300 (-5%) | 6mo | $263,800 | $203 | 51 |
| 1539 E Woodin Blvd | 0.48mi | 3/2.0 (+1) | 1,528 (+12%) | 2mo | $289,000 | $189 | 47 |
| 1439 E Louisiana Ave | 0.47mi | 3/2.5 (+1) | 1,550 (+14%) | 1mo | $485,000 | $313 | 44 |
| 1543 E Illinois Ave | 0.61mi | 3/1.0 (+1) | 1,205 (-12%) | 4mo | $125,000 | $104 | 44 |
| 2323 Van Cleave Dr | 0.67mi | 3/2.0 (+1) | 1,517 (+11%) | 3mo | $294,000 | $194 | 38 |
| 1215 Iowa Ave | 0.59mi | 3/2.0 (+1) | 1,204 (-12%) | 9mo | $200,000 | $166 | 36 |
| 1108 Winters St | 0.69mi | 3/2.0 (+1) | 1,524 (+12%) | 8mo | $220,000 | $144 | 32 |
Match score weights: distance 35% · size 25% · config 20% · recency 20%. Top-matched comps best support the ARV.
Projected returns pro-forma
10.0% appreciation · 0.0% rent growth · sell at horizon
- IRR
- 28.8%
- Equity multiple
- 3.25×
- Total profit
- $88,031
- Equity at exit
- $126,122
- IRR
- 24.1%
- Equity multiple
- 7.03×
- Total profit
- $236,389
- Equity at exit
- $271,987
Cash invested: $39,200 (down + closing). Projections, not guarantees.
Landlord ↔ Tenant lean methodology
- Overall (STATE)
- 87 Strongly Landlord-Friendly
- State Texas
- 87 Strongly Landlord-Friendly · R+5
- County
- — inherits STATE
- City
- — inherits STATE
ZIP-level market 75203
- Home prices YoY
- 31.8%
- Rents YoY
- -2.7%
- Active inventory
- 142
- Price-to-rent
- 6.3×
Monthly cashflow live
- Estimated rent
- $1,862 high interval (Pro) →
- Mortgage (P&I)
- −$734
- Tax from tax record
- −$410 /mo · $4,926/yr
- Insurance
- −$58
- HOA
- −$0
- Vacancy / Maint / Mgmt
- −$391
- Net cashflow
- $268
Break-even live
UW: 25.0% down · 7.5% · 30yr · 1.5% tax · 5.0% vac · 8.0% maint · 8.0% mgmt
Financing live
Cash to close
- Down payment
- $35,000
- Closing costs
- $4,200
- Reserves months
- —
- Total cash needed
- —
Loan-product check · same deal, 3 products live
Conventional
25% down · 7.5% · 30yr
- Down + closing
- —
- Monthly P&I
- —
- Monthly cashflow
- —
- DSCR
- —
- Eligible?
- —
Personal DTI + credit; lowest rate.
DSCR
20% down · 8.5% · 30yr
- Down + closing
- —
- Monthly P&I
- —
- Monthly cashflow
- —
- DSCR
- —
- Eligible?
- —
No personal income docs; deal must DSCR.
Hard money
10% down · 12.0% · 12mo
- Down + closing
- —
- Monthly P&I
- —
- Monthly cashflow
- —
- DSCR
- —
- Eligible?
- —
Short-term bridge; refi at stabilization.
Rent comps 34 comps
| Address | Beds | Baths | Sqft | Rent | $/sqft | DOM | Units | Dist |
|---|---|---|---|---|---|---|---|---|
| 2118 Berwick Ave Dallas, TX | 3.0 | 2.0 | 1286 | $2,188 | $1.70 | 7d | 1 | 0.17mi |
| 1835 Norfolk Ave Dallas, TX | 3.0 | 2.0 | 1666 | $2,200 | $1.32 | 43d | 1 | 0.29mi |
| 1835 Norfolk Ave Dallas, TX | 3.0 | 2.0 | 1666 | $2,200 | $1.32 | 24d | 1 | 0.29mi |
| 1427 Diceman Ave Dallas, TX | 3.0 | 2.0 | 890 | $1,600 | $1.80 | 24d | 1 | 0.62mi |
| 948 S Corinth Street Rd Unit 6 Dallas, TX | 2.0 | 2.0 | 1013 | $1,625 | $1.60 | 13d | 1 | 0.65mi |
| 2254 Areba St Unit A Dallas, TX | 2.0 | 1.0 | 1120 | $1,450 | $1.29 | 43d | 1 | 0.68mi |
| 2254 Areba St Dallas, TX | 2.0 | 1.0 | 1120 | $1,425 | $1.27 | 7d | 1 | 0.68mi |
| 948 S Corinth Street Rd #1 Dallas, TX | 2.0 | 2.0 | 1013 | $1,650 | $1.63 | 43d | 1 | 0.74mi |
| 948 S Corinth Street Rd #5 Dallas, TX | 2.0 | 2.0 | 920 | $1,550 | $1.68 | 43d | 1 | 0.74mi |
| 948 S Corinth Street Rd #1 Dallas, TX | 2.0 | 2.0 | 1013 | $1,650 | $1.63 | 24d | 1 | 0.74mi |
| 2023 E Illinois Ave Dallas, TX | 2.0 | 1.5 | 1304 | $1,695 | $1.30 | 21d | 1 | 0.75mi |
| 1710 Morrell Ave Dallas, TX | 2.0 | 1.0–2.0 | 654 | $2,069 | $3.16 | 2d | 40 | 0.75mi |
| 1018 E Waco Ave Dallas, TX | 3.0 | 1.0 | 1112 | $1,395 | $1.25 | 44d | 1 | 0.83mi |
| 2723 Kellogg Ave Dallas, TX | 3.0 | 2.0 | 1255 | $1,700 | $1.35 | 7d | 1 | 0.86mi |
| 2701 Easter Ave Dallas, TX | 3.0 | 2.0 | 1632 | $2,200 | $1.35 | 4d | 1 | 0.92mi |
| 715 Dover St Dallas, TX | 3.0 | 2.0 | 1180 | $1,995 | $1.69 | 7d | 1 | 0.95mi |
| 1717 Hemphill Dr Dallas, TX | 3.0 | 1.0 | 1222 | $1,695 | $1.39 | 24d | 1 | 0.95mi |
| 1027 Morrell Ave Dallas, TX | 2.0 | 1.0 | 1140 | $1,800 | $1.58 | 44d | 1 | 1.02mi |
| 1028 Claude St Dallas, TX | 2.0 | 1.0 | 988 | $1,800 | $1.82 | 24d | 1 | 1.04mi |
| 2611 Fernwood Ave Dallas, TX | 3.0 | 2.0 | 1528 | $2,000 | $1.31 | 24d | 1 | 1.06mi |
| 3206 Kellogg Ave Dallas, TX | 3.0 | 1.5 | 1076 | $1,800 | $1.67 | 43d | 1 | 1.07mi |
| 801 Avenue I Unit 1-205 Dallas, TX | 2.0 | 2.0 | 1185 | $2,099 | $1.77 | 2d | 1 | 1.09mi |
| 3320 Mundy Dr Dallas, TX | 3.0 | 2.0 | 1010 | $1,695 | $1.68 | 43d | 1 | 1.13mi |
| 1511 Doyle Ave Dallas, TX | 3.0 | 2.0 | 1262 | $1,900 | $1.51 | 7d | 1 | 1.17mi |
| 2423 Maryland Ave Dallas, TX | 2.0 | 2.0 | 1102 | $2,350 | $2.13 | 43d | 1 | 1.17mi |
| 850 S Ewing Ave Dallas, TX | 1.0–2.0 | 1.0–2.5 | 1086 | $2,450 | $2.25 | 3d | 2 | 1.18mi |
| 1310 Michigan Ave Dallas, TX | 3.0 | 2.0 | 972 | $1,900 | $1.95 | 24d | 1 | 1.19mi |
| 2406 S Marsalis Ave Dallas, TX | 2.0 | 1.0 | 956 | $1,700 | $1.78 | 43d | 1 | 1.19mi |
| 2538 Stovall Dr Dallas, TX | 3.0 | 1.0 | 986 | $1,625 | $1.65 | 5d | 1 | 1.20mi |
| 1810 Ramsey Ave Dallas, TX | 3.0 | 2.0 | 1546 | $2,350 | $1.52 | 43d | 1 | 1.36mi |
| 1715 Ramsey Ave Dallas, TX | 2.0 | 1.0 | 1092 | $1,750 | $1.60 | 24d | 1 | 1.38mi |
| 2669 Marfa Ave Unit 3 Dallas, TX | 1.0 | 1.0 | 1248 | $750 | $0.60 | 24d | 1 | 1.40mi |
| 405 S Ewing Ave Unit 406 Dallas, TX | 2.0 | 2.0 | 1102 | $2,550 | $2.31 | 43d | 1 | 1.45mi |
| 405 S Ewing Ave Unit 309 Dallas, TX | 3.0 | 2.0 | 1343 | $2,875 | $2.14 | 24d | 1 | 1.45mi |
Listing history 3 events
-
2026-06-18days on market $139,999 Active 2 DOM
-
2026-06-17remarks 699-char remark
-
2026-06-17$139,999 Active 1 DOM
ⓘ Source: listings_history table (triggers on properties + properties_extension) + one-shot
backfill from property_details.listing_events for pre-trigger history.
Tax reassessment forecast TX · Resets to sale price
- Current annual tax
- $4,926 · $410/mo
- Projected year-2 tax
- $4,926 · $410/mo
- Expected delta
- $0/yr ($0/mo · 0.0%)
ⓘ Screening estimate from a state-policy table — verify with the county assessor before closing.
Climate risk First Street
- Flood 1/10 Low FEMA zone X (unshaded) · 0% chance over 30 yrs
- Wildfire 1/10 Low
- Heat 7/10 Severe 7 d/yr ≥109°F today · 22 d/yr by 30 yrs out
- Wind 6/10 Major 27% chance of damaging wind over 30 yrs
- Air quality 2/10 Low 1 unhealthy d/yr today · 2 by 30 yrs out
Nearby sold comps map
Loading sold comps map…
Walkable amenities ~0.75 mi
Loading nearby amenities…
Taxation est. · year 1
- Rental income
- $22,344
- − Mortgage interest
- −$7,842
- − Property taxes
- −$4,926
- − Insurance
- −$700
- − Repairs & maintenance
- −$1,788
- − Management
- −$1,788
- − Depreciation
- −$4,073
- Taxable income
- $1,228
- Est. tax owed @ 24.0%
- −$295
- After-tax cash flow
- $2,921/yr
For passive investors: Depreciation is non-cash, so a rental often shows a tax loss while cash-flowing — sheltering income. Rental losses are passive: they offset passive income freely, and up to $25,000/yr can offset ordinary (W-2) income if you actively participate and your MAGI is under $100k (phasing out to $0 by $150k); unused losses carry forward. On sale, claimed depreciation is recaptured at up to 25%, and gains may owe capital-gains tax (a 1031 exchange can defer both). Figures are a year-1 estimate at your 24.0% rate — not tax advice; consult a CPA.
Schools (NCES district)
- District
- Dallas ISD
- NCES district ID
- 4816230
- Math proficiency
- 31% ▼ -16.00%
- Reading proficiency
- 36% ▼ -4.00%
- Median HH income
- $42,881
- Composite
- 28.41/100
- National rank
- #6763
- State rank
- #559 of 826 in TX
Livability — Dallas
- Score
- 81/100
- State rank
- #24
- US rank
- #1380
Category grades
Schools grade is shown separately in the Schools card above.
Census & demographics
- Census place
- Dallas, TX
- County
- Dallas County · 2,612,404 people
- City population
- 1,168,437
- Metro
- Dallas-Fort Worth-Arlington, TX
- Population (ZIP)
- 15,775
- Household income
- $46,989
- Rent vs Own
- Severe rent burden
- 948.0
Population outlook (Dallas County) Hauer SSP2
- Today (2025)
- 2,979,839 people
- By 2030
- 3,191,823 · +7.1%
- By 2040
- 3,619,611 · +21.5%
- By 2050
- 4,026,915 · +35.1%
- By 2075
- 4,957,073 · +66.4%
- By 2100
- 5,508,725 · +84.9%
Race, ethnicity, and origin ACS 2023
- Neighborhood character
- Diverse neighborhood (Simpson 0.55)
- Race & ethnicity
- Hispanic / Latino 59% Black 31% Two or more races 17% White 7% Native American 2%
- Hispanic origin (detail)
- Mexican 53%
- Common ancestry
- Lithuanian 1% Swiss 1%
- Foreign-born
- 29% · Canada, China, Jamaica
- Languages at home
- 47% English-only · Spanish 51% French/Haitian/Cajun 1%
Political lean MEDSL · Dallas
- 2024 margin
- Strong D (+22.2) · D 60.2% · R 38.0% · Other 1.8%
- 2008→2024 swing
- +6.9pp toward D · 2008: 15.3pp · 2024: 22.2pp
- All cycles
- 2024: D+22.2 2020: D+31.6 2016: D+26.2 2012: D+15.4 2008: D+15.3
Not yet ingested
- Civics
- —
Market trends
- HPI YoY
- ▲ 86.64%
- Current HPI
- 358.9507
- Rent YoY
- ▼ -2.72%
- Metro
- Dallas-Fort Worth-Arlington, TX
- State GDP YoY
- ▲ 3.95%
- F500 in state
- 110
Industry mix (Fortune 500 HQ in TX)
| Industry | F500 HQs | Revenue |
|---|---|---|
| Energy | 16 | $1,198B |
|
||
| Technology | 5 | $198B |
|
||
| Engineering / Construction | 4 | $72B |
|
||
| Energy Services | 3 | $60B |
|
||
| Utilities | 3 | $41B |
|
||
| Healthcare | 2 | $330B |
|
||
Price history
3 events — show timeline
- 2026-06-16 Listed $139,999 NTREIS
- 2026-04-30 Sold (Public Records) — Public Records
- 2026-03-06 Sold (Public Records) — Public Records
Property tax history
+7.4%/yrLatest (2025): $4,926 · +5.7% YoY. Source: county tax records.
Cash-flow waterfall
monthlySold comps — $/sqft
last 12 mo · ≤1 miLoading sold comps…