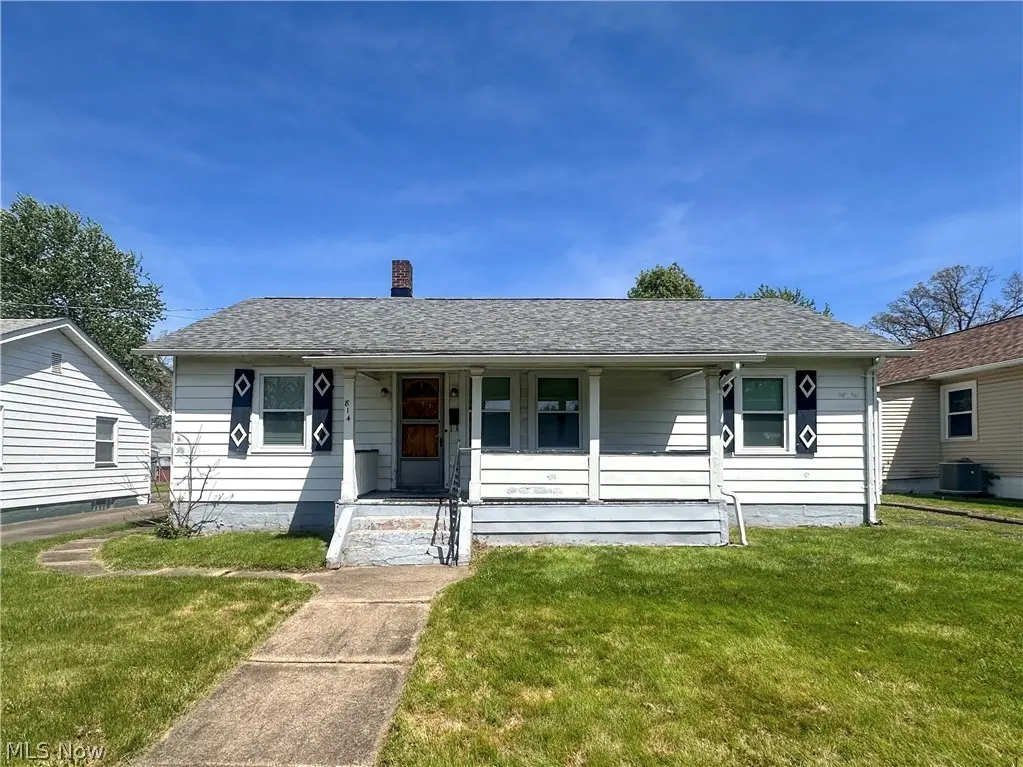
814 Griffin St · Niles, OH
Flood risk 1/10 · Minimal
- FEMA flood zone
- X (unshaded)
- Chance of flooding over 30 yrs
- 0.0%
- Est. flood insurance / yr
- $473 – $860
Fire risk 1/10 · Minimal
- Est. fire insurance / yr
- $713 – $1,323
Heat risk 3/10 · Minor
- Hot days now (above 97°F)
- 7 days/yr
- Hot days in 30 yrs
- 17 days/yr
Wind risk 1/10 · Minimal
- Chance of severe wind over 30 yrs
- —
Air-quality risk 3/10 · Minor
- Unhealthy air days now
- 1 days/yr
- Unhealthy air days in 30 yrs
- 4 days/yr
Risk factors via First Street. Map © Google.
Why this score? — see what drove the B grade
The composite is a weighted blend of 9 inputs, each scored 0–100. Each bar is that input's sub-score; the figure is the points it added to the 100-point composite (weight × sub-score).
- Cash flow +29.1/30.0
- ARV discount +15.0/15.0
- DSCR +10.0/10.0
- 1% rule +7.7/10.0
- Schools +3.7/10.0
- Livability +3.4/5.0
- Rent growth +2.5/5.0
- Condition / age +2.5/5.0
- Appreciation +0.0/10.0
$89,900
🖨 Deal sheet 📄 Offer letter ✓ Due diligence
Listing remarks
Welcome to 814 Griffin Street! This 3-bedroom, 1-bath ranch home features a spacious living room, eat-in kitchen, and a full basement. There is also a nice-sized backyard with a storage shed. Use your imagination and transform this cozy ranch into the home of your dreams.
Key facts
- Nice-sized backyard
- Full basement
- Storage shed
Tags
Property features AI
Exterior
- Parking: Driveway with gravel parking; no garage
- Utilities: Public water; Public sewer; Has heating (gas)
- Home design: Single-story home; Property listed as fixer condition; Above-grade finished area per assessor: 1,060
- Construction: Aluminum siding; Asphalt fiberglass roof
- Exterior features: Lot dimensions approximately 58 x 115
Interior
- Kitchen: Eat-in kitchen; Kitchen with linoleum flooring
- Bedrooms: 3 main-level bedrooms
- Flooring: Carpet in some bedrooms and living room; Linoleum in other bedrooms, kitchen, and bathroom
- Bathrooms: 1 full bathroom (main level)
- Heating & cooling: Gas heating
- Interior features: Eat-in kitchen; Full unfinished basement
- Laundry & utility: Laundry located in the basement
Neighborhood map
What this means for you Summary
Snapshot
- This is a 3-bed/1.0-bath single-family listed at $90k.
Deal economics
- At list price, monthly cash flow is $312 ($4k/yr) — positive.
- The deal already cash-flows at list — no discount required.
- Meets the 1% rule at list price ($1k rent vs $90k).
- Recommended offer: $87k (3.0% below list) — sets the bar for market timing.
- Cap rate 10.5% vs local median 5.8% in Niles — top-decile yield for the area; either an underpriced asset or a hidden risk that comps aren't pricing in. Stress-test before assuming the spread holds.
Location & tenants
- Location reads 67/100 on livability (#628 in OH) — a middle-class / working-renter tenant base. Strengths: cost of living A+, housing A+; Watch: crime D+, employment D, amenities F.
- Niles City (suburban): math 37% / reading 52% proficiency, ranked #507 of 656 in OH (top 77%) — families likely to look elsewhere, expect single-tenant / working-renter base with shorter leases.
- Market conditions: 65 active listings in the ZIP; 6 comparable units currently listed for rent nearby; rentals leasing fast (median 14d on market — plan ~1-2 weeks tenant-placement turnaround); 129 units permitted in Trumbull County in 2024 (0 in 5+ unit buildings).
Forward outlook
- Local home prices are declining (-3.0%/yr); year-one equity from $622 of loan paydown is wiped out by about $3k of value loss. Plan a longer hold.
- Trumbull County population projected at -22% by 2050 — secular population decline; favor cash flow + early exit over multi-decade hold.
- At projected returns (-3.0% appreciation + 3.0% rent growth), your $25k cash investment doubles in ~8 years — after that, you're playing with house money.
Negotiation context
- It's been on market 38 days — a 3% lower offer ($87k) is reasonable based on typical stale-listing flexibility.
- 2 sale attempts; this cycle's ask has dropped $10k (10%) from the opening price — seller is motivated, your offer sets the floor, not the list.
Risks & watch-outs
- Watch-outs: built in 1918 — expect roof / HVAC / electrical / plumbing capex.
Questions for the listing agent
- It's been on market 38 days. Have you received any prior offers? Is the seller open to a 3% concession, seller financing, or rate buy-down credit?
- Built in 1918 — when were the roof, HVAC, electrical panel, plumbing, and water heater last replaced?
- Is there a deadline driving the sale (1031 exchange, divorce, estate, relocation)? That informs how much negotiation room exists.
- Schools are B-rated — typically a magnet for longer-tenancy family renters. What's the average tenant stay here, and is there a school-zone premium baked into asking?
- Crime grade is D in this area — have there been break-ins, vandalism, or insurance claims at this property in the last 3 years? What carrier currently insures it and at what premium?
- What's the average days-on-market for RENTAL listings here right now (not sales)? A rising rental-DOM trend means longer vacancies and softer asking-rent achievability than the comps imply.
- What's the recent tenant-quality profile in this submarket — average credit score on applications, eviction rate, late-payment / NSF rate, and stable-employment percentage? A property-management company in the area should have these aggregated.
- How much new for-sale + rental construction is in the pipeline within 1–3 miles? Heavy new supply typically softens prices + rents 12–24 months out; constrained supply supports both.
Investment metrics
- 1% rule
- 1.27% ✓
- Cap rate
- 10.45%
- Cash-on-cash
- 14.85%
- DSCR
- 1.66
- GRM
- 6.5
CMA / ARV
- ARV (median comp)
- $124,456
- List price
- $89,900
- Delta
- -27.77%
- Verdict
- UNDERPRICED
- Comps
- 20 within 1.0 mi
Show comp detail 12 sales within ~0.75 mi
| Address | Dist | Beds/Ba | Sqft | Sold | Price | $/sf | Match |
|---|---|---|---|---|---|---|---|
| 804 Hartzell Ave | 0.22mi | 2/1.5 (-1) | 1,086 (+2%) | 0mo | $168,700 | $155 | 78 |
| 213 N Bentley Ave | 0.37mi | 3/1.0 | 1,088 (+3%) | 6mo | $40,000 | $37 | 73 |
| 819 Niles Vienna Rd | 0.28mi | 3/2.0 | 1,125 (+6%) | 1mo | $148,000 | $132 | 72 |
| 504 Lincoln Ave | 0.20mi | 3/2.0 | 1,175 (+11%) | 4mo | $165,000 | $140 | 66 |
| 732 Washington Ave | 0.05mi | 2/1.0 (-1) | 1,179 (+11%) | 11mo | $132,500 | $112 | 64 |
| 14 Evans St | 0.41mi | 2/1.5 (-1) | 994 (-6%) | 2mo | $145,000 | $146 | 62 |
| 1411 Gypsy Ln | 0.68mi | 3/1.0 | 1,056 (-0%) | 8mo | $181,800 | $172 | 61 |
| 39 Wayne St | 0.32mi | 2/1.0 (-1) | 936 (-12%) | 10mo | $90,000 | $96 | 52 |
| 1503 Gypsy Ln | 0.75mi | 3/1.5 | 988 (-7%) | 3mo | $205,000 | $207 | 50 |
| 1115 Estelle Ct | 0.56mi | 2/1.0 (-1) | 944 (-11%) | 8mo | $136,000 | $144 | 44 |
| 1442 Youll St | 0.73mi | 3/3.0 | 1,184 (+12%) | 1mo | $168,000 | $142 | 38 |
| 1422 Youll St | 0.70mi | 3/1.0 | 1,198 (+13%) | 10mo | $121,400 | $101 | 37 |
Match score weights: distance 35% · size 25% · config 20% · recency 20%. Top-matched comps best support the ARV.
Projected returns pro-forma
-3.0% appreciation · 3.0% rent growth · sell at horizon
- IRR
- 5.4%
- Equity multiple
- 1.21×
- Total profit
- $5,274
- Equity at exit
- $13,404
- IRR
- 14.8%
- Equity multiple
- 2.20×
- Total profit
- $30,140
- Equity at exit
- $7,773
Cash invested: $25,172 (down + closing). Projections, not guarantees.
Landlord ↔ Tenant lean methodology
- Overall (STATE)
- 73 Landlord-Friendly
- State Ohio
- 73 Landlord-Friendly · R+6
- County
- — inherits STATE
- City
- — inherits STATE
ZIP-level market 44446
- Home prices YoY
- -19.9%
- Active inventory
- 65
- Price-to-rent
- 6.5×
Monthly cashflow live
- Estimated rent
- $1,145 high interval (Pro) →
- Mortgage (P&I)
- −$471
- Tax from tax record
- −$84 /mo · $1,006/yr
- Insurance
- −$37
- HOA
- −$0
- Vacancy / Maint / Mgmt
- −$240
- Net cashflow
- $312
Break-even live
UW: 25.0% down · 7.5% · 30yr · 1.5% tax · 5.0% vac · 8.0% maint · 8.0% mgmt
Financing live
Cash to close
- Down payment
- $22,475
- Closing costs
- $2,697
- Reserves months
- —
- Total cash needed
- —
Loan-product check · same deal, 3 products live
Conventional
25% down · 7.5% · 30yr
- Down + closing
- —
- Monthly P&I
- —
- Monthly cashflow
- —
- DSCR
- —
- Eligible?
- —
Personal DTI + credit; lowest rate.
DSCR
20% down · 8.5% · 30yr
- Down + closing
- —
- Monthly P&I
- —
- Monthly cashflow
- —
- DSCR
- —
- Eligible?
- —
No personal income docs; deal must DSCR.
Hard money
10% down · 12.0% · 12mo
- Down + closing
- —
- Monthly P&I
- —
- Monthly cashflow
- —
- DSCR
- —
- Eligible?
- —
Short-term bridge; refi at stabilization.
Rent comps 6 comps
| Address | Beds | Baths | Sqft | Rent | $/sqft | DOM | Units | Dist |
|---|---|---|---|---|---|---|---|---|
| 5 Circle St Unit 5 Niles, OH | 2.0 | 1.0 | 1200 | $850 | $0.71 | 13d | 1 | 0.70mi |
| 35 Neil St #1 Niles, OH | 2.0 | 1.0 | 1264 | $950 | $0.75 | 13d | 1 | 1.03mi |
| 1916 Youll St Niles, OH | 1.0–3.0 | 1.0–1.5 | 1216 | $1,130 | $0.93 | 13d | 1 | 1.10mi |
| 701 Summit Ave Niles, OH | 2.0 | 1.0–2.0 | 963 | $1,220 | $1.27 | 13d | 1 | 1.14mi |
| 2122 Robbins Ave Niles, OH | 2.0 | 1.0 | 593 | $905 | $1.52 | 13d | 1 | 1.26mi |
| 925 Youngstown Warren Rd Niles, OH | 2.0 | 1.0–2.0 | 997 | $1,245 | $1.25 | 13d | 1 | 1.33mi |
Listing history 19 events
-
2026-06-19days on market $89,900 Active 38 DOM
-
2026-06-18days on market $89,900 Active 37 DOM
-
2026-06-17days on market $89,900 Active 36 DOM
-
2026-06-16days on market $89,900 Active 35 DOM
-
2026-06-15days on market $89,900 Active 34 DOM
-
2026-06-14days on market $89,900 Active 32 DOM
-
2026-06-13days on market $89,900 Active 31 DOM
-
2026-06-10days on market $89,900 Active 29 DOM
-
2026-06-09days on market $89,900 Active 28 DOM
-
2026-06-08days on market $89,900 Active 27 DOM
-
2026-06-07pricedays on market $89,900 Active 26 DOM
-
2026-06-03days on market $99,900 Active 22 DOM
-
2026-06-02days on market $99,900 Active 21 DOM
-
2026-06-01days on market $99,900 Active 20 DOM
-
2026-05-31days on market $99,900 Active 19 DOM
-
2026-05-30days on market $99,900 Active 18 DOM
-
2026-05-15status Active 272-char remark
-
2026-05-01status Pending 272-char remark
-
2026-04-27$99,900 Active 272-char remark
ⓘ Source: listings_history table (triggers on properties + properties_extension) + one-shot
backfill from property_details.listing_events for pre-trigger history.
Tax reassessment forecast OH · Partial reset (capped growth)
- Current annual tax
- $1,006 · $84/mo
- Projected year-2 tax
- $1,204 · $100/mo
- Expected delta
- +$198/yr (+$17/mo · 19.7%)
ⓘ Screening estimate from a state-policy table — verify with the county assessor before closing.
Climate risk First Street
- Flood 1/10 Low FEMA zone X (unshaded) · 0% chance over 30 yrs
- Wildfire 1/10 Low
- Heat 3/10 Moderate 7 d/yr ≥97°F today · 17 d/yr by 30 yrs out
- Wind 1/10 Low
- Air quality 3/10 Moderate 1 unhealthy d/yr today · 4 by 30 yrs out
Nearby sold comps map
Loading sold comps map…
Walkable amenities ~0.75 mi
Loading nearby amenities…
Taxation est. · year 1
- Rental income
- $13,735
- − Mortgage interest
- −$5,036
- − Property taxes
- −$1,006
- − Insurance
- −$450
- − Repairs & maintenance
- −$1,099
- − Management
- −$1,099
- − Depreciation
- −$2,615
- Taxable income
- $2,431
- Est. tax owed @ 24.0%
- −$584
- After-tax cash flow
- $3,155/yr
For passive investors: Depreciation is non-cash, so a rental often shows a tax loss while cash-flowing — sheltering income. Rental losses are passive: they offset passive income freely, and up to $25,000/yr can offset ordinary (W-2) income if you actively participate and your MAGI is under $100k (phasing out to $0 by $150k); unused losses carry forward. On sale, claimed depreciation is recaptured at up to 25%, and gains may owe capital-gains tax (a 1031 exchange can defer both). Figures are a year-1 estimate at your 24.0% rate — not tax advice; consult a CPA.
Schools (NCES district)
- District
- Niles City
- NCES district ID
- 3904449
- Math proficiency
- 37% ▼ -22.00%
- Reading proficiency
- 52% ▼ -11.00%
- Median HH income
- $37,965
- Composite
- 37.02/100
- National rank
- #4517
- State rank
- #507 of 656 in OH
Livability — Niles
- Score
- 67/100
- State rank
- #628
- US rank
- #11037
Category grades
Schools grade is shown separately in the Schools card above.
Census & demographics
- Census place
- Niles, OH
- County
- Trumbull County · 61,158 people
- City population
- 20,060
- Metro
- Youngstown-Warren-Boardman, OH-PA
- Population (ZIP)
- 20,060
- Household income
- $50,468
- Rent vs Own
- Severe rent burden
- 820.0
Population outlook (Trumbull County) Hauer SSP2
- Today (2025)
- 191,696 people
- By 2030
- 184,015 · -4.0%
- By 2040
- 166,810 · -13.0%
- By 2050
- 149,857 · -21.8%
- By 2075
- 115,769 · -39.6%
- By 2100
- 83,617 · -56.4%
Race, ethnicity, and origin ACS 2023
- Neighborhood character
- Predominantly White (88%)
- Race & ethnicity
- White 88% Two or more races 6% Black 4% Hispanic / Latino 3%
- Common ancestry
- Romanian 2% Slovak 1% Subsaharan African 1%
- Foreign-born
- 1%
- Languages at home
- 98% English-only · Spanish 1%
Political lean MEDSL · Trumbull
- 2024 margin
- R (+16.8) · D 41.2% · R 58.0%
- 2008→2024 swing
- -39.2pp toward R · 2008: 22.4pp · 2024: -16.8pp
- All cycles
- 2024: R+16.8 2020: R+10.6 2016: R+6.4 2012: D+22.2 2008: D+22.4
Not yet ingested
- Civics
- —
Market trends
- HPI YoY
- ▼ -49.52%
- Current HPI
- 198.7738
- Rent YoY
- —
- Metro
- Youngstown-Warren-Boardman, OH-PA
- State GDP YoY
- ▲ 1.98%
- F500 in state
- 48
Industry mix (Fortune 500 HQ in OH)
| Industry | F500 HQs | Revenue |
|---|---|---|
| Insurance | 3 | $145B |
|
||
| Industrial Machinery | 3 | $49B |
|
||
| Financial Services | 3 | $24B |
|
||
| Consumer Goods | 2 | $93B |
|
||
| Aerospace / Defense | 2 | $47B |
|
||
| Utilities | 2 | $33B |
|
||
Price history
-10.0% since first listed4 events — show timeline
- 2026-06-05 Price Changed $89,900 MLSNOW
- 2026-05-15 Relisted — MLSNOW
- 2026-05-01 Pending — MLSNOW
- 2026-04-27 Listed $99,900 MLSNOW
Property tax history
+10.8%/yrLatest (2025): $1,006 · +0.9% YoY. Source: county tax records.
Cash-flow waterfall
monthlySold comps — $/sqft
last 12 mo · ≤1 miLoading sold comps…