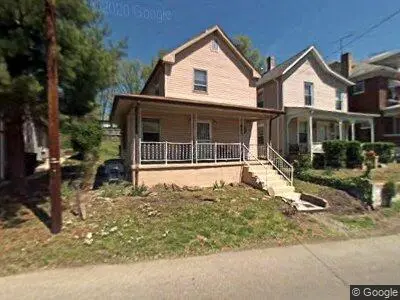
607 Moorman Ave NW · Roanoke, VA
Flood risk 9/10 · Severe
- FEMA flood zone
- X (unshaded)
- Chance of flooding over 30 yrs
- 0.99%
- Est. flood insurance / yr
- $507 – $1,088
Fire risk 1/10 · Minimal
- Est. fire insurance / yr
- $666 – $1,236
Heat risk 5/10 · Moderate
- Hot days now (above 101°F)
- 7 days/yr
- Hot days in 30 yrs
- 18 days/yr
Wind risk 2/10 · Minimal
- Chance of severe wind over 30 yrs
- 1.0%
Air-quality risk 2/10 · Minimal
- Unhealthy air days now
- 1 days/yr
- Unhealthy air days in 30 yrs
- 1 days/yr
Risk factors via First Street. Map © Google.
Why this score? — see what drove the C+ grade
The composite is a weighted blend of 9 inputs, each scored 0–100. Each bar is that input's sub-score; the figure is the points it added to the 100-point composite (weight × sub-score).
- Cash flow +30.0/30.0
- DSCR +10.0/10.0
- 1% rule +8.5/10.0
- Schools +4.1/10.0
- Livability +3.7/5.0
- Rent growth +2.7/5.0
- Condition / age +2.5/5.0
- ARV discount +0.0/15.0
- Appreciation +0.0/10.0
$105,000
🖨 Deal sheet 📄 Offer letter ✓ Due diligence
Listing remarks
Spacious 3-bedroom, 2 bath home with great potential for investors, renovators, or home buyers looking to add value and make it their own.
Key facts
- Built 1884
- Listed 29 days
Neighborhood map
What this means for you Summary
Snapshot
- This is a 3-bed/2.0-bath single-family listed at $105k.
Deal economics
- At list price, monthly cash flow is $368 ($4k/yr) — positive.
- The deal already cash-flows at list — no discount required.
- Meets the 1% rule at list price ($1k rent vs $105k).
- Recommended offer: $103k (1.5% below list) — sets the bar for market timing.
- Cap rate 11.3% vs local median 4.2% in Roanoke — top-decile yield for the area; either an underpriced asset or a hidden risk that comps aren't pricing in. Stress-test before assuming the spread holds.
Location & tenants
- Location reads 73/100 on livability (#163 in VA) — a middle-class / working-renter tenant base. Strengths: cost of living A+, health & safety A+, housing A; Watch: amenities C-, employment D, crime F.
- Roanoke City Public School District (urban): math 40% / reading 58% proficiency, ranked #102 of 131 in VA (top 78%) — families likely to look elsewhere, expect single-tenant / working-renter base with shorter leases; 67% free/reduced lunch — lower-income household profile, screen leases tightly.
- Market conditions: Rents flat; 89 active listings in the ZIP; 20 comparable units currently listed for rent nearby; rentals lingering (median 44d on market — plan ~5-8 weeks vacancy on turnover, expect pricing pressure); 55% of comp listings sitting > 30 days — soft ceiling on asking rent; 113 units permitted in Roanoke city in 2024 (0 in 5+ unit buildings).
- This rent runs 36% of the median local income ($47k/yr) — at the standard rent-burdened threshold; future hikes will face affordability resistance.
Forward outlook
- Local home prices are declining (-3.0%/yr); year-one equity from $726 of loan paydown is wiped out by about $3k of value loss. Plan a longer hold.
- Roanoke County population projected at +11% by 2050 — modest demand growth; plan on rents tracking national, not racing it.
Negotiation context
- It's been on market 29 days — a 2% lower offer ($103k) is reasonable based on typical stale-listing flexibility.
Risks & watch-outs
- Watch-outs: flood insurance adds $66/mo; built in 1884 — expect roof / HVAC / electrical / plumbing capex.
- Climate carrying-cost: severe flood risk; extreme-heat days projected 7→18/yr by 2055 (HVAC capex compounding) — expect insurance premiums to compound above CPI over the hold.
Questions for the listing agent
- Built in 1884 — when were the roof, HVAC, electrical panel, plumbing, and water heater last replaced?
- What's the actual annual flood-insurance premium (NFIP or private), and is the property in a SFHA with mandatory coverage?
- Is there a deadline driving the sale (1031 exchange, divorce, estate, relocation)? That informs how much negotiation room exists.
- Schools are A-rated — typically a magnet for longer-tenancy family renters. What's the average tenant stay here, and is there a school-zone premium baked into asking?
- Crime grade is F in this area — have there been break-ins, vandalism, or insurance claims at this property in the last 3 years? What carrier currently insures it and at what premium?
- What's the average days-on-market for RENTAL listings here right now (not sales)? A rising rental-DOM trend means longer vacancies and softer asking-rent achievability than the comps imply.
- What's the recent tenant-quality profile in this submarket — average credit score on applications, eviction rate, late-payment / NSF rate, and stable-employment percentage? A property-management company in the area should have these aggregated.
- How much new for-sale + rental construction is in the pipeline within 1–3 miles? Heavy new supply typically softens prices + rents 12–24 months out; constrained supply supports both.
Investment metrics
- 1% rule
- 1.35% ✓
- Cap rate
- 11.26%
- Cash-on-cash
- 17.75%
- DSCR
- 1.79
- GRM
- 6.2
CMA / ARV
- ARV (on-the-fly)
- $86,526
- Comps found
- 12
Show comp detail 12 sales within ~0.75 mi
| Address | Dist | Beds/Ba | Sqft | Sold | Price | $/sf | Match |
|---|---|---|---|---|---|---|---|
| 515 Patton Ave NW | 0.07mi | 3/1.0 | 1,602 (+6%) | 5mo | $68,500 | $43 | 79 |
| 711 Harrison Ave NW | 0.15mi | 2/1.0 (-1) | 1,557 (+3%) | 4mo | $67,500 | $43 | 76 |
| 127 Patton Ave NW | 0.39mi | 3/2.0 | 1,550 (+2%) | 8mo | $68,000 | $44 | 72 |
| 711 Mcdowell Ave NW | 0.34mi | 4/2.0 (+1) | 1,600 (+5%) | 1mo | $121,000 | $76 | 69 |
| 1115 Orange Ave NW | 0.55mi | 3/1.5 | 1,487 (-2%) | 6mo | $100,835 | $68 | 64 |
| 821 12th St NW | 0.59mi | 3/1.0 | 1,508 (-1%) | 9mo | $85,500 | $57 | 60 |
| 1211 Hanover Ave NW | 0.64mi | 3/2.0 | 1,461 (-4%) | 8mo | $67,000 | $46 | 57 |
| 428 Marshall Ave SW | 0.64mi | 4/1.5 (+1) | 1,504 (-1%) | 9mo | $220,000 | $146 | 54 |
| 915 Loudon Ave NW | 0.29mi | 2/1.0 (-1) | 1,293 (-15%) | 4mo | $190,000 | $147 | 49 |
| 1403 Burrell St NW | 0.63mi | 2/1.0 (-1) | 1,434 (-6%) | 6mo | $54,600 | $38 | 48 |
| 1230 Orange Ave NW | 0.63mi | 4/2.0 (+1) | 1,736 (+14%) | 2mo | $110,000 | $63 | 40 |
| 1025 Mercer Ave NW | 0.64mi | 3/1.0 | 1,296 (-15%) | 6mo | $50,000 | $39 | 37 |
Match score weights: distance 35% · size 25% · config 20% · recency 20%. Top-matched comps best support the ARV.
Projected returns pro-forma
-3.0% appreciation · 0.72% rent growth · sell at horizon
- IRR
- 3.0%
- Equity multiple
- 1.11×
- Total profit
- $3,315
- Equity at exit
- $15,656
- IRR
- 10.2%
- Equity multiple
- 1.71×
- Total profit
- $20,811
- Equity at exit
- $9,078
Cash invested: $29,400 (down + closing). Projections, not guarantees.
Landlord ↔ Tenant lean methodology
- Overall (STATE)
- 55 Moderately Landlord-Leaning
- State Virginia
- 55 Moderately Landlord-Leaning · D+2
- County
- — inherits STATE
- City
- — inherits STATE
ZIP-level market 24016
- Home prices YoY
- -27.6%
- Rents YoY
- 0.7%
- Active inventory
- 89
- Price-to-rent
- 6.2×
Monthly cashflow live
- Estimated rent
- $1,415 high interval (Pro) →
- Mortgage (P&I)
- −$551
- Tax from tax record
- −$88 /mo · $1,059/yr
- Insurance
- −$44
- Flood insurance flood zone
- −$66 /mo · $798/yr
- HOA
- −$0
- Vacancy / Maint / Mgmt
- −$297
- Net cashflow
- $368
Break-even live
UW: 25.0% down · 7.5% · 30yr · 1.5% tax · 5.0% vac · 8.0% maint · 8.0% mgmt
Financing live
Cash to close
- Down payment
- $26,250
- Closing costs
- $3,150
- Reserves months
- —
- Total cash needed
- —
Loan-product check · same deal, 3 products live
Conventional
25% down · 7.5% · 30yr
- Down + closing
- —
- Monthly P&I
- —
- Monthly cashflow
- —
- DSCR
- —
- Eligible?
- —
Personal DTI + credit; lowest rate.
DSCR
20% down · 8.5% · 30yr
- Down + closing
- —
- Monthly P&I
- —
- Monthly cashflow
- —
- DSCR
- —
- Eligible?
- —
No personal income docs; deal must DSCR.
Hard money
10% down · 12.0% · 12mo
- Down + closing
- —
- Monthly P&I
- —
- Monthly cashflow
- —
- DSCR
- —
- Eligible?
- —
Short-term bridge; refi at stabilization.
Rent comps 20 comps
| Address | Beds | Baths | Sqft | Rent | $/sqft | DOM | Units | Dist |
|---|---|---|---|---|---|---|---|---|
| 813 Gilmer Ave NW Roanoke, VA | 2.0 | 1.0 | 1050 | $1,322 | $1.26 | 21d | 1 | 0.17mi |
| 333 Harrison Ave NW Roanoke, VA | 3.0 | 2.0 | 1186 | $1,123 | $0.95 | 21d | 1 | 0.23mi |
| 401 Rutherford Ave NW Roanoke, VA | 3.0 | 1.0 | 1064 | $1,450 | $1.36 | 43d | 1 | 0.26mi |
| 1007 Gilmer Ave NW Roanoke, VA | 2.0 | 2.0 | 1187 | $1,175 | $0.99 | 21d | 1 | 0.33mi |
| 216 Patton Ave NW Unit 2 Roanoke, VA | 2.0 | 1.0 | 1240 | $1,025 | $0.83 | 21d | 1 | 0.34mi |
| 701 Salem Ave SW Roanoke, VA | 2.0 | 1.0 | 1250 | $1,950 | $1.56 | 43d | 1 | 0.41mi |
| 821 12th St NW Roanoke, VA | 3.0 | 2.0 | 1508 | $1,625 | $1.08 | 43d | 1 | 0.58mi |
| 430 Day Ave SW Unit A Roanoke, VA | 2.0 | 1.0 | 1444 | $1,650 | $1.14 | 43d | 1 | 0.70mi |
| 1515 Dunbar St NW Roanoke, VA | 3.0 | 2.0 | 1058 | $1,623 | $1.53 | 13d | 1 | 0.76mi |
| 1115 Grayson Ave NW Roanoke, VA | 4.0 | 2.0 | 1094 | $2,300 | $2.10 | 43d | 1 | 0.76mi |
| 602 Elm Ave Unit B Roanoke, VA | 2.0 | 1.0 | 1804 | $1,250 | $0.69 | 43d | 1 | 0.77mi |
| 1017 Ferdinand Ave SW Roanoke, VA | 4.0 | 2.5 | 2248 | $1,795 | $0.80 | 43d | 1 | 0.78mi |
| 1533 Rugby Blvd NW Roanoke, VA | 3.0 | 1.0 | 1500 | $1,475 | $0.98 | 43d | 1 | 1.07mi |
| 1609 Chapman Ave SW Unit B Roanoke, VA | 4.0 | 1.0 | 1400 | $1,545 | $1.10 | 21d | 1 | 1.09mi |
| 1531 Syracuse Ave NW Roanoke, VA | 3.0 | 1.0 | 1488 | $1,675 | $1.13 | 43d | 1 | 1.10mi |
| 1630 Patterson Ave SW Unit B Roanoke, VA | 3.0 | 1.0 | 1200 | $1,395 | $1.16 | 43d | 1 | 1.11mi |
| 2109 Colgate St NE Roanoke, VA | 3.0 | 1.0 | 1240 | $1,700 | $1.37 | 13d | 1 | 1.43mi |
| 730 Murray Ave SE Roanoke, VA | 3.0 | 1.0 | 1163 | $1,525 | $1.31 | 21d | 1 | 1.47mi |
| 730 Murray Ave SE Roanoke, VA | 3.0 | 1.0 | 1163 | $1,525 | $1.31 | 43d | 1 | 1.47mi |
| 743 Suburban Ave SW Unit Suburban 745 Roanoke, VA | 2.0 | 1.0 | 1134 | $1,100 | $0.97 | 13d | 1 | 1.47mi |
Listing history 16 events
-
2026-06-18days on market $105,000 Active 29 DOM
-
2026-06-17days on market $105,000 Active 28 DOM
-
2026-06-16days on market $105,000 Active 27 DOM
-
2026-06-15days on market $105,000 Active 26 DOM
-
2026-06-14days on market $105,000 Active 24 DOM
-
2026-06-13days on market $105,000 Active 23 DOM
-
2026-06-10days on market $105,000 Active 21 DOM
-
2026-06-09days on market $105,000 Active 20 DOM
-
2026-06-08days on market $105,000 Active 19 DOM
-
2026-06-05days on market $105,000 Active 15 DOM
-
2026-06-03days on market $105,000 Active 14 DOM
-
2026-06-02days on market $105,000 Active 13 DOM
-
2026-06-01days on market $105,000 Active 12 DOM
-
2026-05-31days on market $105,000 Active 11 DOM
-
2026-05-30days on market $105,000 Active 10 DOM
-
2026-05-21$105,000 Active
ⓘ Source: listings_history table (triggers on properties + properties_extension) + one-shot
backfill from property_details.listing_events for pre-trigger history.
Tax reassessment forecast VA · Resets to sale price
- Current annual tax
- $1,059 · $88/mo
- Projected year-2 tax
- $1,059 · $88/mo
- Expected delta
- $0/yr ($0/mo · 0.0%)
ⓘ Screening estimate from a state-policy table — verify with the county assessor before closing.
Climate risk First Street
- Flood 9/10 Extreme FEMA zone X (unshaded) · 99% chance over 30 yrs
- Wildfire 1/10 Low
- Heat 5/10 Major 7 d/yr ≥101°F today · 18 d/yr by 30 yrs out
- Wind 2/10 Low 100% chance of damaging wind over 30 yrs
- Air quality 2/10 Low 1 unhealthy d/yr today · 1 by 30 yrs out
Nearby sold comps map
Loading sold comps map…
Walkable amenities ~0.75 mi
Loading nearby amenities…
Taxation est. · year 1
- Rental income
- $16,975
- − Mortgage interest
- −$5,882
- − Property taxes
- −$1,059
- − Insurance
- −$1,322
- − Repairs & maintenance
- −$1,358
- − Management
- −$1,358
- − Depreciation
- −$3,055
- Taxable income
- $2,942
- Est. tax owed @ 24.0%
- −$706
- After-tax cash flow
- $3,715/yr
For passive investors: Depreciation is non-cash, so a rental often shows a tax loss while cash-flowing — sheltering income. Rental losses are passive: they offset passive income freely, and up to $25,000/yr can offset ordinary (W-2) income if you actively participate and your MAGI is under $100k (phasing out to $0 by $150k); unused losses carry forward. On sale, claimed depreciation is recaptured at up to 25%, and gains may owe capital-gains tax (a 1031 exchange can defer both). Figures are a year-1 estimate at your 24.0% rate — not tax advice; consult a CPA.
Schools (NCES district)
- District
- Roanoke City Public School District
- NCES district ID
- 5103300
- Math proficiency
- 40% ▼ -38.00%
- Reading proficiency
- 58% ▼ -12.00%
- Median HH income
- $38,592
- Composite
- 40.8/100
- National rank
- #3639
- State rank
- #102 of 131 in VA
Livability — Roanoke
- Score
- 73/100
- State rank
- #163
- US rank
- #5055
Category grades
Schools grade is shown separately in the Schools card above.
Census & demographics
- Census place
- Roanoke, VA
- County
- Roanoke City · 101,625 people
- City population
- 168,930
- Metro
- Roanoke, VA
- Population (ZIP)
- 10,521
- Household income
- $46,512
- Rent vs Own
- Severe rent burden
- 728.0
Population outlook (Roanoke County) Hauer SSP2
- Today (2025)
- 106,094 people
- By 2030
- 108,927 · +2.7%
- By 2040
- 114,104 · +7.5%
- By 2050
- 118,032 · +11.3%
- By 2075
- 123,363 · +16.3%
- By 2100
- 116,827 · +10.1%
Race, ethnicity, and origin ACS 2023
- Neighborhood character
- Diverse neighborhood (Simpson 0.58)
- Race & ethnicity
- Black 48% White 42% Two or more races 5% Hispanic / Latino 4% Asian 2%
- Common ancestry
- Italian 2% Serbian 1% Lithuanian 1%
- Foreign-born
- 5% · Canada, South Korea
- Languages at home
- 95% English-only · Spanish 2% French/Haitian/Cajun 1% Other Indo-European 1%
Political lean MEDSL · Roanoke
- 2024 margin
- Strong D (+23.6) · D 61.1% · R 37.5% · Other 1.4%
- 2008→2024 swing
- +0.2pp no change · 2008: 23.4pp · 2024: 23.6pp
- All cycles
- 2024: D+23.6 2020: D+25.8 2016: D+17.6 2012: D+21.5 2008: D+23.4
Not yet ingested
- Civics
- —
Market trends
- HPI YoY
- ▼ -98.06%
- Current HPI
- 257.8158
- Rent YoY
- ▲ 0.72%
- Metro
- Roanoke, VA
- State GDP YoY
- ▲ 2.40%
- F500 in state
- 50
Industry mix (Fortune 500 HQ in VA)
| Industry | F500 HQs | Revenue |
|---|---|---|
| Aerospace / Defense | 4 | $236B |
|
||
| Technology / Defense | 3 | $32B |
|
||
| Financial Services | 2 | $176B |
|
||
| Utilities | 2 | $27B |
|
||
| Insurance | 2 | $25B |
|
||
| Technology | 2 | $15B |
|
||
Price history
1 event — show timeline
- 2026-05-21 Listed $105,000 FSBO.com
Property tax history
+6.2%/yrLatest (2025): $1,059 · +18.3% YoY. Source: county tax records.
Cash-flow waterfall
monthlySold comps — $/sqft
last 12 mo · ≤1 miLoading sold comps…