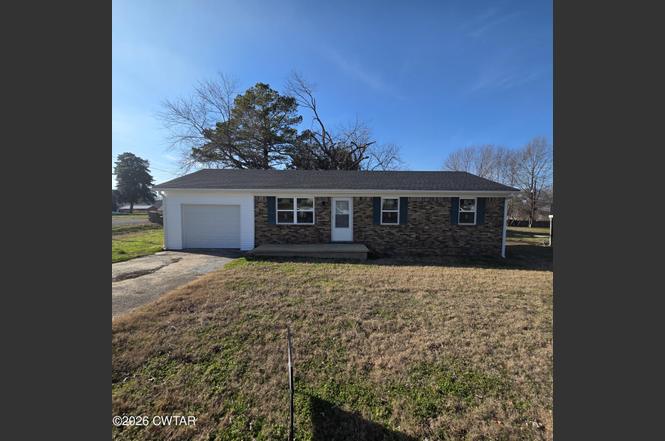
201 Cross St · Rutherford, TN
Flood risk 1/10 · Minimal
- FEMA flood zone
- X (unshaded)
- Chance of flooding over 30 yrs
- 0.0%
- Est. flood insurance / yr
- $507 – $1,088
Fire risk 1/10 · Minimal
- Est. fire insurance / yr
- $949 – $1,763
Heat risk 6/10 · Moderate
- Hot days now (above 108°F)
- 7 days/yr
- Hot days in 30 yrs
- 21 days/yr
Wind risk 4/10 · Minor
- Chance of severe wind over 30 yrs
- 9.0%
Air-quality risk 1/10 · Minimal
- Unhealthy air days now
- 0 days/yr
- Unhealthy air days in 30 yrs
- 0 days/yr
Risk factors via First Street. Map © Google.
Why this score? — see what drove the D+ grade
The composite is a weighted blend of 9 inputs, each scored 0–100. Each bar is that input's sub-score; the figure is the points it added to the 100-point composite (weight × sub-score).
- Cash flow +15.8/30.0
- ARV discount +7.5/15.0
- DSCR +4.9/10.0
- Appreciation +4.7/10.0
- Schools +3.7/10.0
- Livability +3.1/5.0
- 1% rule +3.0/10.0
- Rent growth +2.5/5.0
- Condition / age +2.5/5.0
$126,900
🖨 Deal sheet 📄 Offer letter ✓ Due diligence
Listing remarks MLS
Active rental unit. Good tennant. Unit could use some upgrades. Could be brought to FHA standards for an investor or just left as is for rental.
Key facts
- Hardwood throughout
- New storm doors
- Newly painted
Tags
Property features AI
Exterior
- Parking: Attached garage with garage facing front (1 garage space); One open parking space (total 2 parking spaces)
- Utilities: Public water; Public sewer; 100 amp electric service; Electricity and sewer connected; natural gas and phone available; water available
- Home design: Single-family residence; One-story (single level) home; Residential property
- Construction: Aluminum siding, brick, and vinyl siding exterior; Block raised foundation; Built with a shingle roof (not explicitly listed; roof type not provided)
- Exterior features: Front porch; Asphalt road frontage on a public maintained city street; Lot approximately 0.27 acres (dimensions ~80 x 146 irregular)
Interior
- Kitchen: Electric range; Refrigerator
- Bedrooms: Three main-level bedrooms
- Flooring: Hardwood floors; Vinyl flooring
- Bathrooms: One full bathroom on the main level
- Heating & cooling: Central heating; Central air conditioning
- Interior features: Double-pane windows; Range hood
- Laundry & utility: Laundry room with washer and electric dryer hookups; Electric water heater
Neighborhood map
What this means for you Summary
Snapshot
- This is a 3-bed/1.0-bath single-family listed at $127k.
Deal economics
- At list price, monthly cash flow is $57 ($683/yr) — positive.
- The deal already cash-flows at list — no discount required.
- To meet the 1% rule (rent ≥ 1% of price), the offer needs to be $102k (19.7% below list).
- Recommended offer: $102k (19.7% below list) — sets the bar for 1% rule.
Location & tenants
- Location reads 62/100 on livability (#235 in TN) — a middle-class / working-renter tenant base. Strengths: cost of living A+, housing A-; Watch: health & safety C-, schools D-, amenities F.
- Gibson County Sp District (rural): math 47% / reading 39% proficiency, ranked #11 of 139 in TN (top 8%) — families likely to look elsewhere, expect single-tenant / working-renter base with shorter leases.
- Market conditions: 22 active listings in the ZIP; 155 units permitted in Gibson County in 2024 (0 in 5+ unit buildings).
Forward outlook
- In year one you build about $213 of equity ($877 loan paydown + $-664 appreciation (-0.5% local appreciation)).
- Gibson County population projected to shrink 8% by 2050 — rents likely to lag national; underwrite the cash flow, not the appreciation.
Negotiation context
- It's been on market 168 days — a 12% lower offer ($112k) is reasonable based on typical stale-listing flexibility.
- 2 sale attempts; this cycle's ask has dropped $18k (12%) from the opening price — seller is motivated, your offer sets the floor, not the list.
- Current owner paid $60k; list at $127k implies a 112% gain — meaningful room to come down on a strong offer.
Risks & watch-outs
- Climate carrying-cost: extreme-heat days projected 7→21/yr by 2055 (HVAC capex compounding) — expect insurance premiums to compound above CPI over the hold.
Questions for the listing agent
- It's been on market 168 days. Have you received any prior offers? Is the seller open to a 20% concession, seller financing, or rate buy-down credit?
- Built in 1973 — when were the roof, HVAC, electrical panel, plumbing, and water heater last replaced?
- Why hasn't it sold? Are there any deal-killer items the seller is aware of (foundation, flood, title, zoning, code violations)?
- Is there a deadline driving the sale (1031 exchange, divorce, estate, relocation)? That informs how much negotiation room exists.
- Schools are D-rated, which usually means shorter tenancies and higher turnover. Who's the typical renter profile here, and what's been the actual vacancy rate?
- The area grade is low — what's the realistic commute time and amenity access for the typical tenant pool here? Any planned neighborhood developments (good or bad) we should know about?
- What's the average days-on-market for RENTAL listings here right now (not sales)? A rising rental-DOM trend means longer vacancies and softer asking-rent achievability than the comps imply.
- What's the recent tenant-quality profile in this submarket — average credit score on applications, eviction rate, late-payment / NSF rate, and stable-employment percentage? A property-management company in the area should have these aggregated.
- How much new for-sale + rental construction is in the pipeline within 1–3 miles? Heavy new supply typically softens prices + rents 12–24 months out; constrained supply supports both.
Investment metrics
- 1% rule
- 0.80% ✗
- Cap rate
- 6.83%
- Cash-on-cash
- 1.92%
- DSCR
- 1.09
- GRM
- 10.4
CMA / ARV
No comps found within radius.
Projected returns pro-forma
-0.52% appreciation · 3.0% rent growth · sell at horizon
- IRR
- -2.0%
- Equity multiple
- 0.91×
- Total profit
- $-3,240
- Equity at exit
- $33,561
- IRR
- 4.1%
- Equity multiple
- 1.42×
- Total profit
- $14,827
- Equity at exit
- $37,804
Cash invested: $35,532 (down + closing). Projections, not guarantees.
Landlord ↔ Tenant lean methodology
- Overall (STATE)
- 87 Strongly Landlord-Friendly
- State Tennessee
- 87 Strongly Landlord-Friendly · R+13
- County
- — inherits STATE
- City
- — inherits STATE
ZIP-level market 38369
- Home prices YoY
- -0.2%
- Active inventory
- 22
- Price-to-rent
- 10.4×
Monthly cashflow live
- Estimated rent
- $1,019 medium interval (Pro) →
- Mortgage (P&I)
- −$665
- Tax from tax record
- −$30 /mo · $355/yr
- Insurance
- −$53
- HOA
- −$0
- Vacancy / Maint / Mgmt
- −$214
- Net cashflow
- $57
Break-even live
UW: 25.0% down · 7.5% · 30yr · 1.5% tax · 5.0% vac · 8.0% maint · 8.0% mgmt
Financing live
Cash to close
- Down payment
- $31,725
- Closing costs
- $3,807
- Reserves months
- —
- Total cash needed
- —
Loan-product check · same deal, 3 products live
Conventional
25% down · 7.5% · 30yr
- Down + closing
- —
- Monthly P&I
- —
- Monthly cashflow
- —
- DSCR
- —
- Eligible?
- —
Personal DTI + credit; lowest rate.
DSCR
20% down · 8.5% · 30yr
- Down + closing
- —
- Monthly P&I
- —
- Monthly cashflow
- —
- DSCR
- —
- Eligible?
- —
No personal income docs; deal must DSCR.
Hard money
10% down · 12.0% · 12mo
- Down + closing
- —
- Monthly P&I
- —
- Monthly cashflow
- —
- DSCR
- —
- Eligible?
- —
Short-term bridge; refi at stabilization.
Listing history 12 events
-
2026-05-20status Pending
-
2026-05-06price $126,900
-
2026-04-29price $129,900
-
2026-04-07price $134,900
-
2026-03-10price $139,900
-
2025-12-02$145,000 Active
-
2025-07-31soldstatus $60,000 Closed 144-char remark
Show marketing remark (144 chars)
Active rental unit. Good tennant. Unit could use some upgrades. Could be brought to FHA standards for an investor or just left as is for rental.
-
2025-07-31soldstatus $60,000
Show marketing remark (144 chars)
Active rental unit. Good tennant. Unit could use some upgrades. Could be brought to FHA standards for an investor or just left as is for rental.
-
2025-07-16status Pending 144-char remark
Show marketing remark (144 chars)
Active rental unit. Good tennant. Unit could use some upgrades. Could be brought to FHA standards for an investor or just left as is for rental.
-
2025-06-16price $80,000 144-char remark
Show marketing remark (144 chars)
Active rental unit. Good tennant. Unit could use some upgrades. Could be brought to FHA standards for an investor or just left as is for rental.
-
2025-05-13price $85,000 144-char remark
Show marketing remark (144 chars)
Active rental unit. Good tennant. Unit could use some upgrades. Could be brought to FHA standards for an investor or just left as is for rental.
-
2025-03-26$90,000 Active 144-char remark
Show marketing remark (144 chars)
Active rental unit. Good tennant. Unit could use some upgrades. Could be brought to FHA standards for an investor or just left as is for rental.
ⓘ Source: listings_history table (triggers on properties + properties_extension) + one-shot
backfill from property_details.listing_events for pre-trigger history.
Tax reassessment forecast TN · Resets to sale price
- Current annual tax
- $355 · $30/mo
- Projected year-2 tax
- $901 · $75/mo
- Expected delta
- +$546/yr (+$45/mo · 153.8%)
ⓘ Screening estimate from a state-policy table — verify with the county assessor before closing.
Climate risk First Street
- Flood 1/10 Low FEMA zone X (unshaded) · 0% chance over 30 yrs
- Wildfire 1/10 Low
- Heat 6/10 Major 7 d/yr ≥108°F today · 21 d/yr by 30 yrs out
- Wind 4/10 Moderate 9% chance of damaging wind over 30 yrs
- Air quality 1/10 Low 0 unhealthy d/yr today · 0 by 30 yrs out
Nearby sold comps map
Loading sold comps map…
Walkable amenities ~0.75 mi
Loading nearby amenities…
Taxation est. · year 1
- Rental income
- $12,226
- − Mortgage interest
- −$7,108
- − Property taxes
- −$355
- − Insurance
- −$634
- − Repairs & maintenance
- −$978
- − Management
- −$978
- − Depreciation
- −$3,692
- Taxable loss
- −$1,520
- Est. tax savings @ 24.0%
- +$365
- After-tax cash flow
- $1,048/yr
For passive investors: Depreciation is non-cash, so a rental often shows a tax loss while cash-flowing — sheltering income. Rental losses are passive: they offset passive income freely, and up to $25,000/yr can offset ordinary (W-2) income if you actively participate and your MAGI is under $100k (phasing out to $0 by $150k); unused losses carry forward. On sale, claimed depreciation is recaptured at up to 25%, and gains may owe capital-gains tax (a 1031 exchange can defer both). Figures are a year-1 estimate at your 24.0% rate — not tax advice; consult a CPA.
Schools (NCES district)
- District
- Gibson County Sp District
- NCES district ID
- 4701400
- Math proficiency
- 47% ▼ -13.00%
- Reading proficiency
- 39% ▼ -5.00%
- Median HH income
- $47,868
- Composite
- 36.82/100
- National rank
- #4565
- State rank
- #11 of 139 in TN
Livability — Rutherford
- Score
- 62/100
- State rank
- #235
- US rank
- #17256
Category grades
Schools grade is shown separately in the Schools card above.
Census & demographics
- Census place
- Rutherford, TN
- Population (ZIP)
- 1,636
Population outlook (Gibson County) Hauer SSP2
- Today (2025)
- 48,793 people
- By 2030
- 48,221 · -1.2%
- By 2040
- 46,793 · -4.1%
- By 2050
- 44,909 · -8.0%
- By 2075
- 40,191 · -17.6%
- By 2100
- 33,574 · -31.2%
Race, ethnicity, and origin ACS 2023
- Neighborhood character
- Predominantly White (81%)
- Race & ethnicity
- White 81% Two or more races 10% Black 7% Native American 1% Hispanic / Latino 1%
- Common ancestry
- Lithuanian 2% Slovak 1% Serbian 1%
- Foreign-born
- 1% · Canada
- Languages at home
- 95% English-only · Spanish 3% German/W. Germanic 1%
Political lean MEDSL · Gibson
- 2024 margin
- Solid R (+52.0) · D 23.6% · R 75.5%
- 2008→2024 swing
- -23.2pp toward R · 2008: -28.8pp · 2024: -52.0pp
- All cycles
- 2024: R+52.0 2020: R+47.0 2016: R+43.8 2012: R+32.1 2008: R+28.8
Not yet ingested
- Civics
- —
Market trends
- HPI YoY
- ▼ -0.52%
- Current HPI
- 230.3868
- Rent YoY
- —
- Metro
- —
- State GDP YoY
- ▲ 2.78%
- F500 in state
- 22
Industry mix (Fortune 500 HQ in TN)
| Industry | F500 HQs | Revenue |
|---|---|---|
| Healthcare | 3 | $91B |
|
||
| Retail | 3 | $72B |
|
||
| Transportation / Logistics | 1 | $88B |
|
||
| Paper / Packaging | 1 | $19B |
|
||
| Insurance | 1 | $13B |
|
||
| Energy | 1 | $12B |
|
||
Price history
+41.0% since first listed12 events — show timeline
- 2026-05-20 Pending — CWTAR
- 2026-05-06 Price Changed $126,900 CWTAR
- 2026-04-29 Price Changed $129,900 CWTAR
- 2026-04-07 Price Changed $134,900 CWTAR
- 2026-03-10 Price Changed $139,900 CWTAR
- 2025-12-02 Listed $145,000 CWTAR
- 2025-07-31 Sold (Public Records) $60,000 Public Records
- 2025-07-31 Sold (MLS) $60,000 CWTAR
- 2025-07-16 Pending — CWTAR
- 2025-06-16 Price Changed $80,000 CWTAR
- 2025-05-13 Price Changed $85,000 CWTAR
- 2025-03-26 Listed $90,000 CWTAR
Property tax history
-4.3%/yrLatest (2025): $355 · +0.0% YoY. Source: county tax records.
Cash-flow waterfall
monthlySold comps — $/sqft
last 12 mo · ≤1 miLoading sold comps…