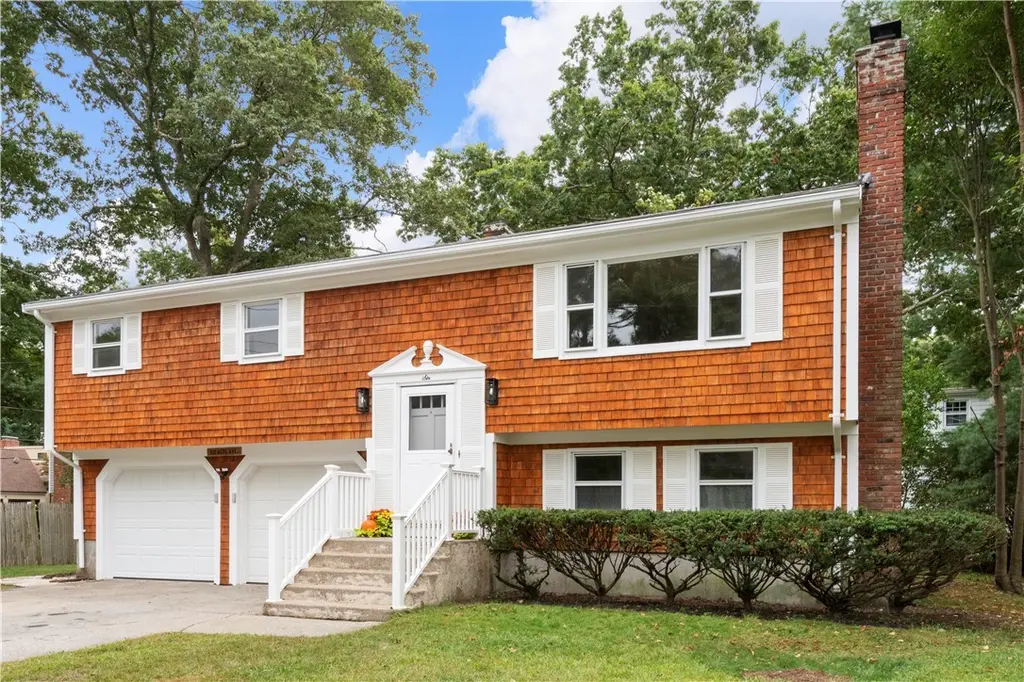
6 Acre Ave · Barrington, RI
Flood risk 1/10 · Minimal
- FEMA flood zone
- X (shaded)
- Chance of flooding over 30 yrs
- 0.0%
- Est. flood insurance / yr
- $473 – $860
Fire risk 1/10 · Minimal
- Est. fire insurance / yr
- $835 – $1,551
Heat risk 5/10 · Moderate
- Hot days now (above 96°F)
- 7 days/yr
- Hot days in 30 yrs
- 15 days/yr
Wind risk 8/10 · Major
- Chance of severe wind over 30 yrs
- 80.0%
Air-quality risk 2/10 · Minimal
- Unhealthy air days now
- 2 days/yr
- Unhealthy air days in 30 yrs
- 2 days/yr
Risk factors via First Street. Map © Google.
Why this score? — see what drove the F grade
The composite is a weighted blend of 9 inputs, each scored 0–100. Each bar is that input's sub-score; the figure is the points it added to the 100-point composite (weight × sub-score).
- ARV discount +15.0/15.0
- Schools +5.8/10.0
- Cash flow +5.4/30.0
- Rent growth +2.5/5.0
- Livability +2.5/5.0
- Condition / age +2.5/5.0
- 1% rule +0.7/10.0
- DSCR +0.0/10.0
- Appreciation +0.0/10.0
$599,000
🖨 Deal sheet 📄 Offer letter ✓ Due diligence
Listing remarks
Refurbished Raised Ranch in great condition and located on a quiet, dead-end street just 0.9 mi. from Hampden Meadows Elementary School and a block from Hundred Acre Cove. Amenities include hardwood floors, recent deck, two fireplaces, 2-car garage plus a gardening shed. Check out this affordable and ready-to-go opportunity located in one of the East Bay's most sought-after communities!
Key facts
- Recent deck
- Gardening shed
- Hardwood floors
Tags
Property features AI
Finance
- HOA & community: Close to highway access, marina, restaurants and shopping, and near schools
Exterior
- Parking: Attached 2-car garage; Total parking for 6 vehicles; Built-in parking with garage door opener; Two covered parking spaces
- Utilities: Public water (connected); Public sewer (connected); Electrical: 100 amps, 220 volts, circuit breakers
- Home design: Two-story home; Concrete perimeter foundation
- Construction: Wood siding and shingle siding; Drywall construction; Built with a concrete perimeter foundation
- Exterior features: Deck; Paved driveway; Outbuilding; Walkable to water
Interior
- Kitchen: Oven; Range; Microwave; Dishwasher; Refrigerator; Tankless water heater; Oil water heater
- Bedrooms: Three bedrooms on the first floor
- Flooring: Hardwood floors; Ceramic tile
- Bathrooms: One full bathroom; One half bathroom
- Heating & cooling: Oil-fired hot water baseboard heat; Zoned heating
- Interior features: Interior steps; Tub with shower; Cable TV; Two masonry fireplaces; Partially finished basement with interior and exterior entry
- Laundry & utility: Washer; Dryer; Utility room; Storage room
Neighborhood map
What this means for you Summary
Snapshot
- This is a 3-bed/1.5-bath single-family listed at $599k.
Deal economics
- At list price, monthly cash flow is $-1k ($-16k/yr) — negative.
- To cash-flow at today's rent, offer at most $370k (38.2% below list).
- To meet the 1% rule (rent ≥ 1% of price), the offer needs to be $340k (43.2% below list).
- Recommended offer: $340k (43.2% below list) — sets the bar for 1% rule.
Location & tenants
- Location reads: area grade F — affects rentability + tenant quality, not the cash-flow math above.
- Barrington (suburban): math 55% / reading 70% proficiency, ranked #1 of 39 in RI (top 3%) — acceptable for families but not a draw, mixed tenant base, ~2y average lease; only 4% free/reduced lunch — higher-income household profile.
- Market conditions: 94 active listings in the ZIP; 1 comparable units currently listed for rent nearby; 29 units permitted in Bristol County in 2024 (0 in 5+ unit buildings).
Forward outlook
- Local home prices are declining (-3.0%/yr); year-one equity from $4k of loan paydown is wiped out by about $18k of value loss. Plan a longer hold.
- Bristol County population projected at -12% by 2050 — secular population decline; favor cash flow + early exit over multi-decade hold.
Negotiation context
- It's been on market 44 days — a 3% lower offer ($581k) is reasonable based on typical stale-listing flexibility.
- 5 sale attempts since 9y ago with the ask held roughly flat each time — persistent listings suggest the price (not the market) is what's stuck; bring a comps-based counter.
- Current owner paid $266k; list at $599k implies a 125% gain — meaningful room to come down on a strong offer.
Risks & watch-outs
- Climate carrying-cost: severe wind risk, 80% chance of damaging wind over 30y; extreme-heat days projected 7→15/yr by 2055 (HVAC capex compounding) — expect insurance premiums to compound above CPI over the hold.
Questions for the listing agent
- What do current leases actually rent for vs. the listed asking? Can we see a recent rent roll and the last 12 months of T-12 income?
- It's been on market 44 days. Have you received any prior offers? Is the seller open to a 43% concession, seller financing, or rate buy-down credit?
- Built in 1972 — when were the roof, HVAC, electrical panel, plumbing, and water heater last replaced?
- Is there a deadline driving the sale (1031 exchange, divorce, estate, relocation)? That informs how much negotiation room exists.
- The area grade is low — what's the realistic commute time and amenity access for the typical tenant pool here? Any planned neighborhood developments (good or bad) we should know about?
- What's the average days-on-market for RENTAL listings here right now (not sales)? A rising rental-DOM trend means longer vacancies and softer asking-rent achievability than the comps imply.
- What's the recent tenant-quality profile in this submarket — average credit score on applications, eviction rate, late-payment / NSF rate, and stable-employment percentage? A property-management company in the area should have these aggregated.
- How much new for-sale + rental construction is in the pipeline within 1–3 miles? Heavy new supply typically softens prices + rents 12–24 months out; constrained supply supports both.
Investment metrics
- 1% rule
- 0.57% ✗
- Cap rate
- 3.70%
- Cash-on-cash
- -9.28%
- DSCR
- 0.59
- GRM
- 14.7
CMA / ARV
- ARV (median comp)
- $734,510
- List price
- $599,000
- Delta
- -18.45%
- Verdict
- UNDERPRICED
- Comps
- 20 within 1.0 mi
Projected returns pro-forma
-3.0% appreciation · 3.0% rent growth · sell at horizon
- IRR
- -32.8%
- Equity multiple
- -0.07×
- Total profit
- $-179,692
- Equity at exit
- $89,313
- IRR
- -39.3%
- Equity multiple
- -0.57×
- Total profit
- $-262,996
- Equity at exit
- $51,791
Cash invested: $167,720 (down + closing). Projections, not guarantees.
Landlord ↔ Tenant lean methodology
- Overall (STATE)
- 31 Tenant-Leaning
- State Rhode Island
- 31 Tenant-Leaning · D+8
- County
- — inherits STATE
- City
- — inherits STATE
ZIP-level market 02806
- Active inventory
- 94
- Price-to-rent
- 14.7×
Monthly cashflow live
- Estimated rent
- $3,400 medium interval (Pro) →
- Mortgage (P&I)
- −$3,141
- Tax from tax record
- −$592 /mo · $7,102/yr
- Insurance
- −$250
- HOA
- −$0
- Vacancy / Maint / Mgmt
- −$714
- Net cashflow
- $-1,297
Break-even live
UW: 25.0% down · 7.5% · 30yr · 1.5% tax · 5.0% vac · 8.0% maint · 8.0% mgmt
Financing live
Cash to close
- Down payment
- $149,750
- Closing costs
- $17,970
- Reserves months
- —
- Total cash needed
- —
Loan-product check · same deal, 3 products live
Conventional
25% down · 7.5% · 30yr
- Down + closing
- —
- Monthly P&I
- —
- Monthly cashflow
- —
- DSCR
- —
- Eligible?
- —
Personal DTI + credit; lowest rate.
DSCR
20% down · 8.5% · 30yr
- Down + closing
- —
- Monthly P&I
- —
- Monthly cashflow
- —
- DSCR
- —
- Eligible?
- —
No personal income docs; deal must DSCR.
Hard money
10% down · 12.0% · 12mo
- Down + closing
- —
- Monthly P&I
- —
- Monthly cashflow
- —
- DSCR
- —
- Eligible?
- —
Short-term bridge; refi at stabilization.
Rent comps 1 comps
| Address | Beds | Baths | Sqft | Rent | $/sqft | DOM | Units | Dist |
|---|---|---|---|---|---|---|---|---|
| 29 Baron Rd Barrington, RI | 2.0 | 1.0 | 960 | $3,400 | $3.54 | 2d | 1 | 1.26mi |
Listing history 29 events
-
2026-06-18days on market $599,000 Active 44 DOM
-
2026-06-17days on market $599,000 Active 43 DOM
-
2026-06-16days on market $599,000 Active 42 DOM
-
2026-06-15days on market $599,000 Active 41 DOM
-
2026-06-13days on market $599,000 Active 39 DOM
-
2026-06-09days on market $599,000 Active 35 DOM
-
2026-06-08days on market $599,000 Active 34 DOM
-
2026-06-07days on market $599,000 Active 33 DOM
-
2026-06-05days on market $599,000 Active 30 DOM
-
2026-06-03days on market $599,000 Active 29 DOM
-
2026-06-02days on market $599,000 Active 28 DOM
-
2026-06-01days on market $599,000 Active 27 DOM
-
2026-05-31days on market $599,000 Active 26 DOM
-
2026-05-05$599,000 Active 390-char remark
-
2024-11-25historical $3,300
-
2024-10-12price $3,300
-
2024-10-02price $3,500
-
2024-09-24$3,800
-
2021-10-19historical
-
2021-08-26$439,000 Active
-
2021-08-26historical
-
2021-08-06price $449,250
-
2021-07-30price $501,000
-
2021-07-30$499,900 Active
-
2017-07-17soldstatus $266,000 Sold
-
2017-07-17soldstatus $266,000
-
2017-06-22status Pending
-
2017-06-05historical Active - Under Contract
-
2017-06-01$269,000 Active
ⓘ Source: listings_history table (triggers on properties + properties_extension) + one-shot
backfill from property_details.listing_events for pre-trigger history.
Tax reassessment forecast RI · Partial reset (capped growth)
- Current annual tax
- $7,102 · $592/mo
- Projected year-2 tax
- $8,433 · $703/mo
- Expected delta
- +$1,331/yr (+$111/mo · 18.7%)
ⓘ Screening estimate from a state-policy table — verify with the county assessor before closing.
Climate risk First Street
- Flood 1/10 Low FEMA zone X (shaded) · 0% chance over 30 yrs
- Wildfire 1/10 Low
- Heat 5/10 Major 7 d/yr ≥96°F today · 15 d/yr by 30 yrs out
- Wind 8/10 Severe 80% chance of damaging wind over 30 yrs
- Air quality 2/10 Low 2 unhealthy d/yr today · 2 by 30 yrs out
Nearby sold comps map
Loading sold comps map…
Walkable amenities ~0.75 mi
Loading nearby amenities…
Taxation est. · year 1
- Rental income
- $40,800
- − Mortgage interest
- −$33,553
- − Property taxes
- −$7,102
- − Insurance
- −$2,995
- − Repairs & maintenance
- −$3,264
- − Management
- −$3,264
- − Depreciation
- −$17,425
- Taxable loss
- −$26,804
- Est. tax savings @ 24.0%
- +$6,433
- After-tax cash flow
- $-9,127/yr
For passive investors: Depreciation is non-cash, so a rental often shows a tax loss while cash-flowing — sheltering income. Rental losses are passive: they offset passive income freely, and up to $25,000/yr can offset ordinary (W-2) income if you actively participate and your MAGI is under $100k (phasing out to $0 by $150k); unused losses carry forward. On sale, claimed depreciation is recaptured at up to 25%, and gains may owe capital-gains tax (a 1031 exchange can defer both). Figures are a year-1 estimate at your 24.0% rate — not tax advice; consult a CPA.
Schools (NCES district)
- District
- Barrington
- NCES district ID
- 4400030
- Math proficiency
- 55% ▼ -11.00%
- Reading proficiency
- 70% ▼ -5.00%
- Median HH income
- $104,568
- Composite
- 58.31/100
- National rank
- #1016
- State rank
- #1 of 39 in RI
Livability — Barrington
No livability data for this city. (Only ~50 U.S. cities are tracked.)
Census & demographics
- Population (ZIP)
- 17,113
Population outlook (Bristol County) Hauer SSP2
- Today (2025)
- 49,175 people
- By 2030
- 48,295 · -1.8%
- By 2040
- 45,652 · -7.2%
- By 2050
- 43,093 · -12.4%
- By 2075
- 38,508 · -21.7%
- By 2100
- 34,809 · -29.2%
Race, ethnicity, and origin ACS 2023
- Neighborhood character
- Predominantly White (85%)
- Race & ethnicity
- White 85% Hispanic / Latino 6% Two or more races 6% Asian 5%
- Hispanic origin (detail)
- Mexican 1% Puerto Rican 1%
- Common ancestry
- Russian 8% Lithuanian 4% Romanian 3%
- Foreign-born
- 9% · China, Canada
- Languages at home
- 90% English-only · Spanish 3% Other Indo-European 3% Chinese 2%
Political lean MEDSL · Bristol
- 2024 margin
- Strong D (+26.4) · D 62.1% · R 35.7% · Other 2.2%
- 2008→2024 swing
- -0.4pp no change · 2008: 26.8pp · 2024: 26.4pp
- All cycles
- 2024: D+26.4 2020: D+29.2 2016: D+22.8 2012: D+23.3 2008: D+26.8
Not yet ingested
- Civics
- —
Market trends
- HPI YoY
- ▼ -655.62%
- Current HPI
- 392.5723
- Rent YoY
- —
- Metro
- —
- State GDP YoY
- ▲ 2.25%
- F500 in state
- 10
Industry mix (Fortune 500 HQ in RI)
| Industry | F500 HQs | Revenue |
|---|---|---|
| Healthcare | 1 | $373B |
|
||
| Food Distribution | 1 | $31B |
|
||
| Aerospace / Defense | 1 | $14B |
|
||
| Financial Services | 1 | $8B |
|
||
| Consumer Goods | 1 | $4B |
|
||
Price history
+122.7% since first listed16 events — show timeline
- 2026-05-05 Listed $599,000 RIS
- 2024-11-25 Rental Removed $3,300 RIS
- 2024-10-12 Price Changed $3,300 RIS
- 2024-10-02 Price Changed $3,500 RIS
- 2024-09-24 Listed for Rent $3,800 RIS
- 2021-10-19 Listing Removed — RIS
- 2021-08-26 Listing Removed — RIS
- 2021-08-26 Listed $439,000 RIS
- 2021-08-06 Price Changed $449,250 RIS
- 2021-07-30 Price Changed $501,000 RIS
- 2021-07-30 Listed $499,900 RIS
- 2017-07-17 Sold (Public Records) $266,000 Public Records
- 2017-07-17 Sold (MLS) $266,000 RIS
- 2017-06-22 Pending — RIS
- 2017-06-05 Contingent — RIS
- 2017-06-01 Listed $269,000 RIS
Property tax history
+4.0%/yrLatest (2025): $7,102 · +4.0% YoY. Source: county tax records.
Cash-flow waterfall
monthlySold comps — $/sqft
last 12 mo · ≤1 miLoading sold comps…