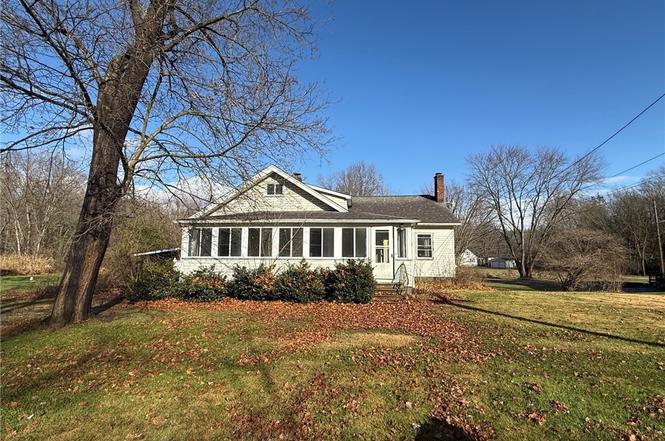
5450 Park Rd · Leavittsburg, OH
Flood risk 1/10 · Minimal
- FEMA flood zone
- X (unshaded)
- Chance of flooding over 30 yrs
- 0.0%
- Est. flood insurance / yr
- $473 – $860
Fire risk 1/10 · Minimal
- Est. fire insurance / yr
- $713 – $1,323
Heat risk 3/10 · Minor
- Hot days now (above 97°F)
- 7 days/yr
- Hot days in 30 yrs
- 17 days/yr
Wind risk 1/10 · Minimal
- Chance of severe wind over 30 yrs
- —
Air-quality risk 3/10 · Minor
- Unhealthy air days now
- 1 days/yr
- Unhealthy air days in 30 yrs
- 4 days/yr
Risk factors via First Street. Map © Google.
Why this score? — see what drove the A- grade
The composite is a weighted blend of 9 inputs, each scored 0–100. Each bar is that input's sub-score; the figure is the points it added to the 100-point composite (weight × sub-score).
- Cash flow +30.0/30.0
- 1% rule +10.0/10.0
- DSCR +10.0/10.0
- Appreciation +10.0/10.0
- ARV discount +7.5/15.0
- Schools +5.1/10.0
- Livability +3.4/5.0
- Rent growth +2.5/5.0
- Condition / age +2.5/5.0
$49,900
🖨 Deal sheet 📄 Offer letter ✓ Due diligence
Listing remarks
Call today and learn about this great opportunity to own 5450 Park Rd. The offers 4 bedrooms 2 full bathrooms hard wood floors and a large enclosed front porch. Step outside to find almost 1 Arce on two lots.
Key facts
- Hard wood floors
- 0.96 acre lot
- Garage
Tags
Neighborhood map
What this means for you Summary
Snapshot
- This is a 4-bed/1.5-bath single-family listed at $50k.
Deal economics
- At list price, monthly cash flow is $585 ($7k/yr) — positive.
- The deal already cash-flows at list — no discount required.
- Meets the 1% rule at list price ($1k rent vs $50k).
- Recommended offer: $48k (3.0% below list) — sets the bar for market timing.
Location & tenants
- Location reads 68/100 on livability (#567 in OH) — a middle-class / working-renter tenant base. Strengths: crime A+, cost of living A+, housing A+; Watch: amenities F, commute F, employment F.
- Labrae Local (suburban): math 56% / reading 65% proficiency, ranked #288 of 656 in OH (top 44%) — acceptable for families but not a draw, mixed tenant base, ~2y average lease.
- Market conditions: 9 active listings in the ZIP; 129 units permitted in Trumbull County in 2024 (0 in 5+ unit buildings).
Forward outlook
- In year one you build about $5k of equity ($345 loan paydown + $5k appreciation (10.0% local appreciation)).
- Trumbull County population projected at -22% by 2050 — secular population decline; favor cash flow + early exit over multi-decade hold.
- At projected returns (10.0% appreciation + 3.0% rent growth), your $14k cash investment doubles in ~2 years — after that, you're playing with house money.
- By year 6, paydown + projected appreciation supports a ~$31k cash-out refi (75% LTV) — recoverable capital for the next deal without selling this one.
Negotiation context
- It's been on market 41 days — a 3% lower offer ($48k) is reasonable based on typical stale-listing flexibility.
- Current owner paid $36k; 39% above their basis — modest negotiation headroom, anchor on the comps not their cost.
Risks & watch-outs
- Watch-outs: built in 1929 — expect roof / HVAC / electrical / plumbing capex.
Questions for the listing agent
- It's been on market 41 days. Have you received any prior offers? Is the seller open to a 3% concession, seller financing, or rate buy-down credit?
- Built in 1929 — when were the roof, HVAC, electrical panel, plumbing, and water heater last replaced?
- Is there a deadline driving the sale (1031 exchange, divorce, estate, relocation)? That informs how much negotiation room exists.
- Schools are A-rated — typically a magnet for longer-tenancy family renters. What's the average tenant stay here, and is there a school-zone premium baked into asking?
- What's the average days-on-market for RENTAL listings here right now (not sales)? A rising rental-DOM trend means longer vacancies and softer asking-rent achievability than the comps imply.
- What's the recent tenant-quality profile in this submarket — average credit score on applications, eviction rate, late-payment / NSF rate, and stable-employment percentage? A property-management company in the area should have these aggregated.
- How much new for-sale + rental construction is in the pipeline within 1–3 miles? Heavy new supply typically softens prices + rents 12–24 months out; constrained supply supports both.
Investment metrics
- 1% rule
- 2.37% ✓
- Cap rate
- 20.37%
- Cash-on-cash
- 50.26%
- DSCR
- 3.24
- GRM
- 3.5
CMA / ARV
- ARV (on-the-fly)
- $162,000
- Comps found
- 10
Show comp detail 10 sales within ~0.75 mi
| Address | Dist | Beds/Ba | Sqft | Sold | Price | $/sf | Match |
|---|---|---|---|---|---|---|---|
| 590 Ruth Ave | 0.16mi | 3/1.5 (-1) | 1,243 (-4%) | 3mo | $175,000 | $141 | 78 |
| 5394 Park Rd | 0.06mi | 3/1.0 (-1) | 1,238 (-4%) | 19mo | $145,000 | $117 | 66 |
| 580 Ruth Ave | 0.16mi | 3/1.0 (-1) | 1,367 (+6%) | 14mo | $140,000 | $102 | 64 |
| 410 Hobart Rd | 0.44mi | 3/2.0 (-1) | 1,240 (-4%) | 9mo | $155,000 | $125 | 58 |
| 728 Potic Dr | 0.43mi | 3/1.0 (-1) | 1,146 (-12%) | 2mo | $156,691 | $137 | 52 |
| 541 N Leavitt Rd | 0.40mi | 3/1.0 (-1) | 1,392 (+7%) | 18mo | $48,200 | $35 | 47 |
| 4558 Eagle Creek Rd | 0.57mi | 3/1.5 (-1) | 1,440 (+11%) | 8mo | $215,000 | $149 | 43 |
| 5331 Eagle Creek Rd | 0.57mi | 3/1.5 (-1) | 1,483 (+14%) | 14mo | $143,000 | $96 | 33 |
| 5597 Eagle Crk | 0.72mi | 3/1.0 (-1) | 1,115 (-14%) | 7mo | $152,000 | $136 | 30 |
| 4431 Turner Rd | 0.57mi | 3/1.5 (-1) | 1,452 (+12%) | 24mo | $168,000 | $116 | 29 |
Match score weights: distance 35% · size 25% · config 20% · recency 20%. Top-matched comps best support the ARV.
Projected returns pro-forma
10.0% appreciation · 3.0% rent growth · sell at horizon
- IRR
- 63.8%
- Equity multiple
- 5.61×
- Total profit
- $64,468
- Equity at exit
- $44,954
- IRR
- 57.4%
- Equity multiple
- 12.49×
- Total profit
- $160,581
- Equity at exit
- $96,945
Cash invested: $13,972 (down + closing). Projections, not guarantees.
Landlord ↔ Tenant lean methodology
- Overall (STATE)
- 73 Landlord-Friendly
- State Ohio
- 73 Landlord-Friendly · R+6
- County
- — inherits STATE
- City
- — inherits STATE
ZIP-level market 44430
- Home prices YoY
- 8.9%
- Active inventory
- 9
- Price-to-rent
- 3.5×
Monthly cashflow live
- Estimated rent
- $1,184 medium interval (Pro) →
- Mortgage (P&I)
- −$262
- Tax from tax record
- −$68 /mo · $816/yr
- Insurance
- −$21
- HOA
- −$0
- Vacancy / Maint / Mgmt
- −$249
- Net cashflow
- $585
Break-even live
UW: 25.0% down · 7.5% · 30yr · 1.5% tax · 5.0% vac · 8.0% maint · 8.0% mgmt
Financing live
Cash to close
- Down payment
- $12,475
- Closing costs
- $1,497
- Reserves months
- —
- Total cash needed
- —
Loan-product check · same deal, 3 products live
Conventional
25% down · 7.5% · 30yr
- Down + closing
- —
- Monthly P&I
- —
- Monthly cashflow
- —
- DSCR
- —
- Eligible?
- —
Personal DTI + credit; lowest rate.
DSCR
20% down · 8.5% · 30yr
- Down + closing
- —
- Monthly P&I
- —
- Monthly cashflow
- —
- DSCR
- —
- Eligible?
- —
No personal income docs; deal must DSCR.
Hard money
10% down · 12.0% · 12mo
- Down + closing
- —
- Monthly P&I
- —
- Monthly cashflow
- —
- DSCR
- —
- Eligible?
- —
Short-term bridge; refi at stabilization.
Listing history 4 events
-
2026-01-10status Pending
-
2025-11-28$49,900 Active
-
2025-09-15soldstatus $36,000
-
1990-05-15soldstatus $45,300
ⓘ Source: listings_history table (triggers on properties + properties_extension) + one-shot
backfill from property_details.listing_events for pre-trigger history.
Tax reassessment forecast OH · Partial reset (capped growth)
- Current annual tax
- $816 · $68/mo
- Projected year-2 tax
- $816 · $68/mo
- Expected delta
- $0/yr ($0/mo · 0.0%)
ⓘ Screening estimate from a state-policy table — verify with the county assessor before closing.
Climate risk First Street
- Flood 1/10 Low FEMA zone X (unshaded) · 0% chance over 30 yrs
- Wildfire 1/10 Low
- Heat 3/10 Moderate 7 d/yr ≥97°F today · 17 d/yr by 30 yrs out
- Wind 1/10 Low
- Air quality 3/10 Moderate 1 unhealthy d/yr today · 4 by 30 yrs out
Nearby sold comps map
Loading sold comps map…
Walkable amenities ~0.75 mi
Loading nearby amenities…
Taxation est. · year 1
- Rental income
- $14,213
- − Mortgage interest
- −$2,795
- − Property taxes
- −$816
- − Insurance
- −$250
- − Repairs & maintenance
- −$1,137
- − Management
- −$1,137
- − Depreciation
- −$1,452
- Taxable income
- $6,626
- Est. tax owed @ 24.0%
- −$1,590
- After-tax cash flow
- $5,432/yr
For passive investors: Depreciation is non-cash, so a rental often shows a tax loss while cash-flowing — sheltering income. Rental losses are passive: they offset passive income freely, and up to $25,000/yr can offset ordinary (W-2) income if you actively participate and your MAGI is under $100k (phasing out to $0 by $150k); unused losses carry forward. On sale, claimed depreciation is recaptured at up to 25%, and gains may owe capital-gains tax (a 1031 exchange can defer both). Figures are a year-1 estimate at your 24.0% rate — not tax advice; consult a CPA.
Schools (NCES district)
- District
- Labrae Local
- NCES district ID
- 3905024
- Math proficiency
- 56% ▼ -10.00%
- Reading proficiency
- 65% ▼ -5.00%
- Median HH income
- $46,322
- Composite
- 51.11/100
- National rank
- #1766
- State rank
- #288 of 656 in OH
Livability — Leavittsburg
- Score
- 68/100
- State rank
- #567
- US rank
- #9723
Category grades
Schools grade is shown separately in the Schools card above.
Census & demographics
- Census place
- Leavittsburg, OH
- County
- Trumbull · 193,293 people
- Metro
- Youngstown-Warren, OH
- Population (ZIP)
- 4,554
- Household income
- $57,500
- Rent vs Own
- Severe rent burden
- 18.6
Population outlook (Trumbull County) Hauer SSP2
- Today (2025)
- 191,696 people
- By 2030
- 184,015 · -4.0%
- By 2040
- 166,810 · -13.0%
- By 2050
- 149,857 · -21.8%
- By 2075
- 115,769 · -39.6%
- By 2100
- 83,617 · -56.4%
Race, ethnicity, and origin ACS 2023
- Neighborhood character
- Predominantly White (76%)
- Race & ethnicity
- White 76% Black 15% Two or more races 8% Hispanic / Latino 4%
- Common ancestry
- Romanian 2% Lithuanian 1% Italian 1%
- Foreign-born
- 1% · Canada
- Languages at home
- 98% English-only · Spanish 2%
Political lean MEDSL · Trumbull
- 2024 margin
- R (+16.8) · D 41.2% · R 58.0%
- 2008→2024 swing
- -39.2pp toward R · 2008: 22.4pp · 2024: -16.8pp
- All cycles
- 2024: R+16.8 2020: R+10.6 2016: R+6.4 2012: D+22.2 2008: D+22.4
Not yet ingested
- Civics
- —
Market trends
- HPI YoY
- ▲ 19.30%
- Current HPI
- 235.3891
- Rent YoY
- —
- Metro
- —
- State GDP YoY
- ▲ 1.98%
- F500 in state
- 48
Industry mix (Fortune 500 HQ in OH)
| Industry | F500 HQs | Revenue |
|---|---|---|
| Insurance | 3 | $145B |
|
||
| Industrial Machinery | 3 | $49B |
|
||
| Financial Services | 3 | $24B |
|
||
| Consumer Goods | 2 | $93B |
|
||
| Aerospace / Defense | 2 | $47B |
|
||
| Utilities | 2 | $33B |
|
||
Price history
+10.2% since first listed4 events — show timeline
- 2026-01-10 Pending — MLSNOW
- 2025-11-28 Listed $49,900 MLSNOW
- 2025-09-15 Sold (Public Records) $36,000 Public Records
- 1990-05-15 Sold (Public Records) $45,300 Public Records
Property tax history
+1.3%/yrLatest (2025): $816 · -1.2% YoY. Source: county tax records.
Cash-flow waterfall
monthlySold comps — $/sqft
last 12 mo · ≤1 miLoading sold comps…