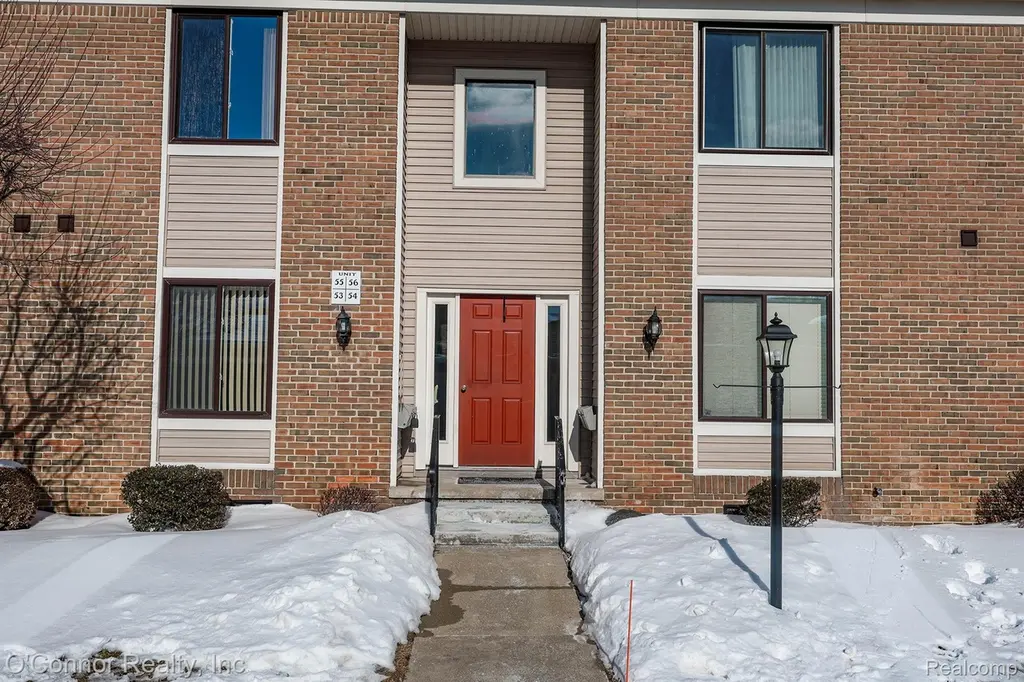
1660 River Rd #53 · Marysville, MI
Flood risk 1/10 · Minimal
- FEMA flood zone
- X (unshaded)
- Chance of flooding over 30 yrs
- 0.0%
- Est. flood insurance / yr
- $507 – $1,088
Fire risk 1/10 · Minimal
- Est. fire insurance / yr
- $784 – $1,456
Heat risk 3/10 · Minor
- Hot days now (above 99°F)
- 7 days/yr
- Hot days in 30 yrs
- 14 days/yr
Wind risk 1/10 · Minimal
- Chance of severe wind over 30 yrs
- —
Air-quality risk 3/10 · Minor
- Unhealthy air days now
- 2 days/yr
- Unhealthy air days in 30 yrs
- 3 days/yr
Risk factors via First Street. Map © Google.
Why this score? — see what drove the D- grade
The composite is a weighted blend of 9 inputs, each scored 0–100. Each bar is that input's sub-score; the figure is the points it added to the 100-point composite (weight × sub-score).
- Cash flow +13.7/30.0
- 1% rule +5.2/10.0
- Schools +4.2/10.0
- DSCR +4.1/10.0
- Livability +3.9/5.0
- ARV discount +3.4/15.0
- Rent growth +2.5/5.0
- Condition / age +2.5/5.0
- Appreciation +0.0/10.0
$205,900
🖨 Deal sheet 📄 Offer letter ✓ Due diligence
Listing remarks MLS
Lost Whale condominium. This entry-level, 2-bedroom, 2-bathroom condo offers a fantastic view of the St. Clair River, providing a serene backdrop to your daily life. Spanning 1,054 sq. ft. , the unit features a spacious primary suite, convenient in-unit laundry, and a detached garage. Perfectly situated for those who love the water, this condo is a peaceful retreat you won't want to miss! Only minutes from walking path along the river, Marysville Golf Course and much more. Association fee includes water and electricity service to garage
Key facts
- In-unit laundry
- Walking path
- Detached garage
Tags
Neighborhood map
What this means for you Summary
Snapshot
- This is a 2-bed/2.0-bath condo listed at $206k.
Deal economics
- At list price, monthly cash flow is $14 ($167/yr) — positive.
- The deal already cash-flows at list — no discount required.
- Meets the 1% rule at list price ($2k rent vs $206k).
- Recommended offer: $181k (12.0% below list) — sets the bar for market timing.
- Cap rate 6.4% vs local median 4.8% in Marysville — top-decile yield for the area; either an underpriced asset or a hidden risk that comps aren't pricing in. Stress-test before assuming the spread holds.
Location & tenants
- Location reads 78/100 on livability (#114 in MI, #2,700 nationally) — a middle-class / working-renter tenant base. Strengths: crime A+, cost of living A+, housing A+; Watch: amenities C-, employment D+, health & safety D.
- Marysville Public Schools (suburban): math 42% / reading 53% proficiency, ranked #115 of 540 in MI (top 21%) — families likely to look elsewhere, expect single-tenant / working-renter base with shorter leases.
- Market conditions: 84 active listings in the ZIP; 232 units permitted in St. Clair County in 2024 (0 in 5+ unit buildings).
Forward outlook
- Local home prices are declining (-3.0%/yr); year-one equity from $1k of loan paydown is wiped out by about $6k of value loss. Plan a longer hold.
- St. Clair County population projected at -20% by 2050 — secular population decline; favor cash flow + early exit over multi-decade hold.
Negotiation context
- It's been on market 128 days — a 12% lower offer ($181k) is reasonable based on typical stale-listing flexibility.
- 4 sale attempts since 15y ago with the ask held roughly flat each time — persistent listings suggest the price (not the market) is what's stuck; bring a comps-based counter.
- Current owner paid $85k; list at $206k implies a 142% gain — meaningful room to come down on a strong offer.
Questions for the listing agent
- It's been on market 128 days. Have you received any prior offers? Is the seller open to a 12% concession, seller financing, or rate buy-down credit?
- What does the HOA fee cover, when was the last increase, and are there any pending special assessments or reserve-fund shortfalls?
- Any open or pending special assessments — roof, HVAC, plumbing, elevator, façade? What's the per-unit balance and payoff schedule, and is the seller paying it off at close or rolling it to the buyer?
- Why hasn't it sold? Are there any deal-killer items the seller is aware of (foundation, flood, title, zoning, code violations)?
- Is there a deadline driving the sale (1031 exchange, divorce, estate, relocation)? That informs how much negotiation room exists.
- Schools are B-rated — typically a magnet for longer-tenancy family renters. What's the average tenant stay here, and is there a school-zone premium baked into asking?
- The area grade is low — what's the realistic commute time and amenity access for the typical tenant pool here? Any planned neighborhood developments (good or bad) we should know about?
- What's the average days-on-market for RENTAL listings here right now (not sales)? A rising rental-DOM trend means longer vacancies and softer asking-rent achievability than the comps imply.
- What's the recent tenant-quality profile in this submarket — average credit score on applications, eviction rate, late-payment / NSF rate, and stable-employment percentage? A property-management company in the area should have these aggregated.
- How much new apartment / multifamily construction is in the pipeline within 1–3 miles? Heavy new supply (>2% of stock underway) typically softens rents 12–24 months out; light construction supports rent growth.
Investment metrics
- 1% rule
- 1.02% ✓
- Cap rate
- 6.37%
- Cash-on-cash
- 0.29%
- DSCR
- 1.01
- GRM
- 8.2
CMA / ARV
- ARV (median comp)
- $188,620
- List price
- $205,900
- Delta
- 9.16%
- Verdict
- FAIR
- Comps
- 20 within 1.0 mi
Projected returns pro-forma
-3.0% appreciation · 3.0% rent growth · sell at horizon
- IRR
- -15.7%
- Equity multiple
- 0.44×
- Total profit
- $-32,312
- Equity at exit
- $30,700
- IRR
- -7.2%
- Equity multiple
- 0.54×
- Total profit
- $-26,327
- Equity at exit
- $17,802
Cash invested: $57,652 (down + closing). Projections, not guarantees.
Landlord ↔ Tenant lean methodology
- Overall (STATE)
- 62 Landlord-Friendly
- State Michigan
- 62 Landlord-Friendly · EVEN
- County
- — inherits STATE
- City
- — inherits STATE
ZIP-level market 48040
- Home prices YoY
- -34.4%
- Active inventory
- 84
- Price-to-rent
- 8.2×
Monthly cashflow live
- Estimated rent
- $2,091 medium interval (Pro) →
- Mortgage (P&I)
- −$1,080
- Tax from tax record
- −$123 /mo · $1,473/yr
- Insurance
- −$86
- HOA
- −$350
- Vacancy / Maint / Mgmt
- −$439
- Net cashflow
- $14
Break-even live
UW: 25.0% down · 7.5% · 30yr · 1.5% tax · 5.0% vac · 8.0% maint · 8.0% mgmt
Financing live
Cash to close
- Down payment
- $51,475
- Closing costs
- $6,177
- Reserves months
- —
- Total cash needed
- —
Loan-product check · same deal, 3 products live
Conventional
25% down · 7.5% · 30yr
- Down + closing
- —
- Monthly P&I
- —
- Monthly cashflow
- —
- DSCR
- —
- Eligible?
- —
Personal DTI + credit; lowest rate.
DSCR
20% down · 8.5% · 30yr
- Down + closing
- —
- Monthly P&I
- —
- Monthly cashflow
- —
- DSCR
- —
- Eligible?
- —
No personal income docs; deal must DSCR.
Hard money
10% down · 12.0% · 12mo
- Down + closing
- —
- Monthly P&I
- —
- Monthly cashflow
- —
- DSCR
- —
- Eligible?
- —
Short-term bridge; refi at stabilization.
HOA detail condo
- Monthly dues
- $350 · $4,200/yr
- Likely covers
- waterelectric
- Assessments
- None detected in remarks — confirm with the listing agent.
Listing history 21 events
-
2026-06-18days on market $205,900 Active 128 DOM
-
2026-06-17days on market $205,900 Active 127 DOM
-
2026-06-16days on market $205,900 Active 126 DOM
-
2026-06-15days on market $205,900 Active 125 DOM
-
2026-06-13days on market $205,900 Active 123 DOM
-
2026-06-09days on market $205,900 Active 119 DOM
-
2026-06-08pricedays on market $205,900 Active 118 DOM
-
2026-06-07days on market $209,900 Active 117 DOM
-
2026-06-04days on market $209,900 Active 114 DOM
-
2026-06-03days on market $209,900 Active 113 DOM
-
2026-06-02days on market $209,900 Active 112 DOM
-
2026-06-01days on market $209,900 Active 111 DOM
-
2026-05-31days on market $209,900 Active 110 DOM
-
2026-02-10$209,900 Active 542-char remark
Show marketing remark (542 chars)
Lost Whale condominium. This entry-level, 2-bedroom, 2-bathroom condo offers a fantastic view of the St. Clair River, providing a serene backdrop to your daily life. Spanning 1,054 sq. ft. , the unit features a spacious primary suite, convenient in-unit laundry, and a detached garage. Perfectly situated for those who love the water, this condo is a peaceful retreat you won't want to miss! Only minutes from walking path along the river, Marysville Golf Course and much more. Association fee includes water and electricity service to garage
-
2011-09-20soldstatus $85,000
-
2011-09-15soldstatus $85,000
-
2011-09-15soldstatus $85,000
-
2011-09-02historical
-
2011-07-29$89,900
-
2011-07-29$89,900
ⓘ Source: listings_history table (triggers on properties + properties_extension) + one-shot
backfill from property_details.listing_events for pre-trigger history.
Tax reassessment forecast MI · Partial reset (capped growth)
- Current annual tax
- $1,473 · $123/mo
- Projected year-2 tax
- $2,322 · $194/mo
- Expected delta
- +$849/yr (+$71/mo · 57.6%)
ⓘ Screening estimate from a state-policy table — verify with the county assessor before closing.
Climate risk First Street
- Flood 1/10 Low FEMA zone X (unshaded) · 0% chance over 30 yrs
- Wildfire 1/10 Low
- Heat 3/10 Moderate 7 d/yr ≥99°F today · 14 d/yr by 30 yrs out
- Wind 1/10 Low
- Air quality 3/10 Moderate 2 unhealthy d/yr today · 3 by 30 yrs out
Nearby sold comps map
Loading sold comps map…
Walkable amenities ~0.75 mi
Loading nearby amenities…
Taxation est. · year 1
- Rental income
- $25,098
- − Mortgage interest
- −$11,534
- − Property taxes
- −$1,473
- − Insurance
- −$1,030
- − Repairs & maintenance
- −$2,008
- − Management
- −$2,008
- − HOA
- −$4,200
- − Depreciation
- −$5,990
- Taxable loss
- −$3,144
- Est. tax savings @ 24.0%
- +$755
- After-tax cash flow
- $922/yr
For passive investors: Depreciation is non-cash, so a rental often shows a tax loss while cash-flowing — sheltering income. Rental losses are passive: they offset passive income freely, and up to $25,000/yr can offset ordinary (W-2) income if you actively participate and your MAGI is under $100k (phasing out to $0 by $150k); unused losses carry forward. On sale, claimed depreciation is recaptured at up to 25%, and gains may owe capital-gains tax (a 1031 exchange can defer both). Figures are a year-1 estimate at your 24.0% rate — not tax advice; consult a CPA.
Schools (NCES district)
- District
- Marysville Public Schools
- NCES district ID
- 2623040
- Math proficiency
- 42% ▼ -14.00%
- Reading proficiency
- 53% ▼ -12.00%
- Median HH income
- $58,817
- Composite
- 41.51/100
- National rank
- #3454
- State rank
- #115 of 540 in MI
Livability — Marysville
- Score
- 78/100
- State rank
- #114
- US rank
- #2700
Category grades
Schools grade is shown separately in the Schools card above.
Census & demographics
- Census place
- Marysville, MI
- City population
- 9,942
- Population (ZIP)
- 9,942
Population outlook (St. Clair County) Hauer SSP2
- Today (2025)
- 154,587 people
- By 2030
- 150,031 · -2.9%
- By 2040
- 138,177 · -10.6%
- By 2050
- 124,390 · -19.5%
- By 2075
- 95,825 · -38.0%
- By 2100
- 68,672 · -55.6%
Race, ethnicity, and origin ACS 2023
- Neighborhood character
- Predominantly White (93%)
- Race & ethnicity
- White 93% Two or more races 3% Hispanic / Latino 1% Asian 1% Black 1%
- Common ancestry
- Romanian 11% Iranian 6% Lithuanian 5%
- Foreign-born
- 2% · Canada, Philippines
- Languages at home
- 98% English-only · Other Asian/Pacific 1%
Political lean MEDSL · St. Clair
- 2024 margin
- Solid R (+34.6) · D 32.0% · R 66.6% · Other 1.4%
- 2008→2024 swing
- -37.3pp toward R · 2008: 2.6pp · 2024: -34.6pp
- All cycles
- 2024: R+34.6 2020: R+30.2 2016: R+31.4 2012: R+7.1 2008: D+2.6
Not yet ingested
- Civics
- —
Market trends
- HPI YoY
- ▼ -98.64%
- Current HPI
- 188.3932
- Rent YoY
- —
- Metro
- —
- State GDP YoY
- ▲ 1.37%
- F500 in state
- 28
Industry mix (Fortune 500 HQ in MI)
| Industry | F500 HQs | Revenue |
|---|---|---|
| Automotive Parts | 3 | $48B |
|
||
| Automotive | 2 | $372B |
|
||
| Chemicals | 1 | $45B |
|
||
| Automotive Retail | 1 | $29B |
|
||
| Healthcare / Medical Devices | 1 | $23B |
|
||
| Automotive Technology | 1 | $20B |
|
||
Price history
+133.5% since first listed8 events — show timeline
- 2026-02-10 Listed $209,900 REALCOMP
- 2026-02-10 Listed $209,900 MiRealSource-MiMLS
- 2011-09-20 Sold (Public Records) $85,000 Public Records
- 2011-09-15 Sold (MLS) $85,000 REALCOMP
- 2011-09-15 Sold (MLS) $85,000 MiRealSource-MiMLS
- 2011-09-02 Listing Removed — MiRealSource-MiMLS
- 2011-07-29 Listed $89,900 REALCOMP
- 2011-07-29 Listed $89,900 MiRealSource-MiMLS
Property tax history
-0.7%/yrLatest (2025): $1,473 · -23.1% YoY. Source: county tax records.
Cash-flow waterfall
monthlySold comps — $/sqft
last 12 mo · ≤1 miLoading sold comps…