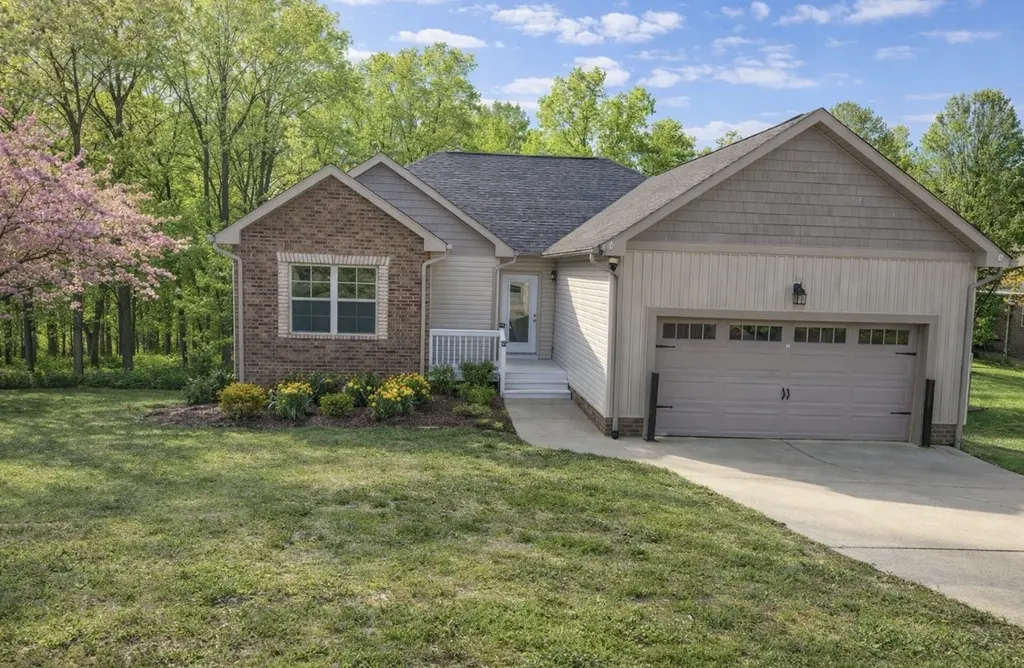
250 Wagoners Way · Westmoreland, TN
Flood risk 1/10 · Minimal
- FEMA flood zone
- X (unshaded)
- Chance of flooding over 30 yrs
- 0.0%
- Est. flood insurance / yr
- $507 – $1,088
Fire risk 4/10 · Minor
- Est. fire insurance / yr
- $949 – $1,763
Heat risk 5/10 · Moderate
- Hot days now (above 106°F)
- 7 days/yr
- Hot days in 30 yrs
- 21 days/yr
Wind risk 3/10 · Minor
- Chance of severe wind over 30 yrs
- 6.0%
Air-quality risk 3/10 · Minor
- Unhealthy air days now
- 2 days/yr
- Unhealthy air days in 30 yrs
- 4 days/yr
Risk factors via First Street. Map © Google.
Why this score? — see what drove the D- grade
The composite is a weighted blend of 9 inputs, each scored 0–100. Each bar is that input's sub-score; the figure is the points it added to the 100-point composite (weight × sub-score).
- Cash flow +9.9/30.0
- ARV discount +9.8/15.0
- Schools +3.6/10.0
- Livability +3.4/5.0
- DSCR +2.8/10.0
- Appreciation +2.7/10.0
- Rent growth +2.5/5.0
- Condition / age +2.5/5.0
- 1% rule +2.0/10.0
$315,000
🖨 Deal sheet (PDF) 📄 Offer letter ✓ Due diligence
Listing remarks MLS
Discover the perfect blend of comfort, convenience, and charm in this beautifully maintained 3-bedroom, 2-bath home located in the sought-after Ridgecrest subdivision. Nestled on a generous 0.29-acre lot with a serene wooded backdrop, this property offers both privacy and a welcoming neighborhood atmosphere. Step inside to an inviting open floor plan filled with natural light, featuring a spacious living area and a bright eat-in kitchen—ideal for everyday living and effortless entertaining. The primary suite provides a relaxing retreat with its own full bath, while two additional bedrooms offer versatility for guests, a home office, or growing needs. Enjoy outdoor living on the back deck overlooking the peaceful yard, perfect for morning coffee or evening gatherings. Additional features include a 2-car attached garage, low-maintenance gutter guards, and a full basement/crawlspace with excellent storage or future expansion potential. Conveniently located just minutes from Westmoreland, Gallatin, and Portland, with easy access to major routes—and best of all, no HOA. Whether you’re a first-time buyer, looking to downsize, or seeking a smart investment, this home checks all the boxes. Don’t miss your opportunity to make it yours!
Key facts
- Wooded backdrop
- Open floor plan
- 0.29-acre lot
Tags
Neighborhood map
What this means for you Summary
Snapshot
- This is a 3-bed/2.0-bath single-family listed at $315k.
Deal economics
- At list price, monthly cash flow is $-196 ($-2k/yr) — negative.
- To cash-flow at today's rent, offer at most $280k (11.0% below list).
- To meet the 1% rule (rent ≥ 1% of price), the offer needs to be $220k (30.3% below list).
- Recommended offer: $220k (30.3% below list) — sets the bar for 1% rule.
- Cap rate 5.5% vs local median 4.3% in Westmoreland — meaningfully above typical; check what's discounted (condition, days-on-market, listing class) to confirm the premium yield is real.
Location & tenants
- Location reads 68/100 on livability (#91 in TN) — a middle-class / working-renter tenant base. Strengths: crime A+, cost of living A+, housing A+; Watch: schools D, amenities F, commute F.
- Sumner County (suburban): math 44% / reading 39% proficiency, ranked #12 of 139 in TN (top 9%) — families likely to look elsewhere, expect single-tenant / working-renter base with shorter leases.
- Market conditions: 145 active listings in the ZIP; 1 comparable units currently listed for rent nearby; 1,748 units permitted in Sumner County in 2024 (124 in 5+ unit buildings).
Forward outlook
- Local home prices are declining (-3.0%/yr); year-one equity from $2k of loan paydown is wiped out by about $9k of value loss. Plan a longer hold.
- Sumner County population projected at +35% by 2050 — long-run rental-demand tailwind backs the buy-and-hold thesis.
Negotiation context
- It's been on market 87 days — a 6% lower offer ($296k) is reasonable based on typical stale-listing flexibility.
- 5 sale attempts since 12y ago with the ask held roughly flat each time — persistent listings suggest the price (not the market) is what's stuck; bring a comps-based counter.
- Current owner paid $145k; list at $315k implies a 117% gain — meaningful room to come down on a strong offer.
Risks & watch-outs
- Climate carrying-cost: extreme-heat days projected 7→21/yr by 2055 (HVAC capex compounding) — expect insurance premiums to compound above CPI over the hold.
Questions for the listing agent
- What do current leases actually rent for vs. the listed asking? Can we see a recent rent roll and the last 12 months of T-12 income?
- It's been on market 87 days. Have you received any prior offers? Is the seller open to a 30% concession, seller financing, or rate buy-down credit?
- Why hasn't it sold? Are there any deal-killer items the seller is aware of (foundation, flood, title, zoning, code violations)?
- Is there a deadline driving the sale (1031 exchange, divorce, estate, relocation)? That informs how much negotiation room exists.
- Schools are D-rated, which usually means shorter tenancies and higher turnover. Who's the typical renter profile here, and what's been the actual vacancy rate?
- The area grade is low — what's the realistic commute time and amenity access for the typical tenant pool here? Any planned neighborhood developments (good or bad) we should know about?
- What's the average days-on-market for RENTAL listings here right now (not sales)? A rising rental-DOM trend means longer vacancies and softer asking-rent achievability than the comps imply.
- What's the recent tenant-quality profile in this submarket — average credit score on applications, eviction rate, late-payment / NSF rate, and stable-employment percentage? A property-management company in the area should have these aggregated.
- How much new for-sale + rental construction is in the pipeline within 1–3 miles? Heavy new supply typically softens prices + rents 12–24 months out; constrained supply supports both.
Investment metrics
- 1% rule
- 0.70% ✗
- Cap rate
- 5.55%
- Cash-on-cash
- -2.67%
- DSCR
- 0.88
- GRM
- 12.0
CMA / ARV
- ARV (median comp)
- $332,193
- List price
- $315,000
- Delta
- -5.18%
- Verdict
- FAIR
- Comps
- 20 within 1.0 mi
Show comp detail 12 sales within ~0.75 mi
| Address | Dist | Beds/Ba | Sqft | Sold | Price | $/sf | Match |
|---|---|---|---|---|---|---|---|
| 450 Robins Trl | 0.11mi | 3/2.0 | 1,368 (+1%) | 12mo | $320,000 | $234 | 83 |
| 103 Hummingbird Hill Ct | 0.03mi | 3/2.0 | 1,361 (+0%) | 21mo | $312,000 | $229 | 81 |
| 246 Clyde Wix Rd | 0.40mi | 3/2.0 | 1,374 (+1%) | 13mo | $339,900 | $247 | 68 |
| 250 Clyde Wix Rd | 0.42mi | 3/2.0 | 1,374 (+1%) | 14mo | $336,000 | $245 | 66 |
| 1985 Stevens Dr | 0.63mi | 3/2.0 | 1,386 (+2%) | 10mo | $320,000 | $231 | 59 |
| 1981 Stevens Dr | 0.63mi | 3/2.0 | 1,416 (+4%) | 10mo | $330,000 | $233 | 55 |
| 2119 Stevens Dr | 0.73mi | 3/1.0 | 1,304 (-4%) | 1mo | $180,000 | $138 | 54 |
| 6102 Austin Peay Hwy | 0.66mi | 3/2.0 | 1,500 (+10%) | 10mo | $349,872 | $233 | 43 |
| 2006 Stevens Dr | 0.64mi | 3/1.0 | 1,296 (-4%) | 21mo | $240,800 | $186 | 41 |
| 4183 Bledsoe St | 0.29mi | 3/1.0 | 1,538 (+13%) | 23mo | $349,900 | $228 | 41 |
| 6009 Austin Peay Hwy | 0.70mi | 2/1.0 (-1) | 1,431 (+6%) | 12mo | $229,500 | $160 | 39 |
| 5930 Austin Peay Hwy | 0.69mi | 3/2.0 | 1,165 (-14%) | 12mo | $250,000 | $215 | 34 |
Match score weights: distance 35% · size 25% · config 20% · recency 20%. Top-matched comps best support the ARV.
Projected returns pro-forma
-3.0% appreciation · 3.0% rent growth · sell at horizon
- IRR
- -20.8%
- Equity multiple
- 0.28×
- Total profit
- $-63,657
- Equity at exit
- $46,968
- IRR
- -14.2%
- Equity multiple
- 0.18×
- Total profit
- $-72,001
- Equity at exit
- $27,235
Cash invested: $88,200 (down + closing). Projections, not guarantees.
Landlord ↔ Tenant lean methodology
- Overall (STATE)
- 87 Strongly Landlord-Friendly
- State Tennessee
- 87 Strongly Landlord-Friendly · R+13
- County
- — inherits STATE
- City
- — inherits STATE
ZIP-level market 37186
- Home prices YoY
- -1.4%
- Active inventory
- 145
- Price-to-rent
- 12.0×
Monthly cashflow live
- Estimated rent
- $2,195 medium interval (Pro) →
- Mortgage (P&I)
- −$1,652
- Tax from tax record
- −$147 /mo · $1,765/yr
- Insurance
- −$131
- HOA
- −$0
- Vacancy / Maint / Mgmt
- −$461
- Net cashflow
- $-196
Break-even live
Sensitivity live
| Price | -10% $-18 | -5% $-107 | +0% $-196 | +5% $-285 | +10% $-374 |
|---|---|---|---|---|---|
| Rent | -10% $-370 | -5% $-283 | +0% $-196 | +5% $-109 | +10% $-23 |
| Rate | -1.0pp $-38 | -0.5pp $-116 | base $-196 | +0.5pp $-278 | +1.0pp $-361 |
UW: 25.0% down · 7.5% · 30yr · 1.5% tax · 5.0% vac · 8.0% maint · 8.0% mgmt
Financing live
Cash to close
- Down payment
- $78,750
- Closing costs
- $9,450
- Reserves months
- —
- Total cash needed
- —
Loan-product check · same deal, 3 products live
Conventional
25% down · 7.5% · 30yr
- Down + closing
- —
- Monthly P&I
- —
- Monthly cashflow
- —
- DSCR
- —
- Eligible?
- —
Personal DTI + credit; lowest rate.
DSCR
20% down · 8.5% · 30yr
- Down + closing
- —
- Monthly P&I
- —
- Monthly cashflow
- —
- DSCR
- —
- Eligible?
- —
No personal income docs; deal must DSCR.
Hard money
10% down · 12.0% · 12mo
- Down + closing
- —
- Monthly P&I
- —
- Monthly cashflow
- —
- DSCR
- —
- Eligible?
- —
Short-term bridge; refi at stabilization.
Rent comps 1 comps
| Address | Beds | Baths | Sqft | Rent | $/sqft | DOM | Units | Dist |
|---|---|---|---|---|---|---|---|---|
| 2199 Fincher Dr Westmoreland, TN | 3.0 | 2.0 | 1532 | $2,195 | $1.43 | 8d | 1 | 0.89mi |
Listing history 28 events
-
2026-06-18days on market $315,000 Active 87 DOM
-
2026-06-17days on market $315,000 Active 86 DOM
-
2026-06-16days on market $315,000 Active 85 DOM
-
2026-06-15days on market $315,000 Active 84 DOM
-
2026-06-13days on market $315,000 Active 82 DOM
-
2026-06-13days on market $315,000 Active 81 DOM
-
2026-06-09days on market $315,000 Active 78 DOM
-
2026-06-08days on market $315,000 Active 77 DOM
-
2026-06-07days on market $315,000 Active 76 DOM
-
2026-06-05days on market $315,000 Active 73 DOM
-
2026-06-03days on market $315,000 Active 72 DOM
-
2026-06-02days on market $315,000 Active 71 DOM
-
2026-06-01days on market $315,000 Active 70 DOM
-
2026-05-31days on market $315,000 Active 69 DOM
-
2026-04-09price $315,000 1270-char remark
Show marketing remark (1270 chars)
Discover the perfect blend of comfort, convenience, and charm in this beautifully maintained 3-bedroom, 2-bath home located in the sought-after Ridgecrest subdivision. Nestled on a generous 0.29-acre lot with a serene wooded backdrop, this property offers both privacy and a welcoming neighborhood atmosphere. Step inside to an inviting open floor plan filled with natural light, featuring a spacious living area and a bright eat-in kitchen—ideal for everyday living and effortless entertaining. The primary suite provides a relaxing retreat with its own full bath, while two additional bedrooms offer versatility for guests, a home office, or growing needs. Enjoy outdoor living on the back deck overlooking the peaceful yard, perfect for morning coffee or evening gatherings. Additional features include a 2-car attached garage, low-maintenance gutter guards, and a full basement/crawlspace with excellent storage or future expansion potential. Conveniently located just minutes from Westmoreland, Gallatin, and Portland, with easy access to major routes—and best of all, no HOA. Whether you’re a first-time buyer, looking to downsize, or seeking a smart investment, this home checks all the boxes. Don’t miss your opportunity to make it yours!
-
2026-03-23$325,000 Active 1270-char remark
Show marketing remark (1270 chars)
Discover the perfect blend of comfort, convenience, and charm in this beautifully maintained 3-bedroom, 2-bath home located in the sought-after Ridgecrest subdivision. Nestled on a generous 0.29-acre lot with a serene wooded backdrop, this property offers both privacy and a welcoming neighborhood atmosphere. Step inside to an inviting open floor plan filled with natural light, featuring a spacious living area and a bright eat-in kitchen—ideal for everyday living and effortless entertaining. The primary suite provides a relaxing retreat with its own full bath, while two additional bedrooms offer versatility for guests, a home office, or growing needs. Enjoy outdoor living on the back deck overlooking the peaceful yard, perfect for morning coffee or evening gatherings. Additional features include a 2-car attached garage, low-maintenance gutter guards, and a full basement/crawlspace with excellent storage or future expansion potential. Conveniently located just minutes from Westmoreland, Gallatin, and Portland, with easy access to major routes—and best of all, no HOA. Whether you’re a first-time buyer, looking to downsize, or seeking a smart investment, this home checks all the boxes. Don’t miss your opportunity to make it yours!
-
2026-03-21historical
-
2026-02-17status Active
-
2026-02-17historical
-
2026-02-05price $325,000
-
2025-12-05$335,000 Active
-
2025-11-14historical
-
2015-03-04soldstatus $144,900
-
2015-02-26status Pending
-
2015-02-26soldstatus $144,900 Closed
-
2015-01-06Contingent - Inspection
-
2014-10-28$144,900
-
1998-01-06soldstatus $150,000
ⓘ Source: listings_history table (triggers on properties + properties_extension) + one-shot
backfill from property_details.listing_events for pre-trigger history.
Tax reassessment forecast TN · Resets to sale price
- Current annual tax
- $1,765 · $147/mo
- Projected year-2 tax
- $2,236 · $186/mo
- Expected delta
- +$472/yr (+$39/mo · 26.7%)
ⓘ Screening estimate from a state-policy table — verify with the county assessor before closing.
Climate risk First Street
- Flood 1/10 Low FEMA zone X (unshaded) · 0% chance over 30 yrs
- Wildfire 4/10 Moderate
- Heat 5/10 Major 7 d/yr ≥106°F today · 21 d/yr by 30 yrs out
- Wind 3/10 Moderate 6% chance of damaging wind over 30 yrs
- Air quality 3/10 Moderate 2 unhealthy d/yr today · 4 by 30 yrs out
Nearby sold comps map
Loading sold comps map…
Walkable amenities ~0.75 mi
Loading nearby amenities…
Taxation est. · year 1
- Rental income
- $26,340
- − Mortgage interest
- −$17,645
- − Property taxes
- −$1,765
- − Insurance
- −$1,575
- − Repairs & maintenance
- −$2,107
- − Management
- −$2,107
- − Depreciation
- −$9,164
- Taxable loss
- −$8,023
- Est. tax savings @ 24.0%
- +$1,926
- After-tax cash flow
- $-429/yr
For passive investors: Depreciation is non-cash, so a rental often shows a tax loss while cash-flowing — sheltering income. Rental losses are passive: they offset passive income freely, and up to $25,000/yr can offset ordinary (W-2) income if you actively participate and your MAGI is under $100k (phasing out to $0 by $150k); unused losses carry forward. On sale, claimed depreciation is recaptured at up to 25%, and gains may owe capital-gains tax (a 1031 exchange can defer both). Figures are a year-1 estimate at your 24.0% rate — not tax advice; consult a CPA.
Schools (NCES district)
- District
- Sumner County
- NCES district ID
- 4704020
- Math proficiency
- 44% ▼ -11.00%
- Reading proficiency
- 39% ▼ -5.00%
- Median HH income
- $56,998
- Composite
- 36.44/100
- National rank
- #4667
- State rank
- #12 of 139 in TN
Livability — Westmoreland
- Score
- 68/100
- State rank
- #91
- US rank
- #9706
Category grades
Schools grade is shown separately in the Schools card above.
Census & demographics
- Census place
- Westmoreland, TN
- Population (ZIP)
- 10,644
Population outlook (Sumner County) Hauer SSP2
- Today (2025)
- 208,284 people
- By 2030
- 223,902 · +7.5%
- By 2040
- 253,892 · +21.9%
- By 2050
- 281,199 · +35.0%
- By 2075
- 344,866 · +65.6%
- By 2100
- 384,369 · +84.5%
Race, ethnicity, and origin ACS 2023
- Neighborhood character
- Predominantly White (92%)
- Race & ethnicity
- White 92% Two or more races 5% Asian 1% Hispanic / Latino 1%
- Common ancestry
- Slovak 2% Lithuanian 1% Serbian 1%
- Foreign-born
- 1%
- Languages at home
- 98% English-only · Other Indo-European 1% Spanish 1%
Political lean MEDSL · Sumner
- 2024 margin
- Solid R (+41.8) · D 28.5% · R 70.3% · Other 1.1%
- 2008→2024 swing
- -6.9pp toward R · 2008: -34.9pp · 2024: -41.8pp
- All cycles
- 2024: R+41.8 2020: R+38.6 2016: R+45.0 2012: R+42.0 2008: R+34.9
Not yet ingested
- Civics
- —
Market trends
- HPI YoY
- ▼ -4.60%
- Current HPI
- 336.4711
- Rent YoY
- —
- Metro
- —
- State GDP YoY
- ▲ 2.78%
- F500 in state
- 22
Industry mix (Fortune 500 HQ in TN)
| Industry | F500 HQs | Revenue |
|---|---|---|
| Healthcare | 3 | $91B |
|
||
| Retail | 3 | $72B |
|
||
| Transportation / Logistics | 1 | $88B |
|
||
| Paper / Packaging | 1 | $19B |
|
||
| Insurance | 1 | $13B |
|
||
| Energy | 1 | $12B |
|
||
Price history
+110.0% since first listed14 events — show timeline
- 2026-04-09 Price Changed $315,000 REALTRACS as Distributed by MLS Grid
- 2026-03-23 Listed $325,000 REALTRACS as Distributed by MLS Grid
- 2026-03-21 Listing Removed — REALTRACS as Distributed by MLS Grid
- 2026-02-17 Relisted — REALTRACS as Distributed by MLS Grid
- 2026-02-17 Listing Removed — REALTRACS as Distributed by MLS Grid
- 2026-02-05 Price Changed $325,000 REALTRACS as Distributed by MLS Grid
- 2025-12-05 Listed $335,000 REALTRACS as Distributed by MLS Grid
- 2025-11-14 Coming Soon — REALTRACS as Distributed by MLS Grid
- 2015-03-04 Sold (Public Records) $144,900 Public Records
- 2015-02-26 Pending — REALTRACS as Distributed by MLS Grid
- 2015-02-26 Sold (MLS) $144,900 REALTRACS as Distributed by MLS Grid
- 2015-01-06 Listed — REALTRACS as Distributed by MLS Grid
- 2014-10-28 Listed $144,900 REALTRACS as Distributed by MLS Grid
- 1998-01-06 Sold (Public Records) $150,000 Public Records
Property tax history
+21.5%/yrLatest (2025): $1,765 · +58.4% YoY. Source: county tax records.
Cash-flow waterfall
monthlySold comps — $/sqft
last 12 mo · ≤1 miLoading sold comps…