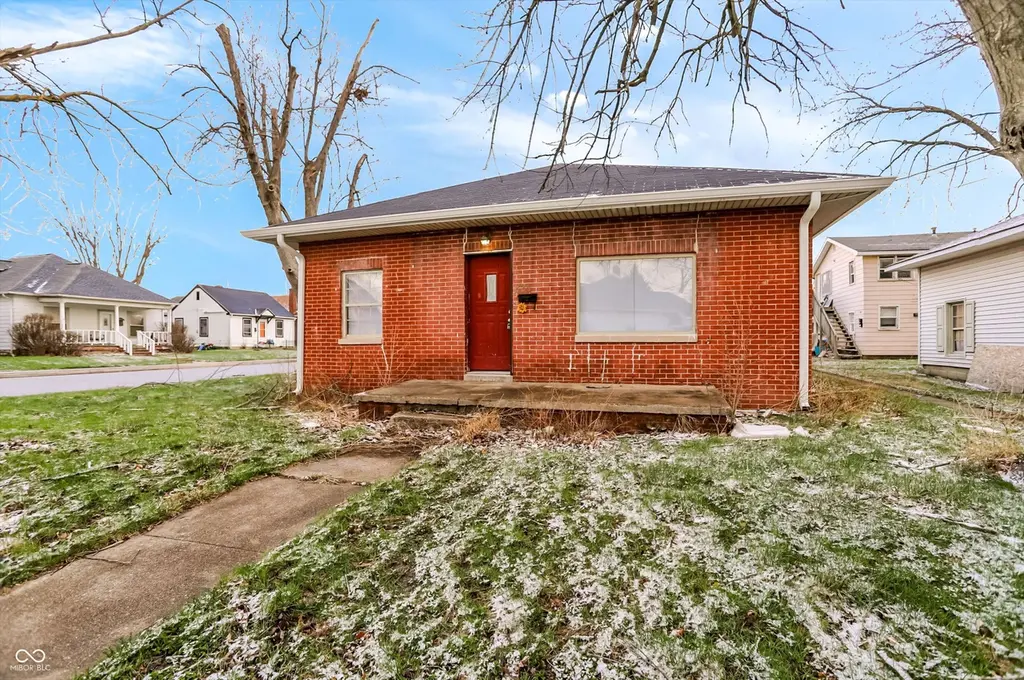
824 W Elm St · Kokomo, IN
Flood risk 6/10 · Moderate
- FEMA flood zone
- X (unshaded)
- Chance of flooding over 30 yrs
- 0.68%
- Est. flood insurance / yr
- $507 – $1,088
Fire risk 1/10 · Minimal
- Est. fire insurance / yr
- $717 – $1,331
Heat risk 3/10 · Minor
- Hot days now (above 101°F)
- 7 days/yr
- Hot days in 30 yrs
- 17 days/yr
Wind risk 2/10 · Minimal
- Chance of severe wind over 30 yrs
- —
Air-quality risk 3/10 · Minor
- Unhealthy air days now
- 2 days/yr
- Unhealthy air days in 30 yrs
- 3 days/yr
Risk factors via First Street. Map © Google.
Why this score? — see what drove the C+ grade
The composite is a weighted blend of 9 inputs, each scored 0–100. Each bar is that input's sub-score; the figure is the points it added to the 100-point composite (weight × sub-score).
- Cash flow +24.2/30.0
- ARV discount +15.0/15.0
- DSCR +7.8/10.0
- 1% rule +6.3/10.0
- Livability +3.4/5.0
- Condition / age +2.5/5.0
- Rent growth +2.1/5.0
- Schools +2.1/10.0
- Appreciation +0.0/10.0
$102,950
🖨 Deal sheet 📄 Offer letter ✓ Due diligence
Listing remarks
This full brick, 3-bedroom, 1 bath home has been recently updated & is move in ready! Nearly 1400 sq ft of living space on a single story, a large corner lot & an oversized attached carport! New gutters/downspouts have just been added. Come check out this affordable home before it's too late!!
Key facts
- Full brick
- Recently updated
- Large corner lot
Tags
Property features AI
Exterior
- Parking: Carport
- Utilities: Public water; Municipal sewer connected; Solid waste service available
- Home design: Single family residence; One story
- Construction: Brick construction; Block foundation
- Exterior features: Lot approximately 0.11 acre; Less than 1/4 acre
Interior
- Kitchen: No appliances included
- Bedrooms: 3 bedrooms on the main level
- Bathrooms: 1 full bathroom (main level)
- Heating & cooling: Forced air heating; Central air conditioning
- Interior features: Attic access; Updated/remodeled interior
- Laundry & utility: No laundry appliances listed
Neighborhood map
What this means for you Summary
Snapshot
- This is a 3-bed/1.0-bath single-family listed at $103k.
Deal economics
- At list price, monthly cash flow is $204 ($2k/yr) — positive.
- The deal already cash-flows at list — no discount required.
- Meets the 1% rule at list price ($1k rent vs $103k).
- Recommended offer: $97k (6.0% below list) — sets the bar for market timing.
- Cap rate 8.7% vs local median 5.2% in Kokomo — top-decile yield for the area; either an underpriced asset or a hidden risk that comps aren't pricing in. Stress-test before assuming the spread holds.
Location & tenants
- Location reads 68/100 on livability (#227 in IN) — a middle-class / working-renter tenant base. Strengths: cost of living A+, housing A+, health & safety A; Watch: crime D, schools F, amenities F.
- Kokomo School Corporation (urban): math 22% / reading 30% proficiency, ranked #264 of 301 in IN (top 88%) — low school quality limits family demand, transient renter base, plan for 1-2y turnover; 62% free/reduced lunch — lower-income household profile, screen leases tightly.
- Market conditions: Rents soft (-1.5%/yr); 242 active listings in the ZIP; 2 comparable units currently listed for rent nearby; 194 units permitted in Howard County in 2024 (0 in 5+ unit buildings).
Forward outlook
- Local home prices are declining (-3.0%/yr); year-one equity from $712 of loan paydown is wiped out by about $3k of value loss. Plan a longer hold.
- Howard County population projected at -11% by 2050 — secular population decline; favor cash flow + early exit over multi-decade hold.
Negotiation context
- It's been on market 81 days — a 6% lower offer ($97k) is reasonable based on typical stale-listing flexibility.
- 2 sale attempts; this cycle's ask has dropped $7k (6%) from the opening price — seller is motivated, your offer sets the floor, not the list.
Risks & watch-outs
- Watch-outs: built in 1954 — expect roof / HVAC / electrical / plumbing capex.
- Climate carrying-cost: major flood risk — expect insurance premiums to compound above CPI over the hold.
Questions for the listing agent
- It's been on market 81 days. Have you received any prior offers? Is the seller open to a 6% concession, seller financing, or rate buy-down credit?
- Built in 1954 — when were the roof, HVAC, electrical panel, plumbing, and water heater last replaced?
- Why hasn't it sold? Are there any deal-killer items the seller is aware of (foundation, flood, title, zoning, code violations)?
- Is there a deadline driving the sale (1031 exchange, divorce, estate, relocation)? That informs how much negotiation room exists.
- Schools are F-rated, which usually means shorter tenancies and higher turnover. Who's the typical renter profile here, and what's been the actual vacancy rate?
- Crime grade is D in this area — have there been break-ins, vandalism, or insurance claims at this property in the last 3 years? What carrier currently insures it and at what premium?
- What's the average days-on-market for RENTAL listings here right now (not sales)? A rising rental-DOM trend means longer vacancies and softer asking-rent achievability than the comps imply.
- What's the recent tenant-quality profile in this submarket — average credit score on applications, eviction rate, late-payment / NSF rate, and stable-employment percentage? A property-management company in the area should have these aggregated.
- How much new for-sale + rental construction is in the pipeline within 1–3 miles? Heavy new supply typically softens prices + rents 12–24 months out; constrained supply supports both.
Investment metrics
- 1% rule
- 1.13% ✓
- Cap rate
- 8.68%
- Cash-on-cash
- 8.51%
- DSCR
- 1.38
- GRM
- 7.4
CMA / ARV
- ARV (on-the-fly)
- $158,920
- Comps found
- 12
Show comp detail 12 sales within ~0.75 mi
| Address | Dist | Beds/Ba | Sqft | Sold | Price | $/sf | Match |
|---|---|---|---|---|---|---|---|
| 810 N Wabash Ave | 0.18mi | 3/1.0 | 1,364 (-0%) | 4mo | $131,900 | $97 | 87 |
| 1021 Columbus Blvd | 0.39mi | 3/1.0 | 1,304 (-5%) | 2mo | $151,253 | $116 | 72 |
| 715 N Morrison St | 0.26mi | 2/1.0 (-1) | 1,272 (-7%) | 3mo | $20,000 | $16 | 68 |
| 1416 W Tate St | 0.51mi | 4/2.0 (+1) | 1,425 (+4%) | 2mo | $155,000 | $109 | 59 |
| 1905 N Buckeye St | 0.69mi | 3/1.0 | 1,260 (-8%) | 1mo | $90,000 | $71 | 54 |
| 1210 N Webster St | 0.27mi | 4/1.0 (+1) | 1,565 (+14%) | 6mo | $61,500 | $39 | 53 |
| 1119 W Jackson St | 0.42mi | 3/2.0 | 1,179 (-14%) | 2mo | $151,000 | $128 | 51 |
| 1790 Carol Lynn Dr | 0.72mi | 3/2.0 | 1,480 (+8%) | 1mo | $252,500 | $171 | 49 |
| 1210 W Taylor St | 0.48mi | 2/1.0 (-1) | 1,184 (-14%) | 3mo | $61,000 | $52 | 47 |
| 1312 Tedlee Dr | 0.60mi | 3/2.0 | 1,200 (-12%) | 2mo | $197,500 | $165 | 46 |
| 1810 Columbus Blvd | 0.68mi | 3/1.5 | 1,568 (+14%) | 2mo | $200,000 | $128 | 40 |
| 812 N Berkley Rd | 0.73mi | 3/2.0 | 1,188 (-13%) | 4mo | $160,500 | $135 | 36 |
Match score weights: distance 35% · size 25% · config 20% · recency 20%. Top-matched comps best support the ARV.
Projected returns pro-forma
-3.0% appreciation · 0.0% rent growth · sell at horizon
- IRR
- -6.8%
- Equity multiple
- 0.76×
- Total profit
- $-7,041
- Equity at exit
- $15,350
- IRR
- -1.4%
- Equity multiple
- 0.92×
- Total profit
- $-2,428
- Equity at exit
- $8,901
Cash invested: $28,826 (down + closing). Projections, not guarantees.
Landlord ↔ Tenant lean methodology
- Overall (STATE)
- 90 Strongly Landlord-Friendly
- State Indiana
- 90 Strongly Landlord-Friendly · R+11
- County
- — inherits STATE
- City
- — inherits STATE
ZIP-level market 46901
- Home prices YoY
- -24.4%
- Rents YoY
- -1.5%
- Active inventory
- 242
- Price-to-rent
- 7.4×
Monthly cashflow live
- Estimated rent
- $1,160 medium interval (Pro) →
- Mortgage (P&I)
- −$540
- Tax from tax record
- −$129 /mo · $1,552/yr
- Insurance
- −$43
- HOA
- −$0
- Vacancy / Maint / Mgmt
- −$244
- Net cashflow
- $204
Break-even live
UW: 25.0% down · 7.5% · 30yr · 1.5% tax · 5.0% vac · 8.0% maint · 8.0% mgmt
Financing live
Cash to close
- Down payment
- $25,738
- Closing costs
- $3,088
- Reserves months
- —
- Total cash needed
- —
Loan-product check · same deal, 3 products live
Conventional
25% down · 7.5% · 30yr
- Down + closing
- —
- Monthly P&I
- —
- Monthly cashflow
- —
- DSCR
- —
- Eligible?
- —
Personal DTI + credit; lowest rate.
DSCR
20% down · 8.5% · 30yr
- Down + closing
- —
- Monthly P&I
- —
- Monthly cashflow
- —
- DSCR
- —
- Eligible?
- —
No personal income docs; deal must DSCR.
Hard money
10% down · 12.0% · 12mo
- Down + closing
- —
- Monthly P&I
- —
- Monthly cashflow
- —
- DSCR
- —
- Eligible?
- —
Short-term bridge; refi at stabilization.
Rent comps 2 comps
| Address | Beds | Baths | Sqft | Rent | $/sqft | DOM | Units | Dist |
|---|---|---|---|---|---|---|---|---|
| 800 N Dixon Rd Kokomo, IN | 2.0 | 1.0 | 885 | $1,100 | $1.24 | 23d | 7 | 1.26mi |
| 800 N Dixon Rd Kokomo, IN | 2.0 | 1.0 | 885 | $1,050 | $1.19 | 2d | 4 | 1.26mi |
Listing history 19 events
-
2026-06-19days on market $102,950 Active 81 DOM
-
2026-06-18days on market $102,950 Active 80 DOM
-
2026-06-17days on market $102,950 Active 79 DOM
-
2026-06-16days on market $102,950 Active 78 DOM
-
2026-06-15days on market $102,950 Active 77 DOM
-
2026-06-13days on market $102,950 Active 75 DOM
-
2026-06-10days on market $102,950 Active 73 DOM
-
2026-06-09days on market $102,950 Active 72 DOM
-
2026-06-08days on market $102,950 Active 71 DOM
-
2026-06-07days on market $102,950 Active 70 DOM
-
2026-06-03price $102,950 Active 65 DOM
-
2026-06-02days on market $105,555 Active 65 DOM
-
2026-06-01days on market $105,555 Active 64 DOM
-
2026-05-31days on market $105,555 Active 63 DOM
-
2026-05-13status Active
-
2026-05-01status Pending
-
2026-04-17price $105,555
-
2026-04-06price $106,900
-
2026-03-16$109,900 Active
ⓘ Source: listings_history table (triggers on properties + properties_extension) + one-shot
backfill from property_details.listing_events for pre-trigger history.
Tax reassessment forecast IN · Partial reset (capped growth)
- Current annual tax
- $1,552 · $129/mo
- Projected year-2 tax
- $1,552 · $129/mo
- Expected delta
- $0/yr ($0/mo · 0.0%)
ⓘ Screening estimate from a state-policy table — verify with the county assessor before closing.
Climate risk First Street
- Flood 6/10 Major FEMA zone X (unshaded) · 68% chance over 30 yrs
- Wildfire 1/10 Low
- Heat 3/10 Moderate 7 d/yr ≥101°F today · 17 d/yr by 30 yrs out
- Wind 2/10 Low
- Air quality 3/10 Moderate 2 unhealthy d/yr today · 3 by 30 yrs out
Nearby sold comps map
Loading sold comps map…
Walkable amenities ~0.75 mi
Loading nearby amenities…
Taxation est. · year 1
- Rental income
- $13,923
- − Mortgage interest
- −$5,767
- − Property taxes
- −$1,552
- − Insurance
- −$515
- − Repairs & maintenance
- −$1,114
- − Management
- −$1,114
- − Depreciation
- −$2,995
- Taxable income
- $867
- Est. tax owed @ 24.0%
- −$208
- After-tax cash flow
- $2,246/yr
For passive investors: Depreciation is non-cash, so a rental often shows a tax loss while cash-flowing — sheltering income. Rental losses are passive: they offset passive income freely, and up to $25,000/yr can offset ordinary (W-2) income if you actively participate and your MAGI is under $100k (phasing out to $0 by $150k); unused losses carry forward. On sale, claimed depreciation is recaptured at up to 25%, and gains may owe capital-gains tax (a 1031 exchange can defer both). Figures are a year-1 estimate at your 24.0% rate — not tax advice; consult a CPA.
Schools (NCES district)
- District
- Kokomo School Corporation
- NCES district ID
- 1805370
- Math proficiency
- 22% ▼ -8.00%
- Reading proficiency
- 30% ▼ -5.00%
- Median HH income
- $35,804
- Composite
- 21.5/100
- National rank
- #8325
- State rank
- #264 of 301 in IN
Livability — Kokomo
- Score
- 68/100
- State rank
- #227
- US rank
- #9912
Category grades
Schools grade is shown separately in the Schools card above.
Census & demographics
- Census place
- Kokomo, IN
- County
- Howard County · 75,099 people
- City population
- 75,099
- Metro
- Kokomo, IN
- Population (ZIP)
- 38,082
- Household income
- $60,495
- Rent vs Own
- Severe rent burden
- 1116.0
Population outlook (Howard County) Hauer SSP2
- Today (2025)
- 81,522 people
- By 2030
- 80,104 · -1.7%
- By 2040
- 76,708 · -5.9%
- By 2050
- 72,880 · -10.6%
- By 2075
- 64,016 · -21.5%
- By 2100
- 51,705 · -36.6%
Race, ethnicity, and origin ACS 2023
- Neighborhood character
- Predominantly White (83%)
- Race & ethnicity
- White 83% Black 9% Two or more races 5% Hispanic / Latino 4%
- Common ancestry
- Italian 2% Romanian 2% Slovak 1%
- Foreign-born
- 1% · Canada
- Languages at home
- 96% English-only · German/W. Germanic 1% Spanish 1%
Political lean MEDSL · Howard
- 2024 margin
- Solid R (+35.3) · D 31.4% · R 66.7% · Other 1.8%
- 2008→2024 swing
- -29.1pp toward R · 2008: -6.2pp · 2024: -35.3pp
- All cycles
- 2024: R+35.3 2020: R+32.4 2016: R+33.9 2012: R+14.3 2008: R+6.2
Not yet ingested
- Civics
- —
Market trends
- HPI YoY
- ▼ -78.40%
- Current HPI
- 242.2565
- Rent YoY
- ▼ -1.47%
- Metro
- Kokomo, IN
- State GDP YoY
- ▲ 2.90%
- F500 in state
- 18
Industry mix (Fortune 500 HQ in IN)
| Industry | F500 HQs | Revenue |
|---|---|---|
| Industrial Machinery | 2 | $37B |
|
||
| Healthcare | 1 | $177B |
|
||
| Pharmaceuticals | 1 | $45B |
|
||
| Metals / Steel | 1 | $18B |
|
||
| Agriculture | 1 | $17B |
|
||
| Packaging | 1 | $12B |
|
||
Price history
-4.0% since first listed5 events — show timeline
- 2026-05-13 Relisted — MIBOR as Distributed by MLS Grid
- 2026-05-01 Pending — MIBOR as Distributed by MLS Grid
- 2026-04-17 Price Changed $105,555 MIBOR as Distributed by MLS Grid
- 2026-04-06 Price Changed $106,900 MIBOR as Distributed by MLS Grid
- 2026-03-16 Listed $109,900 MIBOR as Distributed by MLS Grid
Property tax history
+3.4%/yrLatest (2024): $1,552 · +10.9% YoY. Source: county tax records.
Cash-flow waterfall
monthlySold comps — $/sqft
last 12 mo · ≤1 miLoading sold comps…