30901 State Route 20 Unit B3 · Oak Harbor, WA
Flood risk 1/10 · Minimal
- FEMA flood zone
- X (unshaded)
- Chance of flooding over 30 yrs
- 0.0%
- Est. flood insurance / yr
- $507 – $1,088
Fire risk 2/10 · Minimal
- Est. fire insurance / yr
- $604 – $1,122
Heat risk 2/10 · Minimal
- Hot days now (above 78°F)
- 7 days/yr
- Hot days in 30 yrs
- 19 days/yr
Wind risk 1/10 · Minimal
- Chance of severe wind over 30 yrs
- —
Air-quality risk 6/10 · Moderate
- Unhealthy air days now
- 7 days/yr
- Unhealthy air days in 30 yrs
- 8 days/yr
Risk factors via First Street. Map © Google.
Why this score? — see what drove the B- grade
The composite is a weighted blend of 9 inputs, each scored 0–100. Each bar is that input's sub-score; the figure is the points it added to the 100-point composite (weight × sub-score).
- Cash flow +30.0/30.0
- 1% rule +10.0/10.0
- DSCR +10.0/10.0
- Schools +4.9/10.0
- Livability +3.9/5.0
- Rent growth +3.8/5.0
- Condition / age +2.5/5.0
- ARV discount +0.0/15.0
- Appreciation +0.0/10.0
$89,900
🖨 Deal sheet 📄 Offer letter ✓ Due diligence
Listing remarks
Designed for ‘55 & better, ’ this home is just minutes from beaches, shops, & miles of protected waterfront trails. .. & a better value cannot be found in Oak Harbor! Experience the magic of salt-water & mountain views + unrivaled sun rises. With 1084 perfectly appointed square feet, highlights include: an open-concept floor-plan, 3 bedrooms spaced for privacy, 2 full baths, an open kitchen with adjacent breakfast nook & built-in storage. The living room is spacious & comfortable--complete with vaulted ceilings, picture windows & cozy pellet stove. More? A front deck with access ramp, a covered back porch overlooking a phenomenal city &am
Key facts
- Breakfast nook
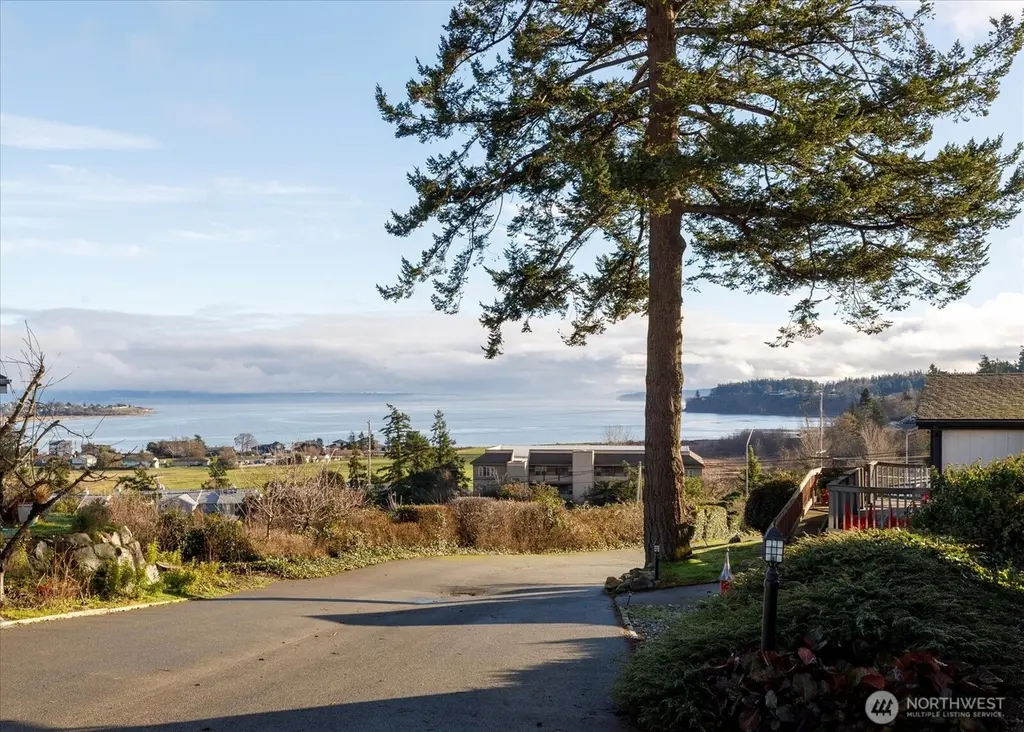
- Salt-water views
- Vaulted ceilings
Tags
Neighborhood map
What this means for you Summary
Snapshot
- This is a 3-bed/2.0-bath manufactured listed at $90k.
Deal economics
- At list price, monthly cash flow is $1k ($15k/yr) — positive.
- The deal already cash-flows at list — no discount required.
- Meets the 1% rule at list price ($2k rent vs $90k).
- Recommended offer: $79k (12.0% below list) — sets the bar for market timing.
- Cap rate 23.2% vs local median 2.7% in Oak Harbor — top-decile yield for the area; either an underpriced asset or a hidden risk that comps aren't pricing in. Stress-test before assuming the spread holds.
Location & tenants
- Location reads 77/100 on livability (#149 in WA, #3,120 nationally) — a middle-class / working-renter tenant base. Strengths: crime A+, health & safety A+, housing A; Watch: amenities D+, cost of living D+.
- Oak Harbor School District (town): math 49% / reading 61% proficiency, ranked #98 of 291 in WA (top 34%) — acceptable for families but not a draw, mixed tenant base, ~2y average lease.
- Market conditions: Rents rising fast (+5.4%/yr); 277 active listings in the ZIP; 12 comparable units currently listed for rent nearby; rentals lingering (median 44d on market — plan ~5-8 weeks vacancy on turnover, expect pricing pressure); 100% of comp listings sitting > 30 days — soft ceiling on asking rent; solid renter incomes; 402 units permitted in Island County in 2024 (54 in 5+ unit buildings).
- This rent runs 33% of the median local income ($83k/yr) — at the standard rent-burdened threshold; future hikes will face affordability resistance.
Forward outlook
- Local home prices are declining (-3.0%/yr); year-one equity from $622 of loan paydown is wiped out by about $3k of value loss. Plan a longer hold.
- Island County population projected to shrink 6% by 2050 — rents likely to lag national; underwrite the cash flow, not the appreciation.
- At projected returns (-3.0% appreciation + 5.4% rent growth), your $25k cash investment doubles in ~2 years — after that, you're playing with house money.
Negotiation context
- It's been on market 139 days — a 12% lower offer ($79k) is reasonable based on typical stale-listing flexibility.
- 2 sale attempts since 16y ago; this cycle's ask has dropped $85k (49%) from the opening price — seller is motivated, your offer sets the floor, not the list.
- Current owner paid $18k; list at $90k implies a 414% gain — meaningful room to come down on a strong offer.
Questions for the listing agent
- It's been on market 139 days. Have you received any prior offers? Is the seller open to a 12% concession, seller financing, or rate buy-down credit?
- Why hasn't it sold? Are there any deal-killer items the seller is aware of (foundation, flood, title, zoning, code violations)?
- Is there a deadline driving the sale (1031 exchange, divorce, estate, relocation)? That informs how much negotiation room exists.
- Schools are B-rated — typically a magnet for longer-tenancy family renters. What's the average tenant stay here, and is there a school-zone premium baked into asking?
- What's the average days-on-market for RENTAL listings here right now (not sales)? A rising rental-DOM trend means longer vacancies and softer asking-rent achievability than the comps imply.
- What's the recent tenant-quality profile in this submarket — average credit score on applications, eviction rate, late-payment / NSF rate, and stable-employment percentage? A property-management company in the area should have these aggregated.
- How much new for-sale + rental construction is in the pipeline within 1–3 miles? Heavy new supply typically softens prices + rents 12–24 months out; constrained supply supports both.
Investment metrics
- 1% rule
- 2.53% ✓
- Cap rate
- 23.19%
- Cash-on-cash
- 60.36%
- DSCR
- 3.69
- GRM
- 3.3
CMA / ARV
- ARV (median comp)
- $75,152
- List price
- $89,900
- Delta
- 19.62%
- Verdict
- OVERPRICED
- Comps
- 12 within 2.0 mi
Projected returns pro-forma
-3.0% appreciation · 5.36% rent growth · sell at horizon
- IRR
- 61.6%
- Equity multiple
- 3.84×
- Total profit
- $71,567
- Equity at exit
- $13,404
- IRR
- 67.0%
- Equity multiple
- 8.54×
- Total profit
- $189,829
- Equity at exit
- $7,773
Cash invested: $25,172 (down + closing). Projections, not guarantees.
Landlord ↔ Tenant lean methodology
- Overall (STATE)
- 28 Tenant-Leaning
- State Washington
- 28 Tenant-Leaning · D+8
- County
- — inherits STATE
- City
- — inherits STATE
ZIP-level market 98277
- Rents YoY
- 5.4%
- Active inventory
- 277
- Price-to-rent
- 3.3×
Monthly cashflow live
- Estimated rent
- $2,271 high interval (Pro) →
- Mortgage (P&I)
- −$471
- Tax from tax record
- −$19 /mo · $227/yr
- Insurance
- −$37
- HOA
- −$0
- Vacancy / Maint / Mgmt
- −$477
- Net cashflow
- $1,266
Break-even live
UW: 25.0% down · 7.5% · 30yr · 1.5% tax · 5.0% vac · 8.0% maint · 8.0% mgmt
Financing live
Cash to close
- Down payment
- $22,475
- Closing costs
- $2,697
- Reserves months
- —
- Total cash needed
- —
Loan-product check · same deal, 3 products live
Conventional
25% down · 7.5% · 30yr
- Down + closing
- —
- Monthly P&I
- —
- Monthly cashflow
- —
- DSCR
- —
- Eligible?
- —
Personal DTI + credit; lowest rate.
DSCR
20% down · 8.5% · 30yr
- Down + closing
- —
- Monthly P&I
- —
- Monthly cashflow
- —
- DSCR
- —
- Eligible?
- —
No personal income docs; deal must DSCR.
Hard money
10% down · 12.0% · 12mo
- Down + closing
- —
- Monthly P&I
- —
- Monthly cashflow
- —
- DSCR
- —
- Eligible?
- —
Short-term bridge; refi at stabilization.
Rent comps 12 comps
| Address | Beds | Baths | Sqft | Rent | $/sqft | DOM | Units | Dist |
|---|---|---|---|---|---|---|---|---|
| 30875 State Route 20 Unit M3 Oak Harbor, WA | 3.0 | 2.5 | 1437 | $2,415 | $1.68 | 43d | 1 | 0.06mi |
| 1651 SW Mulberry Pl Unit E101 Oak Harbor, WA | 3.0 | 2.0 | 1296 | $2,215 | $1.71 | 43d | 1 | 0.34mi |
| 1725 SW Nienhuis St Oak Harbor, WA | 3.0 | 2.0 | 1326 | $2,515 | $1.90 | 43d | 1 | 0.40mi |
| 141 SW 6th Ave Unit D101 Oak Harbor, WA | 2.0 | 1.5 | 982 | $1,915 | $1.95 | 43d | 1 | 0.62mi |
| 395 S Oak Harbor St Unit 207 [[?]165] Oak Harbor, WA | 2.0 | 1.5 | 1000 | $2,030 | $2.03 | 43d | 1 | 0.83mi |
| 1282 NW Lanyard Loop #2 Oak Harbor, WA | 3.0 | 2.5 | 1330 | $2,315 | $1.74 | 43d | 1 | 1.00mi |
| 1051 SE 8th Ave Unit C201 Oak Harbor, WA | 2.0 | 1.0 | 970 | $1,500 | $1.55 | 43d | 1 | 1.14mi |
| 300 N Oak Harbor St Unit B102 Oak Harbor, WA | 3.0 | 2.0 | 1284 | $2,015 | $1.57 | 43d | 1 | 1.20mi |
| 413 SE Maylor St Apt 202 Oak Harbor, WA | 2.0 | 1.0 | 884 | $1,650 | $1.87 | 43d | 1 | 1.33mi |
| 310 SE Midway Blvd Unit 207 Oak Harbor, WA | 2.0 | 1.0 | 791 | $1,640 | $2.07 | 43d | 1 | 1.36mi |
| 790 NW Dory Dr Oak Harbor, WA | 3.0 | 2.0 | 1344 | $2,415 | $1.80 | 43d | 1 | 1.47mi |
| 865 N Oak Harbor St Unit 203 Oak Harbor, WA | 2.0 | 1.0 | 750 | $1,565 | $2.09 | 43d | 1 | 1.47mi |
Listing history 19 events
-
2026-06-07statusdays on market $89,900 Pending 139 DOM
-
2026-06-03days on market $89,900 Active 138 DOM
-
2026-06-02days on market $89,900 Active 137 DOM
-
2026-06-01days on market $89,900 Active 136 DOM
-
2026-05-31price $89,900 Active 135 DOM
-
2026-05-31days on market $109,999 Active 135 DOM
-
2026-05-30days on market $109,999 Active 134 DOM
-
2026-05-11price $109,999
-
2026-03-31price $119,500
-
2026-03-19price $135,000
-
2026-03-11price $144,500
-
2026-02-09price $150,000
-
2026-01-16$175,000 Active
-
2010-08-12historical
-
2010-06-15soldstatus $17,500 Sold
-
2010-05-09status Pending Inspection
-
2010-05-03$19,950 Active
-
2002-06-30soldstatus $20,000
-
1998-03-01soldstatus $24,000
ⓘ Source: listings_history table (triggers on properties + properties_extension) + one-shot
backfill from property_details.listing_events for pre-trigger history.
Tax reassessment forecast WA · Resets to sale price
- Current annual tax
- $227 · $19/mo
- Projected year-2 tax
- $881 · $73/mo
- Expected delta
- +$654/yr (+$55/mo · 288.2%)
ⓘ Screening estimate from a state-policy table — verify with the county assessor before closing.
Climate risk First Street
- Flood 1/10 Low FEMA zone X (unshaded) · 0% chance over 30 yrs
- Wildfire 2/10 Low
- Heat 2/10 Low 7 d/yr ≥78°F today · 19 d/yr by 30 yrs out
- Wind 1/10 Low
- Air quality 6/10 Major 7 unhealthy d/yr today · 8 by 30 yrs out
Nearby sold comps map
Loading sold comps map…
Walkable amenities ~0.75 mi
Loading nearby amenities…
Taxation est. · year 1
- Rental income
- $27,249
- − Mortgage interest
- −$5,036
- − Property taxes
- −$227
- − Insurance
- −$450
- − Repairs & maintenance
- −$2,180
- − Management
- −$2,180
- − Depreciation
- −$2,615
- Taxable income
- $14,562
- Est. tax owed @ 24.0%
- −$3,495
- After-tax cash flow
- $11,698/yr
For passive investors: Depreciation is non-cash, so a rental often shows a tax loss while cash-flowing — sheltering income. Rental losses are passive: they offset passive income freely, and up to $25,000/yr can offset ordinary (W-2) income if you actively participate and your MAGI is under $100k (phasing out to $0 by $150k); unused losses carry forward. On sale, claimed depreciation is recaptured at up to 25%, and gains may owe capital-gains tax (a 1031 exchange can defer both). Figures are a year-1 estimate at your 24.0% rate — not tax advice; consult a CPA.
Schools (NCES district)
- District
- Oak Harbor School District
- NCES district ID
- 5305940
- Math proficiency
- 49% ▲ 1.00%
- Reading proficiency
- 61% ▲ 1.00%
- Median HH income
- $53,606
- Composite
- 49.07/100
- National rank
- #4427
- State rank
- #98 of 291 in WA
Livability — Oak Harbor
- Score
- 77/100
- State rank
- #149
- US rank
- #3120
Category grades
Schools grade is shown separately in the Schools card above.
Census & demographics
- Census place
- Oak Harbor, WA
- County
- Island County · 71,196 people
- City population
- 40,917
- Metro
- Oak Harbor, WA
- Population (ZIP)
- 40,917
- Household income
- $83,253
- Rent vs Own
- Severe rent burden
- 1359.0
Population outlook (Island County) Hauer SSP2
- Today (2025)
- 82,019 people
- By 2030
- 81,329 · -0.8%
- By 2040
- 78,552 · -4.2%
- By 2050
- 77,042 · -6.1%
- By 2075
- 80,799 · -1.5%
- By 2100
- 84,451 · +3.0%
Race, ethnicity, and origin ACS 2023
- Neighborhood character
- Predominantly White (66%)
- Race & ethnicity
- White 66% Two or more races 14% Hispanic / Latino 12% Asian 8% Black 4%
- Hispanic origin (detail)
- Mexican 9%
- Common ancestry
- Portuguese 4% Slovak 3% Iranian 3%
- Foreign-born
- 9% · Canada, Vietnam
- Languages at home
- 87% English-only · Spanish 5% Tagalog/Filipino 4% Other Asian/Pacific 1%
Political lean MEDSL · Island
- 2024 margin
- D (+16.6) · D 56.8% · R 40.3% · Other 2.9%
- 2008→2024 swing
- +10.3pp toward D · 2008: 6.2pp · 2024: 16.6pp
- All cycles
- 2024: D+16.6 2020: D+12.0 2016: D+5.9 2012: D+4.4 2008: D+6.2
Not yet ingested
- Civics
- —
Market trends
- HPI YoY
- ▼ -608.47%
- Current HPI
- 188.2874
- Rent YoY
- ▲ 5.36%
- Metro
- Oak Harbor, WA
- State GDP YoY
- ▲ 4.65%
- F500 in state
- 22
Industry mix (Fortune 500 HQ in WA)
| Industry | F500 HQs | Revenue |
|---|---|---|
| Retail | 2 | $269B |
|
||
| Technology / Retail | 1 | $638B |
|
||
| Technology | 1 | $245B |
|
||
| Telecommunications | 1 | $38B |
|
||
| Food / Beverage | 1 | $36B |
|
||
| Automotive / Trucks | 1 | $34B |
|
||
Price history
+358.3% since first listed12 events — show timeline
- 2026-05-11 Price Changed $109,999 NWMLS as Distributed by MLS Grid
- 2026-03-31 Price Changed $119,500 NWMLS as Distributed by MLS Grid
- 2026-03-19 Price Changed $135,000 NWMLS as Distributed by MLS Grid
- 2026-03-11 Price Changed $144,500 NWMLS as Distributed by MLS Grid
- 2026-02-09 Price Changed $150,000 NWMLS as Distributed by MLS Grid
- 2026-01-16 Listed $175,000 NWMLS as Distributed by MLS Grid
- 2010-08-12 Delisted — NWMLS as Distributed by MLS Grid
- 2010-06-15 Sold (MLS) $17,500 NWMLS as Distributed by MLS Grid
- 2010-05-09 Pending — NWMLS as Distributed by MLS Grid
- 2010-05-03 Listed $19,950 NWMLS as Distributed by MLS Grid
- 2002-06-30 Sold (Public Records) $20,000 Public Records
- 1998-03-01 Sold (Public Records) $24,000 Public Records
Property tax history
+3.2%/yrLatest (2026): $227 · +2.9% YoY. Source: county tax records.
Cash-flow waterfall
monthlySold comps — $/sqft
last 12 mo · ≤1 miLoading sold comps…