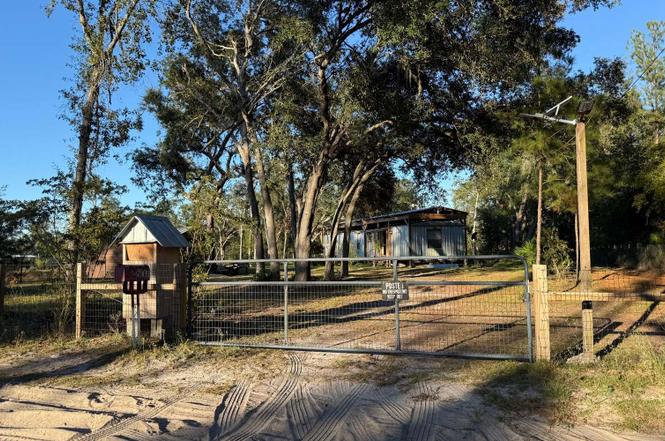
4607 NW 24th Ave · Lee, FL
Flood risk 1/10 · Minimal
- FEMA flood zone
- X (unshaded)
- Chance of flooding over 30 yrs
- 0.0%
- Est. flood insurance / yr
- $507 – $1,088
Fire risk 8/10 · Major
- Est. fire insurance / yr
- $947 – $1,759
Heat risk 8/10 · Major
- Hot days now (above 108°F)
- 7 days/yr
- Hot days in 30 yrs
- 18 days/yr
Wind risk 8/10 · Major
- Chance of severe wind over 30 yrs
- 99.0%
Air-quality risk 6/10 · Moderate
- Unhealthy air days now
- 11 days/yr
- Unhealthy air days in 30 yrs
- 11 days/yr
Risk factors via First Street. Map © Google.
Why this score? — see what drove the B grade
The composite is a weighted blend of 9 inputs, each scored 0–100. Each bar is that input's sub-score; the figure is the points it added to the 100-point composite (weight × sub-score).
- Cash flow +29.2/30.0
- DSCR +10.0/10.0
- Appreciation +8.3/10.0
- ARV discount +7.5/15.0
- 1% rule +7.1/10.0
- Livability +3.1/5.0
- Schools +2.6/10.0
- Rent growth +2.5/5.0
- Condition / age +2.5/5.0
$80,000
🖨 Deal sheet 📄 Offer letter ✓ Due diligence
Listing remarks
GREAT OPPORTUNITY TO MAKE IT YOUR OWN! SWMH 2/1 WITH A LITTLE OVER HALF ACRE LOT. NEEDS SOME TLC BUT HAS LOTS OF POTENTIAL.
Key facts
- 3 garage spots
- Built 1981
- Listed 238 days
Property features AI
Exterior
- Parking: 3-car garage
- Utilities: Private well water
- Home design: Manufactured home (residential)
- Construction: Metal siding
- Exterior features: Metal roof; Gravel road access; Shed(s) on property
Interior
- Kitchen: Electric cooktop; Refrigerator; Dishwasher not listed
- Flooring: Vinyl flooring
- Bathrooms: 1 full bathroom
- Interior features: Dryer; Electric cooktop; Refrigerator; Washer
- Laundry & utility: Washer and dryer included
Neighborhood map
What this means for you Summary
Snapshot
- This is a 3-bed/1.0-bath manufactured listed at $80k.
Deal economics
- At list price, monthly cash flow is $278 ($3k/yr) — positive.
- The deal already cash-flows at list — no discount required.
- Meets the 1% rule at list price ($965 rent vs $80k).
- Recommended offer: $70k (12.0% below list) — sets the bar for market timing.
- Cap rate 10.5% vs local median 2.8% in Lee — top-decile yield for the area; either an underpriced asset or a hidden risk that comps aren't pricing in. Stress-test before assuming the spread holds.
Location & tenants
- Location reads 61/100 on livability (#771 in FL) — a middle-class / working-renter tenant base. Strengths: cost of living A+, housing A; Watch: crime D, health & safety D, amenities F.
- Hamilton (rural): math 34% / reading 29% proficiency, ranked #68 of 73 in FL (top 93%) — families likely to look elsewhere, expect single-tenant / working-renter base with shorter leases; 72% free/reduced lunch — lower-income household profile, screen leases tightly.
- Market conditions: 85 active listings in the ZIP; 26 units permitted in Hamilton County in 2024 (0 in 5+ unit buildings).
Forward outlook
- In year one you build about $6k of equity ($553 loan paydown + $5k appreciation (6.7% local appreciation)).
- Hamilton County population projected at -12% by 2050 — secular population decline; favor cash flow + early exit over multi-decade hold.
- At projected returns (6.7% appreciation + 3.0% rent growth), your $22k cash investment doubles in ~3 years — after that, you're playing with house money.
- By year 6, paydown + projected appreciation supports a ~$33k cash-out refi (75% LTV) — recoverable capital for the next deal without selling this one.
Negotiation context
- It's been on market 239 days — a 12% lower offer ($70k) is reasonable based on typical stale-listing flexibility.
Risks & watch-outs
- Climate carrying-cost: severe wind risk, 99% chance of damaging wind over 30y; severe wildfire risk; extreme-heat days projected 7→18/yr by 2055 (HVAC capex compounding) — expect insurance premiums to compound above CPI over the hold.
Questions for the listing agent
- It's been on market 239 days. Have you received any prior offers? Is the seller open to a 12% concession, seller financing, or rate buy-down credit?
- Why hasn't it sold? Are there any deal-killer items the seller is aware of (foundation, flood, title, zoning, code violations)?
- Is there a deadline driving the sale (1031 exchange, divorce, estate, relocation)? That informs how much negotiation room exists.
- Crime grade is D in this area — have there been break-ins, vandalism, or insurance claims at this property in the last 3 years? What carrier currently insures it and at what premium?
- What's the average days-on-market for RENTAL listings here right now (not sales)? A rising rental-DOM trend means longer vacancies and softer asking-rent achievability than the comps imply.
- What's the recent tenant-quality profile in this submarket — average credit score on applications, eviction rate, late-payment / NSF rate, and stable-employment percentage? A property-management company in the area should have these aggregated.
- How much new for-sale + rental construction is in the pipeline within 1–3 miles? Heavy new supply typically softens prices + rents 12–24 months out; constrained supply supports both.
Investment metrics
- 1% rule
- 1.21% ✓
- Cap rate
- 10.47%
- Cash-on-cash
- 14.91%
- DSCR
- 1.66
- GRM
- 6.9
CMA / ARV
No comps found within radius.
Projected returns pro-forma
6.69% appreciation · 3.0% rent growth · sell at horizon
- IRR
- 29.1%
- Equity multiple
- 2.97×
- Total profit
- $44,107
- Equity at exit
- $53,808
- IRR
- 26.7%
- Equity multiple
- 6.14×
- Total profit
- $115,066
- Equity at exit
- $100,769
Cash invested: $22,400 (down + closing). Projections, not guarantees.
Landlord ↔ Tenant lean methodology
- Overall (STATE)
- 87 Strongly Landlord-Friendly
- State Florida
- 87 Strongly Landlord-Friendly · R+3
- County
- — inherits STATE
- City
- — inherits STATE
ZIP-level market 32052
- Home prices YoY
- 2.2%
- Active inventory
- 85
- Price-to-rent
- 6.9×
Monthly cashflow live
- Estimated rent
- $965 medium interval (Pro) →
- Mortgage (P&I)
- −$420
- Tax from tax record
- −$31 /mo · $370/yr
- Insurance
- −$33
- HOA
- −$0
- Vacancy / Maint / Mgmt
- −$203
- Net cashflow
- $278
Break-even live
UW: 25.0% down · 7.5% · 30yr · 1.5% tax · 5.0% vac · 8.0% maint · 8.0% mgmt
Financing live
Cash to close
- Down payment
- $20,000
- Closing costs
- $2,400
- Reserves months
- —
- Total cash needed
- —
Loan-product check · same deal, 3 products live
Conventional
25% down · 7.5% · 30yr
- Down + closing
- —
- Monthly P&I
- —
- Monthly cashflow
- —
- DSCR
- —
- Eligible?
- —
Personal DTI + credit; lowest rate.
DSCR
20% down · 8.5% · 30yr
- Down + closing
- —
- Monthly P&I
- —
- Monthly cashflow
- —
- DSCR
- —
- Eligible?
- —
No personal income docs; deal must DSCR.
Hard money
10% down · 12.0% · 12mo
- Down + closing
- —
- Monthly P&I
- —
- Monthly cashflow
- —
- DSCR
- —
- Eligible?
- —
Short-term bridge; refi at stabilization.
Listing history 18 events
-
2026-06-19days on market $80,000 Active 239 DOM
-
2026-06-18days on market $80,000 Active 238 DOM
-
2026-06-17days on market $80,000 Active 237 DOM
-
2026-06-16days on market $80,000 Active 236 DOM
-
2026-06-15days on market $80,000 Active 235 DOM
-
2026-06-14days on market $80,000 Active 233 DOM
-
2026-06-13days on market $80,000 Active 232 DOM
-
2026-06-10days on market $80,000 Active 230 DOM
-
2026-06-09days on market $80,000 Active 229 DOM
-
2026-06-08days on market $80,000 Active 228 DOM
-
2026-06-07days on market $80,000 Active 227 DOM
-
2026-06-05days on market $80,000 Active 224 DOM
-
2026-06-02days on market $80,000 Active 222 DOM
-
2026-06-01days on market $80,000 Active 221 DOM
-
2026-05-31days on market $80,000 Active 220 DOM
-
2026-05-30days on market $80,000 Active 219 DOM
-
2026-03-02price $80,000
-
2025-10-23$89,900 Active
ⓘ Source: listings_history table (triggers on properties + properties_extension) + one-shot
backfill from property_details.listing_events for pre-trigger history.
Tax reassessment forecast FL · Resets to sale price
- Current annual tax
- $370 · $31/mo
- Projected year-2 tax
- $664 · $55/mo
- Expected delta
- +$294/yr (+$25/mo · 79.6%)
ⓘ Screening estimate from a state-policy table — verify with the county assessor before closing.
Climate risk First Street
- Flood 1/10 Low FEMA zone X (unshaded) · 0% chance over 30 yrs
- Wildfire 8/10 Severe
- Heat 8/10 Severe 7 d/yr ≥108°F today · 18 d/yr by 30 yrs out
- Wind 8/10 Severe 99% chance of damaging wind over 30 yrs
- Air quality 6/10 Major 11 unhealthy d/yr today · 11 by 30 yrs out
Nearby sold comps map
Loading sold comps map…
Walkable amenities ~0.75 mi
Loading nearby amenities…
Taxation est. · year 1
- Rental income
- $11,576
- − Mortgage interest
- −$4,481
- − Property taxes
- −$370
- − Insurance
- −$400
- − Repairs & maintenance
- −$926
- − Management
- −$926
- − Depreciation
- −$2,327
- Taxable income
- $2,145
- Est. tax owed @ 24.0%
- −$515
- After-tax cash flow
- $2,826/yr
For passive investors: Depreciation is non-cash, so a rental often shows a tax loss while cash-flowing — sheltering income. Rental losses are passive: they offset passive income freely, and up to $25,000/yr can offset ordinary (W-2) income if you actively participate and your MAGI is under $100k (phasing out to $0 by $150k); unused losses carry forward. On sale, claimed depreciation is recaptured at up to 25%, and gains may owe capital-gains tax (a 1031 exchange can defer both). Figures are a year-1 estimate at your 24.0% rate — not tax advice; consult a CPA.
Schools (NCES district)
- District
- Hamilton
- NCES district ID
- 1200720
- Math proficiency
- 34% ▼ -8.00%
- Reading proficiency
- 29% ▼ -6.00%
- Median HH income
- $36,461
- Composite
- 26.18/100
- National rank
- #7267
- State rank
- #68 of 73 in FL
Livability — Lee
- Score
- 61/100
- State rank
- #771
- US rank
- #17387
Category grades
Schools grade is shown separately in the Schools card above.
Census & demographics
- Population (ZIP)
- 8,073
Population outlook (Hamilton County) Hauer SSP2
- Today (2025)
- 13,405 people
- By 2030
- 13,031 · -2.8%
- By 2040
- 12,385 · -7.6%
- By 2050
- 11,740 · -12.4%
- By 2075
- 9,347 · -30.3%
- By 2100
- 6,344 · -52.7%
Race, ethnicity, and origin ACS 2023
- Neighborhood character
- Diverse neighborhood (Simpson 0.58)
- Race & ethnicity
- White 55% Black 33% Hispanic / Latino 8% Two or more races 4%
- Hispanic origin (detail)
- Puerto Rican 2% Cuban 4%
- Common ancestry
- Romanian 2% Italian 1% Serbian 1%
- Foreign-born
- 5% · Canada
- Languages at home
- 88% English-only · Spanish 8% Russian/Polish/Slavic 2%
Political lean MEDSL · Hamilton
- 2024 margin
- Solid R (+39.0) · D 30.1% · R 69.1%
- 2008→2024 swing
- -24.4pp toward R · 2008: -14.6pp · 2024: -39.0pp
- All cycles
- 2024: R+39.0 2020: R+31.8 2016: R+28.2 2012: R+16.9 2008: R+14.6
Not yet ingested
- Civics
- —
Market trends
- HPI YoY
- ▲ 6.69%
- Current HPI
- 316.4797
- Rent YoY
- —
- Metro
- —
- State GDP YoY
- ▲ 3.28%
- F500 in state
- 36
Industry mix (Fortune 500 HQ in FL)
| Industry | F500 HQs | Revenue |
|---|---|---|
| Industrial Technology | 2 | $29B |
|
||
| Insurance | 2 | $17B |
|
||
| Retail | 1 | $60B |
|
||
| Technology Distribution | 1 | $58B |
|
||
| Homebuilding | 1 | $35B |
|
||
| Technology Manufacturing | 1 | $35B |
|
||
Price history
-11.0% since first listed2 events — show timeline
- 2026-03-02 Price Changed $80,000 NFMLS
- 2025-10-23 Listed $89,900 NFMLS
Property tax history
+6.6%/yrLatest (2025): $370 · +3.6% YoY. Source: county tax records.
Cash-flow waterfall
monthlySold comps — $/sqft
last 12 mo · ≤1 miLoading sold comps…