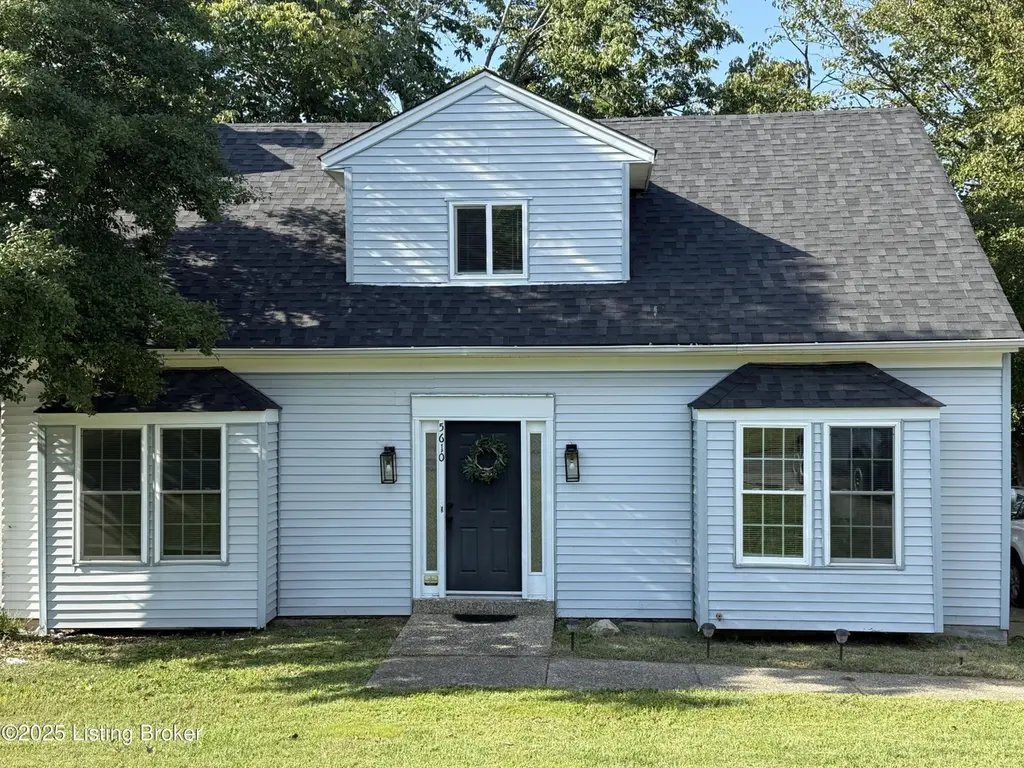
5610 Windy Willow Dr · Louisville/Jefferson County metro government (balance), KY
Flood risk No data
- FEMA flood zone
- —
- Chance of flooding over 30 yrs
- —
- Est. flood insurance / yr
- —
Fire risk No data
- Est. fire insurance / yr
- —
Heat risk No data
- Hot days now (above threshold)
- —
- Hot days in 30 yrs
- —
Wind risk No data
- Chance of severe wind over 30 yrs
- —
Air-quality risk No data
- Unhealthy air days now
- —
- Unhealthy air days in 30 yrs
- —
Risk factors via First Street. Map © Google.
Why this score? — see what drove the D grade
The composite is a weighted blend of 9 inputs, each scored 0–100. Each bar is that input's sub-score; the figure is the points it added to the 100-point composite (weight × sub-score).
- Cash flow +12.4/30.0
- ARV discount +10.7/15.0
- Schools +4.7/10.0
- DSCR +3.7/10.0
- Rent growth +3.3/5.0
- 1% rule +3.2/10.0
- Livability +2.5/5.0
- Condition / age +2.5/5.0
- Appreciation +0.0/10.0
$259,900
🖨 Deal sheet (PDF) 📄 Offer letter ✓ Due diligence
Listing remarks MLS
Updated four bedroom in Windy Willow Subdivision. This house is located in OLDHAM COUNTY, but is so close to Jefferson County it has a Louisville address. Vinyl plank flooring throughout the first level. Updated kitchen with modern cabinets and countertops! The sliding glass doors lead to the spacious deck. First floor also hosts the living room with fireplace, primary bedroom and full bathroom. Laundry is on the first level as well. Second floor bedrooms are carpeted and offer ample closet space. There is a full bath on the second floor. The proximity to Louisville, yet luxury of being in Oldham County, is too great to miss with this one!
Key facts
- Modern cabinets
- Storage shed
- Huge deck
Tags
Property features AI
Finance
- Other: Directions: Highway 22 to Windy Willow Drive
- HOA & community: No association fee
Exterior
- Parking: Driveway
- Utilities: Electricity connected
- Home design: Single-family residence; Traditional style; Two stories
- Construction: Built in 2000; Vinyl siding; Shingle roof; Crawl space foundation
- Exterior features: Partial wood fencing; Located on a cul-de-sac; Lot approximately 0.2 acres
Interior
- Kitchen: Kitchen on the first floor
- Bedrooms: Four bedrooms total; Primary bedroom on the first floor; Three additional bedrooms on the second floor
- Bathrooms: Two full bathrooms
- Heating & cooling: Forced air heating; Central air conditioning; One HVAC unit
- Interior features: Seven total rooms; No basement; Living room on the first floor
- Laundry & utility: Laundry on the first floor
Neighborhood map
What this means for you Summary
Snapshot
- This is a 4-bed/2.0-bath single-family listed at $260k.
Deal economics
- At list price, monthly cash flow is $-44 ($-522/yr) — negative.
- To cash-flow at today's rent, offer at most $252k (3.0% below list).
- To meet the 1% rule (rent ≥ 1% of price), the offer needs to be $213k (18.1% below list).
- Recommended offer: $213k (18.1% below list) — sets the bar for 1% rule.
- Cap rate 6.1% vs local median 4.0% in Louisville/Jefferson County metro government (balance) — top-decile yield for the area; either an underpriced asset or a hidden risk that comps aren't pricing in. Stress-test before assuming the spread holds.
Location & tenants
- Location reads: area grade D — affects rentability + tenant quality, not the cash-flow math above.
- Oldham County (suburban): math 48% / reading 55% proficiency, ranked #6 of 165 in KY (top 4%) — acceptable for families but not a draw, mixed tenant base, ~2y average lease; only 16% free/reduced lunch — higher-income household profile.
- Market conditions: Rents rising (+3.1%/yr); 108 active listings in the ZIP; 18 comparable units currently listed for rent nearby; rentals at typical pace (median 16d on market — plan ~3-4 weeks tenant-placement turnaround); solid renter incomes; 402 units permitted in Oldham County in 2024 (56 in 5+ unit buildings).
Forward outlook
- Local home prices are declining (-3.0%/yr); year-one equity from $2k of loan paydown is wiped out by about $8k of value loss. Plan a longer hold.
- Oldham County population projected at +32% by 2050 — long-run rental-demand tailwind backs the buy-and-hold thesis.
Negotiation context
- Only 2 days on market — expect competitive offers; lowballing is unlikely to land.
- 6 sale attempts since 27y ago with the ask held roughly flat each time — persistent listings suggest the price (not the market) is what's stuck; bring a comps-based counter.
Questions for the listing agent
- What do current leases actually rent for vs. the listed asking? Can we see a recent rent roll and the last 12 months of T-12 income?
- Is there a deadline driving the sale (1031 exchange, divorce, estate, relocation)? That informs how much negotiation room exists.
- The area grade is low — what's the realistic commute time and amenity access for the typical tenant pool here? Any planned neighborhood developments (good or bad) we should know about?
- What's the average days-on-market for RENTAL listings here right now (not sales)? A rising rental-DOM trend means longer vacancies and softer asking-rent achievability than the comps imply.
- What's the recent tenant-quality profile in this submarket — average credit score on applications, eviction rate, late-payment / NSF rate, and stable-employment percentage? A property-management company in the area should have these aggregated.
- How much new for-sale + rental construction is in the pipeline within 1–3 miles? Heavy new supply typically softens prices + rents 12–24 months out; constrained supply supports both.
Investment metrics
- 1% rule
- 0.82% ✗
- Cap rate
- 6.09%
- Cash-on-cash
- -0.72%
- DSCR
- 0.97
- GRM
- 10.2
CMA / ARV
- ARV (on-the-fly)
- $280,000
- Comps found
- 12
Show comp detail 12 sales within ~0.75 mi
| Address | Dist | Beds/Ba | Sqft | Sold | Price | $/sf | Match |
|---|---|---|---|---|---|---|---|
| 7201 Autumn Bent Way | 0.48mi | 4/2.0 | 1,586 (-1%) | 1mo | $328,000 | $207 | 76 |
| 5113 Baywood Dr | 0.46mi | 3/1.5 (-1) | 1,548 (-3%) | 12mo | $172,500 | $111 | 56 |
| 11304 Deham Dr | 0.16mi | 3/1.0 (-1) | 1,393 (-13%) | 11mo | $206,900 | $149 | 53 |
| 9318 Plumwood Pl | 0.51mi | 3/1.0 (-1) | 1,480 (-8%) | 7mo | $260,000 | $176 | 49 |
| 7431 W Orchard Grass Blvd | 0.73mi | 4/1.5 | 1,500 (-6%) | 10mo | $285,000 | $190 | 45 |
| 12119 Stroll Ct | 0.72mi | 3/2.5 (-1) | 1,703 (+6%) | 5mo | $320,000 | $188 | 44 |
| 7407 Autumn Bent Way | 0.72mi | 3/2.0 (-1) | 1,650 (+3%) | 15mo | $289,000 | $175 | 44 |
| 12004 Wide Spring Ct | 0.64mi | 3/2.0 (-1) | 1,532 (-4%) | 18mo | $253,000 | $165 | 43 |
| 5202 Baywood Dr | 0.43mi | 3/1.5 (-1) | 1,400 (-12%) | 12mo | $265,000 | $189 | 42 |
| 9313 Plumwood Pl | 0.51mi | 3/2.5 (-1) | 1,826 (+14%) | 11mo | $310,000 | $170 | 36 |
| 9308 Plumwood Pl | 0.56mi | 4/2.0 | 1,806 (+13%) | 20mo | $275,000 | $152 | 36 |
| 7402 Autumn Bent Way | 0.68mi | 3/2.0 (-1) | 1,800 (+12%) | 17mo | $290,000 | $161 | 28 |
Match score weights: distance 35% · size 25% · config 20% · recency 20%. Top-matched comps best support the ARV.
Projected returns pro-forma
-3.0% appreciation · 3.14% rent growth · sell at horizon
- IRR
- -17.3%
- Equity multiple
- 0.39×
- Total profit
- $-44,599
- Equity at exit
- $38,752
- IRR
- -9.1%
- Equity multiple
- 0.43×
- Total profit
- $-41,216
- Equity at exit
- $22,471
Cash invested: $72,772 (down + closing). Projections, not guarantees.
Landlord ↔ Tenant lean methodology
- Overall (STATE)
- 83 Strongly Landlord-Friendly
- State Kentucky
- 83 Strongly Landlord-Friendly · R+16
- County
- — inherits STATE
- City
- — inherits STATE
ZIP-level market 40241
- Rents YoY
- 3.1%
- Active inventory
- 108
- Price-to-rent
- 10.2×
Monthly cashflow live
- Estimated rent
- $2,129 high interval (Pro) →
- Mortgage (P&I)
- −$1,363
- Tax from tax record
- −$254 /mo · $3,052/yr
- Insurance
- −$108
- HOA
- −$0
- Vacancy / Maint / Mgmt
- −$447
- Net cashflow
- $-44
Break-even live
Sensitivity live
| Price | -10% $104 | -5% $30 | +0% $-44 | +5% $-117 | +10% $-191 |
|---|---|---|---|---|---|
| Rent | -10% $-212 | -5% $-128 | +0% $-44 | +5% $41 | +10% $125 |
| Rate | -1.0pp $87 | -0.5pp $23 | base $-44 | +0.5pp $-111 | +1.0pp $-179 |
UW: 25.0% down · 7.5% · 30yr · 1.5% tax · 5.0% vac · 8.0% maint · 8.0% mgmt
Financing live
Cash to close
- Down payment
- $64,975
- Closing costs
- $7,797
- Reserves months
- —
- Total cash needed
- —
Loan-product check · same deal, 3 products live
Conventional
25% down · 7.5% · 30yr
- Down + closing
- —
- Monthly P&I
- —
- Monthly cashflow
- —
- DSCR
- —
- Eligible?
- —
Personal DTI + credit; lowest rate.
DSCR
20% down · 8.5% · 30yr
- Down + closing
- —
- Monthly P&I
- —
- Monthly cashflow
- —
- DSCR
- —
- Eligible?
- —
No personal income docs; deal must DSCR.
Hard money
10% down · 12.0% · 12mo
- Down + closing
- —
- Monthly P&I
- —
- Monthly cashflow
- —
- DSCR
- —
- Eligible?
- —
Short-term bridge; refi at stabilization.
Rent comps 18 comps
| Address | Beds | Baths | Sqft | Rent | $/sqft | DOM | Units | Dist |
|---|---|---|---|---|---|---|---|---|
| 5610 Haunz Ln Louisville, KY | 3.0 | 2.0 | 1856 | $2,275 | $1.23 | 44d | 1 | 0.27mi |
| 5209 Fisherman Ct Louisville, KY | 3.0 | 1.0 | 2000 | $2,650 | $1.32 | 2d | 1 | 0.37mi |
| 4709 Oak Pointe Dr Louisville, KY | 3.0 | 2.0 | 1755 | $2,425 | $1.38 | 4d | 1 | 0.74mi |
| 5004 Winding Spring Pl Louisville, KY | 3.0 | 1.0 | 1056 | $1,499 | $1.42 | 11d | 1 | 0.84mi |
| 5004 Winding Spring Pl Louisville, KY | 3.0 | 1.0 | 1056 | $1,499 | $1.42 | 2d | 1 | 0.84mi |
| 4957 Winding Spring Cir Louisville, KY | 3.0 | 2.5 | 1827 | $1,795 | $0.98 | 2d | 1 | 0.91mi |
| 8801 W State Highway 22 Unit 8803-1 Crestwood, KY | 3.0 | 2.0 | 1150 | $1,400 | $1.22 | 44d | 1 | 0.98mi |
| 5229 Craigs Creek Dr Louisville, KY | 3.0 | 2.0 | 2202 | $2,500 | $1.14 | 17d | 1 | 1.03mi |
| 10904 Sweet Water Dr Louisville, KY | 3.0 | 2.0 | 1680 | $1,100 | $0.65 | 18d | 1 | 1.21mi |
| 4605 Pulaski Ct Louisville, KY | 3.0 | 2.0 | 1111 | $2,100 | $1.89 | 24d | 1 | 1.24mi |
| 5001 Middlesex Dr Louisville, KY | 3.0 | 2.5 | 1894 | $2,400 | $1.27 | 15d | 1 | 1.26mi |
| 4314 Arwine Ct Louisville, KY | 3.0 | 2.5 | 1640 | $2,385 | $1.45 | 3d | 1 | 1.32mi |
| 4519 Accomack Dr Louisville, KY | 4.0 | 2.0 | 1849 | $2,325 | $1.26 | 17d | 1 | 1.37mi |
| 12105 E Bay Ct Worthington Hills, KY | 3.0 | 2.0 | 1695 | $2,000 | $1.18 | 4d | 1 | 1.38mi |
| 11403 Tazwell Dr Louisville, KY | 3.0 | 3.0 | 1740 | $2,200 | $1.26 | 17d | 1 | 1.43mi |
| 11353 N Tazwell Dr Louisville, KY | 1.0–3.0 | 1.0–2.5 | 1366 | $1,850 | $1.35 | 2d | 29 | 1.43mi |
| 12207 Hideaway Ct #0 Worthington Hills, KY | 3.0 | 1.5 | 1150 | $1,850 | $1.61 | 24d | 1 | 1.44mi |
| 4500 Westport Woods Ln Unit 4500-204 Louisville, KY | 3.0 | 2.0 | 1216 | $1,425 | $1.17 | 11d | 1 | 1.44mi |
Listing history 4 events
-
2026-06-16status $259,900 Pending 2 DOM
-
2026-06-15days on market $259,900 Active 2 DOM
-
2026-06-13remarks 693-char remark
-
2026-06-13$259,900 Active 1 DOM
ⓘ Source: listings_history table (triggers on properties + properties_extension) + one-shot
backfill from property_details.listing_events for pre-trigger history.
Tax reassessment forecast KY · Resets to sale price
- Current annual tax
- $3,052 · $254/mo
- Projected year-2 tax
- $3,052 · $254/mo
- Expected delta
- $0/yr ($0/mo · 0.0%)
ⓘ Screening estimate from a state-policy table — verify with the county assessor before closing.
Nearby sold comps map
Loading sold comps map…
Walkable amenities ~0.75 mi
Loading nearby amenities…
Taxation est. · year 1
- Rental income
- $25,550
- − Mortgage interest
- −$14,558
- − Property taxes
- −$3,052
- − Insurance
- −$1,300
- − Repairs & maintenance
- −$2,044
- − Management
- −$2,044
- − Depreciation
- −$7,561
- Taxable loss
- −$5,009
- Est. tax savings @ 24.0%
- +$1,202
- After-tax cash flow
- $680/yr
For passive investors: Depreciation is non-cash, so a rental often shows a tax loss while cash-flowing — sheltering income. Rental losses are passive: they offset passive income freely, and up to $25,000/yr can offset ordinary (W-2) income if you actively participate and your MAGI is under $100k (phasing out to $0 by $150k); unused losses carry forward. On sale, claimed depreciation is recaptured at up to 25%, and gains may owe capital-gains tax (a 1031 exchange can defer both). Figures are a year-1 estimate at your 24.0% rate — not tax advice; consult a CPA.
Schools (NCES district)
- District
- Oldham County
- NCES district ID
- 2104530
- Math proficiency
- 48% ▼ -15.00%
- Reading proficiency
- 55% ▼ -14.00%
- Median HH income
- $84,329
- Composite
- 47.29/100
- National rank
- #2303
- State rank
- #6 of 165 in KY
Livability — Louisville/Jefferson County metro government (balance)
No livability data for this city. (Only ~50 U.S. cities are tracked.)
Census & demographics
- County
- Jefferson County · 790,184 people
- City population
- 419,741
- Metro
- Louisville/Jefferson County, KY-IN
- Population (ZIP)
- 30,696
- Household income
- $94,078
- Rent vs Own
- Severe rent burden
- 748.0
Population outlook (Oldham County) Hauer SSP2
- Today (2025)
- 75,661 people
- By 2030
- 80,948 · +7.0%
- By 2040
- 90,894 · +20.1%
- By 2050
- 100,168 · +32.4%
- By 2075
- 123,605 · +63.4%
- By 2100
- 133,523 · +76.5%
Race, ethnicity, and origin ACS 2023
- Neighborhood character
- Predominantly White (72%)
- Race & ethnicity
- White 72% Black 10% Two or more races 8% Hispanic / Latino 7% Asian 6%
- Hispanic origin (detail)
- Mexican 3%
- Common ancestry
- Italian 3% Slovak 2% Romanian 2%
- Foreign-born
- 12% · Canada, China, South Korea
- Languages at home
- 86% English-only · Spanish 5% Other Indo-European 2% Russian/Polish/Slavic 2%
Political lean MEDSL · Oldham
- 2024 margin
- Strong R (+22.6) · D 37.7% · R 60.3% · Other 2.0%
- 2008→2024 swing
- +8.1pp toward D · 2008: -30.7pp · 2024: -22.6pp
- All cycles
- 2024: R+22.6 2020: R+21.4 2016: R+31.1 2012: R+36.6 2008: R+30.7
Not yet ingested
- Civics
- —
Market trends
- HPI YoY
- ▼ -189.34%
- Current HPI
- 226.0049
- Rent YoY
- ▲ 3.14%
- Metro
- Louisville/Jefferson County, KY-IN
- State GDP YoY
- ▲ 1.81%
- F500 in state
- 4
Industry mix (Fortune 500 HQ in KY)
| Industry | F500 HQs | Revenue |
|---|---|---|
| Healthcare | 1 | $118B |
|
||
| Food / Beverage | 1 | $7B |
|
||
Price history
+161.2% since first listed16 events — show timeline
- 2026-06-12 Listed $259,900 Metro Search MLS
- 2023-07-12 Sold (Public Records) $230,000 Public Records
- 2023-07-10 Pending — Metro Search MLS
- 2023-07-10 Sold (MLS) $230,000 Metro Search MLS
- 2023-05-24 Contingent — Metro Search MLS
- 2023-05-22 Relisted — Metro Search MLS
- 2023-04-19 Listing Removed — Metro Search MLS
- 2023-04-16 Contingent — Metro Search MLS
- 2023-04-04 Listed $229,000 Metro Search MLS
- 2021-03-15 Sold (Public Records) $61,000 Public Records
- 2002-12-06 Sold (MLS) $102,000 Metro Search MLS
- 2002-10-18 Listed $109,900 Metro Search MLS
- 2002-10-18 Listing Removed — Metro Search MLS
- 2002-05-25 Listed $115,900 Metro Search MLS
- 1999-12-17 Sold (MLS) $95,000 Metro Search MLS
- 1999-08-25 Listed $99,500 Metro Search MLS
Property tax history
+7.8%/yrLatest (2025): $3,052 · -0.2% YoY. Source: county tax records.
Cash-flow waterfall
monthlySold comps — $/sqft
last 12 mo · ≤1 miLoading sold comps…