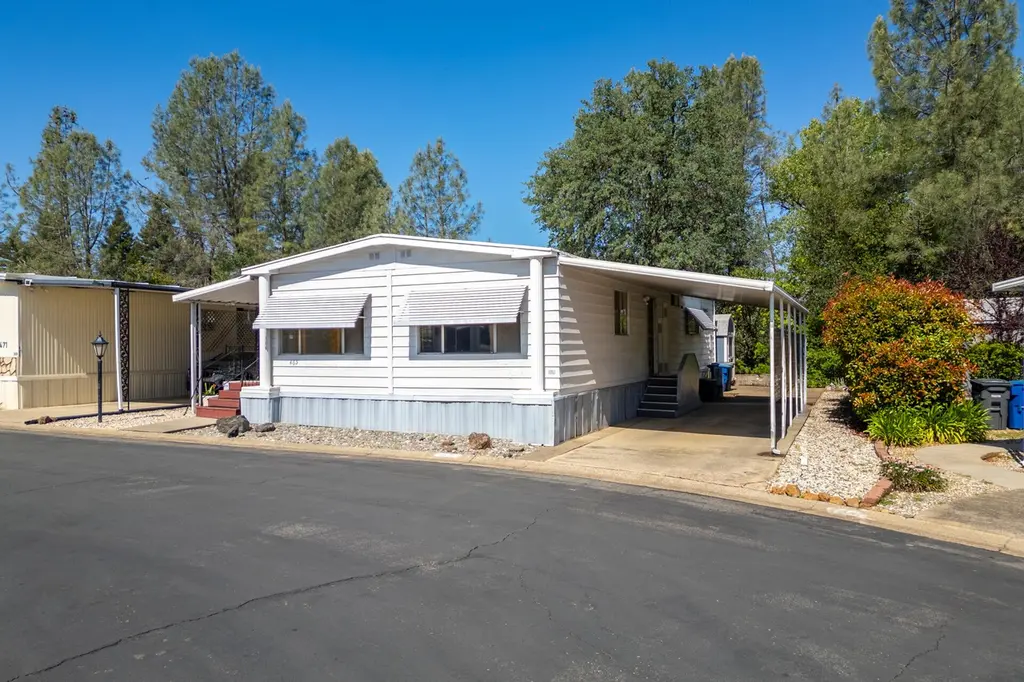
465 Silkwood Dr #10 · Redding, CA
Flood risk 1/10 · Minimal
- FEMA flood zone
- X (unshaded)
- Chance of flooding over 30 yrs
- 0.0%
- Est. flood insurance / yr
- $507 – $1,088
Fire risk 7/10 · Major
- Est. fire insurance / yr
- $659 – $1,223
Heat risk 8/10 · Major
- Hot days now (above 106°F)
- 7 days/yr
- Hot days in 30 yrs
- 16 days/yr
Wind risk 1/10 · Minimal
- Chance of severe wind over 30 yrs
- —
Air-quality risk 10/10 · Severe
- Unhealthy air days now
- 37 days/yr
- Unhealthy air days in 30 yrs
- 40 days/yr
Risk factors via First Street. Map © Google.
Why this score? — see what drove the B+ grade
The composite is a weighted blend of 9 inputs, each scored 0–100. Each bar is that input's sub-score; the figure is the points it added to the 100-point composite (weight × sub-score).
- Cash flow +30.0/30.0
- ARV discount +15.0/15.0
- 1% rule +10.0/10.0
- DSCR +10.0/10.0
- Rent growth +4.0/5.0
- Livability +3.8/5.0
- Schools +2.5/10.0
- Condition / age +2.2/5.0
- Appreciation +0.0/10.0
$57,000
🖨 Deal sheet 📄 Offer letter ✓ Due diligence
Listing remarks MLS
Tucked away in the desirable Redwoods Mobile Home Park, this 2 bedroom, 2 bathroom home offers comfortable living in a welcoming 55+ community. The property features low-maintenance landscaping, making it easy to enjoy your surroundings without extensive upkeep. A large covered patio provides a great space to relax outdoors, enjoy the shade, or visit with friends and neighbors. The covered carport adds convenient parking and protection from the elements. A storage shed in the back offers additional space for tools, seasonal items, or hobbies. The home is positioned in a quieter area of the park, giving it a peaceful, tucked-away feel. Inside, the primary bedroom includes a walk-in closet and a dedicated vanity area, providing both functionality and convenience. The secondary bedroom also features its own walk-in closet, offering ample storage for guests or additional use. Residents of The Redwoods enjoy a variety of community amenities including a pool, sauna, clubhouse, and additional recreational spaces, creating opportunities for social activities and an active lifestyle. The location provides easy access to several popular Redding destinations within about five miles, including Turtle Bay Exploration Park and the scenic Sundial Bridge, offering beautiful walking paths and riverfront views. Nearby shopping, restaurants, medical services, and everyday conveniences make this a practical and comfortable place to call home.
Key facts
- Easy access
- Covered carport
- Community amenities
Tags
Neighborhood map
What this means for you Summary
Snapshot
- This is a 2-bed/2.0-bath manufactured listed at $57k. Condition is rated fair.
Deal economics
- At list price, monthly cash flow is $924 ($11k/yr) — positive.
- The deal already cash-flows at list — no discount required.
- Meets the 1% rule at list price ($2k rent vs $57k).
- Recommended offer: $52k (9.0% below list) — sets the bar for market timing.
- Cap rate 25.7% vs local median 3.3% in Redding — top-decile yield for the area; either an underpriced asset or a hidden risk that comps aren't pricing in. Stress-test before assuming the spread holds.
Location & tenants
- Location reads 76/100 on livability (#106 in CA, #3,726 nationally) — a middle-class / working-renter tenant base. Strengths: amenities A+, commute A+, health & safety A+; Watch: employment C-, crime F, cost of living F.
- Gateway Unified (suburban): math 25% / reading 35% proficiency, ranked #355 of 517 in CA (top 69%) — families likely to look elsewhere, expect single-tenant / working-renter base with shorter leases.
- Market conditions: Rents rising fast (+6.0%/yr); 391 active listings in the ZIP; 16 comparable units currently listed for rent nearby; rentals leasing fast (median 13d on market — plan ~1-2 weeks tenant-placement turnaround); 246 units permitted in Shasta County in 2024 (0 in 5+ unit buildings).
Forward outlook
- Local home prices are declining (-3.0%/yr); year-one equity from $394 of loan paydown is wiped out by about $2k of value loss. Plan a longer hold.
- Shasta County population projected to shrink 9% by 2050 — rents likely to lag national; underwrite the cash flow, not the appreciation.
- At projected returns (-3.0% appreciation + 6.0% rent growth), your $16k cash investment doubles in ~2 years — after that, you're playing with house money.
Negotiation context
- It's been on market 97 days — a 9% lower offer ($52k) is reasonable based on typical stale-listing flexibility.
- 2 sale attempts since 9y ago; this cycle's ask has dropped $8k (12%) from the opening price — seller is motivated, your offer sets the floor, not the list.
- Current owner paid $23k; list at $57k implies a 148% gain — meaningful room to come down on a strong offer.
Risks & watch-outs
- Climate carrying-cost: major wildfire risk; extreme-heat days projected 7→16/yr by 2055 (HVAC capex compounding) — expect insurance premiums to compound above CPI over the hold.
Questions for the listing agent
- It's been on market 97 days. Have you received any prior offers? Is the seller open to a 9% concession, seller financing, or rate buy-down credit?
- Have any recent inspections been done? Can we get a copy of the seller's disclosures and any deferred-maintenance estimates?
- Built in 1974 — when were the roof, HVAC, electrical panel, plumbing, and water heater last replaced?
- Why hasn't it sold? Are there any deal-killer items the seller is aware of (foundation, flood, title, zoning, code violations)?
- Is there a deadline driving the sale (1031 exchange, divorce, estate, relocation)? That informs how much negotiation room exists.
- Schools are B-rated — typically a magnet for longer-tenancy family renters. What's the average tenant stay here, and is there a school-zone premium baked into asking?
- Crime grade is F in this area — have there been break-ins, vandalism, or insurance claims at this property in the last 3 years? What carrier currently insures it and at what premium?
- What's the average days-on-market for RENTAL listings here right now (not sales)? A rising rental-DOM trend means longer vacancies and softer asking-rent achievability than the comps imply.
- What's the recent tenant-quality profile in this submarket — average credit score on applications, eviction rate, late-payment / NSF rate, and stable-employment percentage? A property-management company in the area should have these aggregated.
- How much new for-sale + rental construction is in the pipeline within 1–3 miles? Heavy new supply typically softens prices + rents 12–24 months out; constrained supply supports both.
Investment metrics
- 1% rule
- 2.93% ✓
- Cap rate
- 25.75%
- Cash-on-cash
- 69.48%
- DSCR
- 4.09
- GRM
- 2.8
CMA / ARV
- ARV (median comp)
- $77,705
- List price
- $57,000
- Delta
- -26.65%
- Verdict
- UNDERPRICED
- Comps
- 20 within 1.0 mi
Show comp detail 12 sales within ~0.75 mi
| Address | Dist | Beds/Ba | Sqft | Sold | Price | $/sf | Match |
|---|---|---|---|---|---|---|---|
| 4555 Underwood Dr | 0.34mi | 2/2.0 | 1,440 (0%) | 1mo | $99,000 | $69 | 83 |
| 301 Sapwood Dr #280 | 0.31mi | 2/2.0 | 1,440 (0%) | 4mo | $65,900 | $46 | 82 |
| 323 Sapwood Dr Sp# 279 Dr | 0.31mi | 2/2.0 | 1,440 (0%) | 4mo | $89,000 | $62 | 82 |
| 458 Balsawood Dr | 0.14mi | 2/2.0 | 1,344 (-7%) | 1mo | $60,000 | $45 | 82 |
| 4719 Maple Trl | 0.32mi | 3/2.0 (+1) | 1,520 (+6%) | 3mo | $181,500 | $119 | 69 |
| 362 Lemon Dr #24 | 0.07mi | 3/2.0 (+1) | 1,248 (-13%) | 2mo | $76,100 | $61 | 67 |
| 4649 Underwood Dr #257 | 0.28mi | 3/2.0 (+1) | 1,536 (+7%) | 4mo | $75,000 | $49 | 67 |
| 470 Brushwood Dr #139 | 0.18mi | 2/2.0 | 1,632 (+13%) | 6mo | $98,000 | $60 | 65 |
| 4532 Hardwood Blvd #195 | 0.33mi | 2/2.0 | 1,600 (+11%) | 3mo | $76,000 | $48 | 64 |
| 1350 Aztec Path #229 | 0.67mi | 2/2.0 | 1,456 (+1%) | 6mo | $95,000 | $65 | 62 |
| 899 Tuberose Trl | 0.33mi | 3/2.0 (+1) | 1,560 (+8%) | 5mo | $99,180 | $64 | 62 |
| 11037 Erickson Way #76 | 0.59mi | 3/2.0 (+1) | 1,344 (-7%) | 2mo | $28,800 | $21 | 55 |
Match score weights: distance 35% · size 25% · config 20% · recency 20%. Top-matched comps best support the ARV.
Projected returns pro-forma
-3.0% appreciation · 5.98% rent growth · sell at horizon
- IRR
- 72.3%
- Equity multiple
- 4.43×
- Total profit
- $54,795
- Equity at exit
- $8,499
- IRR
- 77.1%
- Equity multiple
- 10.15×
- Total profit
- $146,075
- Equity at exit
- $4,928
Cash invested: $15,960 (down + closing). Projections, not guarantees.
Landlord ↔ Tenant lean methodology
- Overall (STATE)
- 18 Strongly Tenant-Friendly
- State California
- 18 Strongly Tenant-Friendly · D+13
- County
- — inherits STATE
- City
- — inherits STATE
ZIP-level market 96003
- Rents YoY
- 6.0%
- Active inventory
- 391
- Price-to-rent
- 2.8×
Monthly cashflow live
- Estimated rent
- $1,668 high interval (Pro) →
- Mortgage (P&I)
- −$299
- Tax est. 1.5%
- −$71 /mo · $855/yr
- Insurance
- −$24
- HOA
- −$0
- Vacancy / Maint / Mgmt
- −$350
- Net cashflow
- $924
Break-even live
UW: 25.0% down · 7.5% · 30yr · 1.5% tax · 5.0% vac · 8.0% maint · 8.0% mgmt
Financing live
Cash to close
- Down payment
- $14,250
- Closing costs
- $1,710
- Reserves months
- —
- Total cash needed
- —
Loan-product check · same deal, 3 products live
Conventional
25% down · 7.5% · 30yr
- Down + closing
- —
- Monthly P&I
- —
- Monthly cashflow
- —
- DSCR
- —
- Eligible?
- —
Personal DTI + credit; lowest rate.
DSCR
20% down · 8.5% · 30yr
- Down + closing
- —
- Monthly P&I
- —
- Monthly cashflow
- —
- DSCR
- —
- Eligible?
- —
No personal income docs; deal must DSCR.
Hard money
10% down · 12.0% · 12mo
- Down + closing
- —
- Monthly P&I
- —
- Monthly cashflow
- —
- DSCR
- —
- Eligible?
- —
Short-term bridge; refi at stabilization.
Rent comps 16 comps
| Address | Beds | Baths | Sqft | Rent | $/sqft | DOM | Units | Dist |
|---|---|---|---|---|---|---|---|---|
| 701 Redwood Blvd Redding, CA | 2.0 | 1.5–2.5 | 1163 | $1,820 | $1.56 | 13d | 1 | 0.25mi |
| 5391 Stonethrow Ct Redding, CA | 3.0 | 2.0 | 1100 | $1,895 | $1.72 | 43d | 1 | 0.36mi |
| 4490 Alder St Unit C Redding, CA | 2.0 | 1.0 | 900 | $1,150 | $1.28 | 21d | 1 | 0.43mi |
| 400 Lake Blvd Redding, CA | 2.0 | 1.5 | 900 | $1,310 | $1.46 | 13d | 1 | 0.49mi |
| 4296 Clay St Unit 17 Redding, CA | 2.0 | 1.5 | 900 | $1,395 | $1.55 | 21d | 1 | 0.57mi |
| 150 Masonic Ave Unit 1 Redding, CA | 2.0 | 1.5 | 924 | $1,400 | $1.52 | 13d | 1 | 0.58mi |
| 170 Masonic Ave #4 Redding, CA | 2.0 | 1.5 | 924 | $1,400 | $1.52 | 13d | 1 | 0.59mi |
| 4433 White River Dr Redding, CA | 2.0 | 2.0 | 1100 | $1,500 | $1.36 | 43d | 1 | 0.62mi |
| 251 Hilltop Dr Redding, CA | 1.0–2.0 | 1.0–2.0 | 757 | $1,475 | $1.95 | 13d | 1 | 0.75mi |
| 636 Lake Blvd Redding, CA | 2.0–3.0 | 1.0–2.0 | 986 | $1,295 | $1.31 | 13d | 8 | 0.87mi |
| 4288 Bradley Dr Redding, CA | 3.0 | 2.0 | 1008 | $1,950 | $1.93 | 21d | 1 | 0.91mi |
| 6053 Fallworth Dr Redding, CA | 3.0 | 2.0 | 1622 | $2,650 | $1.63 | 13d | 1 | 1.28mi |
| 500 Hilltop Dr Redding, CA | 2.0–3.0 | 2.0–3.0 | 1282 | $1,700 | $1.33 | 13d | 4 | 1.29mi |
| 6073 Fallworth Dr Redding, CA | 3.0 | 2.0 | 1622 | $2,650 | $1.63 | 13d | 1 | 1.30mi |
| 550 Mission de Oro Dr Redding, CA | 3.0 | 2.0 | 1429 | $1,995 | $1.40 | 21d | 1 | 1.39mi |
| 3465 Magnums Way Apt 2 Redding, CA | 3.0 | 2.0 | 1080 | $1,775 | $1.64 | 43d | 1 | 1.50mi |
Listing history 19 events
-
2026-06-19days on market $57,000 Active 97 DOM
-
2026-06-18days on market $57,000 Active 96 DOM
-
2026-06-17days on market $57,000 Active 95 DOM
-
2026-06-16days on market $57,000 Active 94 DOM
-
2026-06-15days on market $57,000 Active 93 DOM
-
2026-06-14days on market $57,000 Active 91 DOM
-
2026-06-13days on market $57,000 Active 90 DOM
-
2026-06-10days on market $57,000 Active 88 DOM
-
2026-06-09days on market $57,000 Active 87 DOM
-
2026-06-08days on market $57,000 Active 86 DOM
-
2026-06-07days on market $57,000 Active 85 DOM
-
2026-06-03days on market $57,000 Active 81 DOM
-
2026-06-02days on market $57,000 Active 80 DOM
-
2026-06-01days on market $57,000 Active 79 DOM
-
2026-05-31days on market $57,000 Active 78 DOM
-
2026-05-30days on market $57,000 Active 77 DOM
-
2026-03-14$65,000 Active 1446-char remark
Show marketing remark (1446 chars)
Tucked away in the desirable Redwoods Mobile Home Park, this 2 bedroom, 2 bathroom home offers comfortable living in a welcoming 55+ community. The property features low-maintenance landscaping, making it easy to enjoy your surroundings without extensive upkeep. A large covered patio provides a great space to relax outdoors, enjoy the shade, or visit with friends and neighbors. The covered carport adds convenient parking and protection from the elements. A storage shed in the back offers additional space for tools, seasonal items, or hobbies. The home is positioned in a quieter area of the park, giving it a peaceful, tucked-away feel. Inside, the primary bedroom includes a walk-in closet and a dedicated vanity area, providing both functionality and convenience. The secondary bedroom also features its own walk-in closet, offering ample storage for guests or additional use. Residents of The Redwoods enjoy a variety of community amenities including a pool, sauna, clubhouse, and additional recreational spaces, creating opportunities for social activities and an active lifestyle. The location provides easy access to several popular Redding destinations within about five miles, including Turtle Bay Exploration Park and the scenic Sundial Bridge, offering beautiful walking paths and riverfront views. Nearby shopping, restaurants, medical services, and everyday conveniences make this a practical and comfortable place to call home.
-
2017-03-31soldstatus $23,000 420-char remark
Show marketing remark (420 chars)
THE REDWOODS - A Senior Mobile Home Park. Must be 55 years or older. Mobile located very close to the active Club House with swimming pool, card room, pool tables, kitchen, etc. 2 bedrooms; 2 full baths; living, family, & dining room. Central Heat & AC; 7x48 ft front deck; Unit backs up to a green belt/creek. Close to shopping & transportation; Space rent of $469. includes water, sewer, & trash.
-
2017-03-01$24,000 420-char remark
Show marketing remark (420 chars)
THE REDWOODS - A Senior Mobile Home Park. Must be 55 years or older. Mobile located very close to the active Club House with swimming pool, card room, pool tables, kitchen, etc. 2 bedrooms; 2 full baths; living, family, & dining room. Central Heat & AC; 7x48 ft front deck; Unit backs up to a green belt/creek. Close to shopping & transportation; Space rent of $469. includes water, sewer, & trash.
ⓘ Source: listings_history table (triggers on properties + properties_extension) + one-shot
backfill from property_details.listing_events for pre-trigger history.
Climate risk First Street
- Flood 1/10 Low FEMA zone X (unshaded) · 0% chance over 30 yrs
- Wildfire 7/10 Severe
- Heat 8/10 Severe 7 d/yr ≥106°F today · 16 d/yr by 30 yrs out
- Wind 1/10 Low
- Air quality 10/10 Extreme 37 unhealthy d/yr today · 40 by 30 yrs out
Nearby sold comps map
Loading sold comps map…
Walkable amenities ~0.75 mi
Loading nearby amenities…
Taxation est. · year 1
- Rental income
- $20,020
- − Mortgage interest
- −$3,193
- − Property taxes
- −$855
- − Insurance
- −$285
- − Repairs & maintenance
- −$1,602
- − Management
- −$1,602
- − Depreciation
- −$1,658
- Taxable income
- $10,826
- Est. tax owed @ 24.0%
- −$2,598
- After-tax cash flow
- $8,491/yr
For passive investors: Depreciation is non-cash, so a rental often shows a tax loss while cash-flowing — sheltering income. Rental losses are passive: they offset passive income freely, and up to $25,000/yr can offset ordinary (W-2) income if you actively participate and your MAGI is under $100k (phasing out to $0 by $150k); unused losses carry forward. On sale, claimed depreciation is recaptured at up to 25%, and gains may owe capital-gains tax (a 1031 exchange can defer both). Figures are a year-1 estimate at your 24.0% rate — not tax advice; consult a CPA.
Condition & rehab AI · 12 photos
This mobile home requires moderate repairs and updates to improve its condition and value. Painting, updating cabinets, and landscaping would significantly enhance its appeal.
Repairs flagged
- Minor kitchen cabinets — Light wear and tear.
- Minor bathroom fixtures — Aesthetic update needed.
- Minor exterior paint — Slight fading.
- Minor interior paint — Faded in some areas.
- Minor landscaping — Needs trimming and updating.
- Minor HVAC filters — Regular maintenance needed.
Value-add opportunities
- Both Painting and updating kitchen cabinets — Enhances curb appeal and interior aesthetics.
- Both Landscaping and curb appeal improvements — Enhances property's visual appeal and value.
- Both HVAC system maintenance — Improves comfort and energy efficiency, attracting potential buyers/tenants.
Renovation cost estimate screening
| Repair item | Severity | Est. cost |
|---|---|---|
| kitchen cabinets · Light wear and tear. | Minor | $500–3,000 |
| bathroom fixtures · Aesthetic update needed. | Minor | $500–3,000 |
| exterior paint · Slight fading. | Minor | $500–3,000 |
| interior paint · Faded in some areas. | Minor | $500–3,000 |
| landscaping · Needs trimming and updating. | Minor | $500–3,000 |
| HVAC filters · Regular maintenance needed. | Minor | $500–3,000 |
| Total estimated repair cost · 6 items | $3,000–18,000 |
Value-add ROI direction
- Both Painting and updating kitchen cabinets — Enhances curb appeal and interior aesthetics. ↑
- Both Landscaping and curb appeal improvements — Enhances property's visual appeal and value. ↑
- Both HVAC system maintenance — Improves comfort and energy efficiency, attracting potential buyers/tenants. ↑
ⓘ Cost ranges are severity-bucket heuristics (US national rule-of-thumb). Get contractor quotes + a written scope before underwriting a rehab budget.
Schools (NCES district)
- District
- Gateway Unified
- NCES district ID
- 0614950
- Math proficiency
- 25% ▼ -5.00%
- Reading proficiency
- 35% ▲ 2.00%
- Median HH income
- $41,888
- Composite
- 25.39/100
- National rank
- #7465
- State rank
- #355 of 517 in CA
Livability — Redding
- Score
- 76/100
- State rank
- #106
- US rank
- #3726
Category grades
Schools grade is shown separately in the Schools card above.
Census & demographics
- Census place
- Redding, CA
- County
- Shasta County · 147,641 people
- City population
- 112,523
- Metro
- Redding, CA
- Population (ZIP)
- 44,923
- Household income
- $72,445
- Rent vs Own
- Severe rent burden
- 1668.0
Population outlook (Shasta County) Hauer SSP2
- Today (2025)
- 179,231 people
- By 2030
- 176,953 · -1.3%
- By 2040
- 169,982 · -5.2%
- By 2050
- 162,547 · -9.3%
- By 2075
- 145,649 · -18.7%
- By 2100
- 123,025 · -31.4%
Race, ethnicity, and origin ACS 2023
- Neighborhood character
- Predominantly White (76%)
- Race & ethnicity
- White 76% Hispanic / Latino 11% Two or more races 10% Asian 4% Native American 1% Black 1%
- Hispanic origin (detail)
- Mexican 7%
- Common ancestry
- Italian 5% Slovak 3% Lithuanian 3%
- Foreign-born
- 6% · Canada, China
- Languages at home
- 92% English-only · Spanish 3% German/W. Germanic 1% Other Asian/Pacific 1%
Political lean MEDSL · Shasta
- 2024 margin
- Solid R (+36.5) · D 30.5% · R 67.0% · Other 2.5%
- 2008→2024 swing
- -10.7pp toward R · 2008: -25.8pp · 2024: -36.5pp
- All cycles
- 2024: R+36.5 2020: R+33.1 2016: R+37.4 2012: R+30.3 2008: R+25.8
Not yet ingested
- Civics
- —
Market trends
- HPI YoY
- ▼ -181.66%
- Current HPI
- 152.3069
- Rent YoY
- ▲ 5.98%
- Metro
- Redding, CA
- State GDP YoY
- ▲ 3.21%
- F500 in state
- 116
Industry mix (Fortune 500 HQ in CA)
| Industry | F500 HQs | Revenue |
|---|---|---|
| Technology | 27 | $1,492B |
|
||
| Financial Services | 3 | $174B |
|
||
| Retail | 3 | $44B |
|
||
| Insurance | 3 | $26B |
|
||
| Media / Entertainment | 2 | $115B |
|
||
| Pharmaceuticals / Biotech | 2 | $62B |
|
||
Price history
+170.8% since first listed3 events — show timeline
- 2026-03-14 Listed $65,000 SAOR
- 2017-03-31 Sold (MLS) $23,000 SAOR
- 2017-03-01 Listed $24,000 SAOR
Cash-flow waterfall
monthlySold comps — $/sqft
last 12 mo · ≤1 miLoading sold comps…