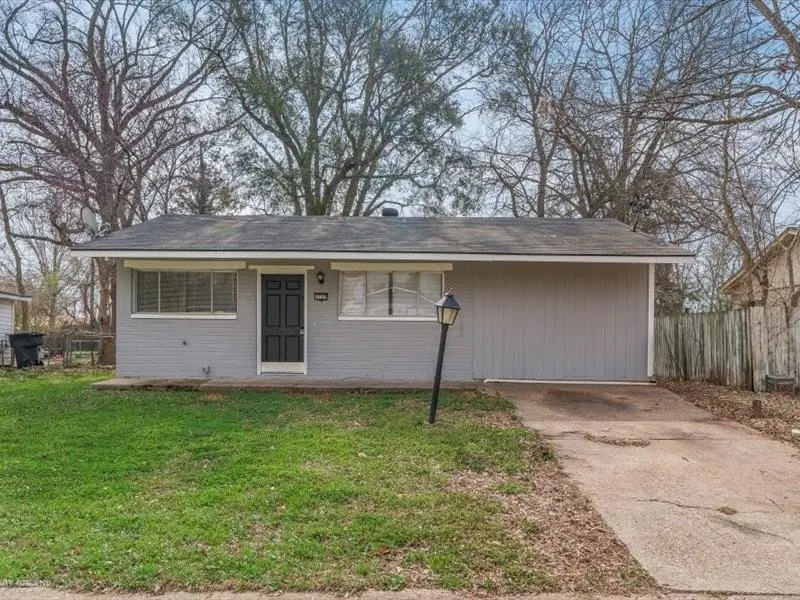
4720 Okeefe St · Bossier City, LA
Flood risk 1/10 · Minimal
- FEMA flood zone
- X (unshaded)
- Chance of flooding over 30 yrs
- 0.0%
- Est. flood insurance / yr
- $507 – $1,088
Fire risk 2/10 · Minimal
- Est. fire insurance / yr
- $1,269 – $2,357
Heat risk 7/10 · Major
- Hot days now (above 110°F)
- 7 days/yr
- Hot days in 30 yrs
- 21 days/yr
Wind risk 6/10 · Moderate
- Chance of severe wind over 30 yrs
- 67.0%
Air-quality risk 2/10 · Minimal
- Unhealthy air days now
- 1 days/yr
- Unhealthy air days in 30 yrs
- 2 days/yr
Risk factors via First Street. Map © Google.
Why this score? — see what drove the C- grade
The composite is a weighted blend of 9 inputs, each scored 0–100. Each bar is that input's sub-score; the figure is the points it added to the 100-point composite (weight × sub-score).
- Cash flow +25.7/30.0
- DSCR +8.6/10.0
- 1% rule +5.8/10.0
- Rent growth +4.1/5.0
- Schools +3.8/10.0
- Livability +3.6/5.0
- Condition / age +2.5/5.0
- ARV discount +0.0/15.0
- Appreciation +0.0/10.0
$133,000
🖨 Deal sheet 📄 Offer letter ✓ Due diligence
Listing remarks MLS
This 3 bedroom, 1-bath home offers 1,212 sq. ft. of smart living space at an unbeatable price point. Recently refreshed with new interior paint, the home features a functional layout with spacious bedrooms and an inviting living area. Forget the fixer-upper stress, the roof was replaced in 2020 and the HVAC is nearly new 2023. Whether you’re looking for a solid investment or your very first home, this North Bossier find is a rare value play.
Key facts
- 7,536 sq ft lot
- Built 1962
- Listed 74 days
Neighborhood map
What this means for you Summary
Snapshot
- This is a 3-bed/1.0-bath single-family listed at $133k.
Deal economics
- At list price, monthly cash flow is $318 ($4k/yr) — positive.
- The deal already cash-flows at list — no discount required.
- Meets the 1% rule at list price ($1k rent vs $133k).
- Recommended offer: $125k (6.0% below list) — sets the bar for market timing.
- Cap rate 9.2% vs local median 4.7% in Bossier City — top-decile yield for the area; either an underpriced asset or a hidden risk that comps aren't pricing in. Stress-test before assuming the spread holds.
Location & tenants
- Location reads 71/100 on livability (#47 in LA) — a middle-class / working-renter tenant base. Strengths: commute A+, cost of living A+, housing A+; Watch: employment D+, crime F, amenities F.
- Bossier Parish (urban): math 40% / reading 47% proficiency, ranked #17 of 98 in LA (top 17%) — families likely to look elsewhere, expect single-tenant / working-renter base with shorter leases.
- Market conditions: Rents rising fast (+6.6%/yr); 421 active listings in the ZIP; 10 comparable units currently listed for rent nearby; rentals at typical pace (median 21d on market — plan ~3-4 weeks tenant-placement turnaround); 716 units permitted in Bossier Parish in 2024 (0 in 5+ unit buildings).
Forward outlook
- Local home prices are declining (-3.0%/yr); year-one equity from $920 of loan paydown is wiped out by about $4k of value loss. Plan a longer hold.
- Bossier County population projected at +28% by 2050 — long-run rental-demand tailwind backs the buy-and-hold thesis.
- At projected returns (-3.0% appreciation + 6.6% rent growth), your $37k cash investment doubles in ~8 years — after that, you're playing with house money.
Negotiation context
- It's been on market 75 days — a 6% lower offer ($125k) is reasonable based on typical stale-listing flexibility.
- 3 sale attempts since 4y ago; this cycle's ask is 10131% above the opening price — seller raised mid-cycle; expect resistance to lowballs.
- Current owner paid $83k; list at $133k implies a 59% gain — meaningful room to come down on a strong offer.
Risks & watch-outs
- Climate carrying-cost: major wind risk, 67% chance of damaging wind over 30y; extreme-heat days projected 7→21/yr by 2055 (HVAC capex compounding) — expect insurance premiums to compound above CPI over the hold.
Questions for the listing agent
- It's been on market 75 days. Have you received any prior offers? Is the seller open to a 6% concession, seller financing, or rate buy-down credit?
- Built in 1962 — when were the roof, HVAC, electrical panel, plumbing, and water heater last replaced?
- Why hasn't it sold? Are there any deal-killer items the seller is aware of (foundation, flood, title, zoning, code violations)?
- Is there a deadline driving the sale (1031 exchange, divorce, estate, relocation)? That informs how much negotiation room exists.
- Schools are B-rated — typically a magnet for longer-tenancy family renters. What's the average tenant stay here, and is there a school-zone premium baked into asking?
- Crime grade is F in this area — have there been break-ins, vandalism, or insurance claims at this property in the last 3 years? What carrier currently insures it and at what premium?
- What's the average days-on-market for RENTAL listings here right now (not sales)? A rising rental-DOM trend means longer vacancies and softer asking-rent achievability than the comps imply.
- What's the recent tenant-quality profile in this submarket — average credit score on applications, eviction rate, late-payment / NSF rate, and stable-employment percentage? A property-management company in the area should have these aggregated.
- How much new for-sale + rental construction is in the pipeline within 1–3 miles? Heavy new supply typically softens prices + rents 12–24 months out; constrained supply supports both.
Investment metrics
- 1% rule
- 1.08% ✓
- Cap rate
- 9.16%
- Cash-on-cash
- 10.24%
- DSCR
- 1.46
- GRM
- 7.7
CMA / ARV
- ARV (median comp)
- $112,617
- List price
- $133,000
- Delta
- 18.10%
- Verdict
- OVERPRICED
- Comps
- 20 within 1.0 mi
Show comp detail 12 sales within ~0.75 mi
| Address | Dist | Beds/Ba | Sqft | Sold | Price | $/sf | Match |
|---|---|---|---|---|---|---|---|
| 4603 Okeefe St | 0.17mi | 3/1.0 | 1,248 (+4%) | 3mo | $111,900 | $90 | 83 |
| 4809 Sullivan St | 0.15mi | 3/1.5 | 1,186 (-1%) | 9mo | $115,000 | $97 | 82 |
| 4844 Camellia Ln | 0.35mi | 3/1.5 | 1,091 (-9%) | 3mo | $149,900 | $137 | 64 |
| 4833 Sheryl St | 0.25mi | 2/1.5 (-1) | 1,330 (+11%) | 1mo | $135,000 | $102 | 62 |
| 4610 Voss Dr | 0.36mi | 3/2.0 | 1,126 (-6%) | 9mo | $127,500 | $113 | 62 |
| 1308 Becky St | 0.69mi | 2/1.0 (-1) | 1,197 (-0%) | 3mo | $139,900 | $117 | 60 |
| 4517 Donnie Ave | 0.37mi | 3/1.0 | 1,022 (-15%) | 3mo | $128,000 | $125 | 56 |
| 4846 Camellia Ln | 0.35mi | 3/1.5 | 1,367 (+14%) | 5mo | $108,000 | $79 | 54 |
| 1302 Elsa Jane St | 0.56mi | 3/2.0 | 1,273 (+6%) | 8mo | $150,000 | $118 | 53 |
| 763 Venecia Dr | 0.55mi | 3/2.0 | 1,363 (+14%) | 3mo | $234,690 | $172 | 45 |
| 751 Venecia Dr | 0.53mi | 3/2.0 | 1,363 (+14%) | 7mo | $234,075 | $172 | 43 |
| 800 Venecia Dr | 0.61mi | 3/2.0 | 1,363 (+14%) | 6mo | $242,768 | $178 | 40 |
Match score weights: distance 35% · size 25% · config 20% · recency 20%. Top-matched comps best support the ARV.
Projected returns pro-forma
-3.0% appreciation · 6.56% rent growth · sell at horizon
- IRR
- 2.7%
- Equity multiple
- 1.11×
- Total profit
- $3,969
- Equity at exit
- $19,831
- IRR
- 15.2%
- Equity multiple
- 2.42×
- Total profit
- $52,835
- Equity at exit
- $11,499
Cash invested: $37,240 (down + closing). Projections, not guarantees.
Landlord ↔ Tenant lean methodology
- Overall (STATE)
- 90 Strongly Landlord-Friendly
- State Louisiana
- 90 Strongly Landlord-Friendly · R+12
- County
- — inherits STATE
- City
- — inherits STATE
ZIP-level market 71111
- Home prices YoY
- -34.8%
- Rents YoY
- 6.6%
- Active inventory
- 421
- Price-to-rent
- 7.7×
Monthly cashflow live
- Estimated rent
- $1,433 high interval (Pro) →
- Mortgage (P&I)
- −$697
- Tax from tax record
- −$62 /mo · $740/yr
- Insurance
- −$55
- HOA
- −$0
- Vacancy / Maint / Mgmt
- −$301
- Net cashflow
- $318
Break-even live
UW: 25.0% down · 7.5% · 30yr · 1.5% tax · 5.0% vac · 8.0% maint · 8.0% mgmt
Financing live
Cash to close
- Down payment
- $33,250
- Closing costs
- $3,990
- Reserves months
- —
- Total cash needed
- —
Loan-product check · same deal, 3 products live
Conventional
25% down · 7.5% · 30yr
- Down + closing
- —
- Monthly P&I
- —
- Monthly cashflow
- —
- DSCR
- —
- Eligible?
- —
Personal DTI + credit; lowest rate.
DSCR
20% down · 8.5% · 30yr
- Down + closing
- —
- Monthly P&I
- —
- Monthly cashflow
- —
- DSCR
- —
- Eligible?
- —
No personal income docs; deal must DSCR.
Hard money
10% down · 12.0% · 12mo
- Down + closing
- —
- Monthly P&I
- —
- Monthly cashflow
- —
- DSCR
- —
- Eligible?
- —
Short-term bridge; refi at stabilization.
Rent comps 10 comps
| Address | Beds | Baths | Sqft | Rent | $/sqft | DOM | Units | Dist |
|---|---|---|---|---|---|---|---|---|
| 4720 Okeefe St Bossier City, LA | 3.0 | 1.0 | 1212 | $1,300 | $1.07 | 21d | 1 | 0.02mi |
| 4612 Sullivan St Bossier City, LA | 3.0 | 1.0 | 864 | $1,200 | $1.39 | 21d | 1 | 0.20mi |
| 1206 Olwen Dr Bossier City, LA | 3.0 | 1.0 | 1056 | $975 | $0.92 | 13d | 1 | 0.44mi |
| 5200 E Texas St Bossier City, LA | 1.0–3.0 | 1.0–2.0 | 1068 | $1,731 | $1.62 | 13d | 28 | 0.47mi |
| 800 Venecia Dr Bossier City, LA | 3.0 | 2.0 | 1363 | $2,000 | $1.47 | 43d | 1 | 0.61mi |
| 1314 Lampkin St Bossier City, LA | 2.0 | 1.0 | 1000 | $1,000 | $1.00 | 21d | 1 | 0.65mi |
| 5705 E Texas St #175 Bossier City, LA | 2.0 | 1.5 | 1044 | $1,050 | $1.01 | 43d | 1 | 0.74mi |
| 1315 Norris Dr Bossier City, LA | 3.0 | 1.0 | 1095 | $1,150 | $1.05 | 21d | 1 | 0.76mi |
| 1523 Lampkin Cir Bossier City, LA | 3.0 | 1.0 | 1114 | $1,150 | $1.03 | 21d | 1 | 0.86mi |
| 1419 Teekell St Bossier City, LA | 3.0 | 1.0 | 1146 | $1,400 | $1.22 | 43d | 1 | 0.88mi |
Listing history 7 events
-
2026-05-07$1,300
-
2026-03-13$133,000 Active 451-char remark
Show marketing remark (451 chars)
This 3 bedroom, 1-bath home offers 1,212 sq. ft. of smart living space at an unbeatable price point. Recently refreshed with new interior paint, the home features a functional layout with spacious bedrooms and an inviting living area. Forget the fixer-upper stress, the roof was replaced in 2020 and the HVAC is nearly new 2023. Whether you’re looking for a solid investment or your very first home, this North Bossier find is a rare value play.
-
2022-03-10historical
-
2022-03-07$105,000 Active
-
2008-12-23soldstatus $83,400
-
2006-08-14soldstatus $86,000
-
2004-10-08soldstatus $51,500
ⓘ Source: listings_history table (triggers on properties + properties_extension) + one-shot
backfill from property_details.listing_events for pre-trigger history.
Tax reassessment forecast LA · Resets to sale price
- Current annual tax
- $740 · $62/mo
- Projected year-2 tax
- $740 · $62/mo
- Expected delta
- $0/yr ($0/mo · 0.0%)
ⓘ Screening estimate from a state-policy table — verify with the county assessor before closing.
Climate risk First Street
- Flood 1/10 Low FEMA zone X (unshaded) · 0% chance over 30 yrs
- Wildfire 2/10 Low
- Heat 7/10 Severe 7 d/yr ≥110°F today · 21 d/yr by 30 yrs out
- Wind 6/10 Major 67% chance of damaging wind over 30 yrs
- Air quality 2/10 Low 1 unhealthy d/yr today · 2 by 30 yrs out
Nearby sold comps map
Loading sold comps map…
Walkable amenities ~0.75 mi
Loading nearby amenities…
Taxation est. · year 1
- Rental income
- $17,202
- − Mortgage interest
- −$7,450
- − Property taxes
- −$740
- − Insurance
- −$665
- − Repairs & maintenance
- −$1,376
- − Management
- −$1,376
- − Depreciation
- −$3,869
- Taxable income
- $1,725
- Est. tax owed @ 24.0%
- −$414
- After-tax cash flow
- $3,401/yr
For passive investors: Depreciation is non-cash, so a rental often shows a tax loss while cash-flowing — sheltering income. Rental losses are passive: they offset passive income freely, and up to $25,000/yr can offset ordinary (W-2) income if you actively participate and your MAGI is under $100k (phasing out to $0 by $150k); unused losses carry forward. On sale, claimed depreciation is recaptured at up to 25%, and gains may owe capital-gains tax (a 1031 exchange can defer both). Figures are a year-1 estimate at your 24.0% rate — not tax advice; consult a CPA.
Schools (NCES district)
- District
- Bossier Parish
- NCES district ID
- 2200270
- Math proficiency
- 40% ▼ -32.00%
- Reading proficiency
- 47% ▼ -28.00%
- Median HH income
- $51,326
- Composite
- 37.5/100
- National rank
- #4402
- State rank
- #17 of 98 in LA
Livability — Bossier City
- Score
- 71/100
- State rank
- #47
- US rank
- #7044
Category grades
Schools grade is shown separately in the Schools card above.
Census & demographics
- Census place
- Bossier City, LA
- County
- Bossier Parish · 98,704 people
- City population
- 91,925
- Metro
- Shreveport-Bossier City, LA
- Population (ZIP)
- 43,925
- Household income
- $65,292
- Rent vs Own
- Severe rent burden
- 1942.0
Population outlook (Bossier County) Hauer SSP2
- Today (2025)
- 143,247 people
- By 2030
- 151,802 · +6.0%
- By 2040
- 168,194 · +17.4%
- By 2050
- 183,533 · +28.1%
- By 2075
- 217,009 · +51.5%
- By 2100
- 230,091 · +60.6%
Race, ethnicity, and origin ACS 2023
- Neighborhood character
- Diverse neighborhood (Simpson 0.60)
- Race & ethnicity
- White 56% Black 29% Hispanic / Latino 9% Two or more races 8% Asian 3%
- Hispanic origin (detail)
- Mexican 5%
- Common ancestry
- Lithuanian 2% Iranian 1% Slovak 1%
- Foreign-born
- 5% · Canada, Vietnam
- Languages at home
- 90% English-only · Spanish 7% Vietnamese 1% French/Haitian/Cajun 1%
Political lean MEDSL · Bossier
- 2024 margin
- Solid R (+43.3) · D 27.7% · R 71.0% · Other 1.3%
- 2008→2024 swing
- +0.3pp no change · 2008: -43.7pp · 2024: -43.3pp
- All cycles
- 2024: R+43.3 2020: R+41.0 2016: R+45.8 2012: R+45.4 2008: R+43.7
Not yet ingested
- Civics
- —
Market trends
- HPI YoY
- ▼ -79.78%
- Current HPI
- 149.4336
- Rent YoY
- ▲ 6.56%
- Metro
- Shreveport-Bossier City, LA
- State GDP YoY
- ▲ 3.29%
- F500 in state
- 10
Industry mix (Fortune 500 HQ in LA)
| Industry | F500 HQs | Revenue |
|---|---|---|
| Telecommunications | 2 | $23B |
|
||
| Utilities | 1 | $12B |
|
||
| Wholesale / Distribution | 1 | $5B |
|
||
| Advertising | 1 | $2B |
|
||
Price history
-97.5% since first listed7 events — show timeline
- 2026-05-07 Listed for Rent $1,300 Avail
- 2026-03-13 Listed $133,000 NTREIS
- 2022-03-10 Listing Removed — NTREIS
- 2022-03-07 Listed $105,000 NTREIS
- 2008-12-23 Sold (Public Records) $83,400 Public Records
- 2006-08-14 Sold (Public Records) $86,000 Public Records
- 2004-10-08 Sold (Public Records) $51,500 Public Records
Property tax history
-1.4%/yrLatest (2025): $740 · -1.3% YoY. Source: county tax records.
Cash-flow waterfall
monthlySold comps — $/sqft
last 12 mo · ≤1 miLoading sold comps…