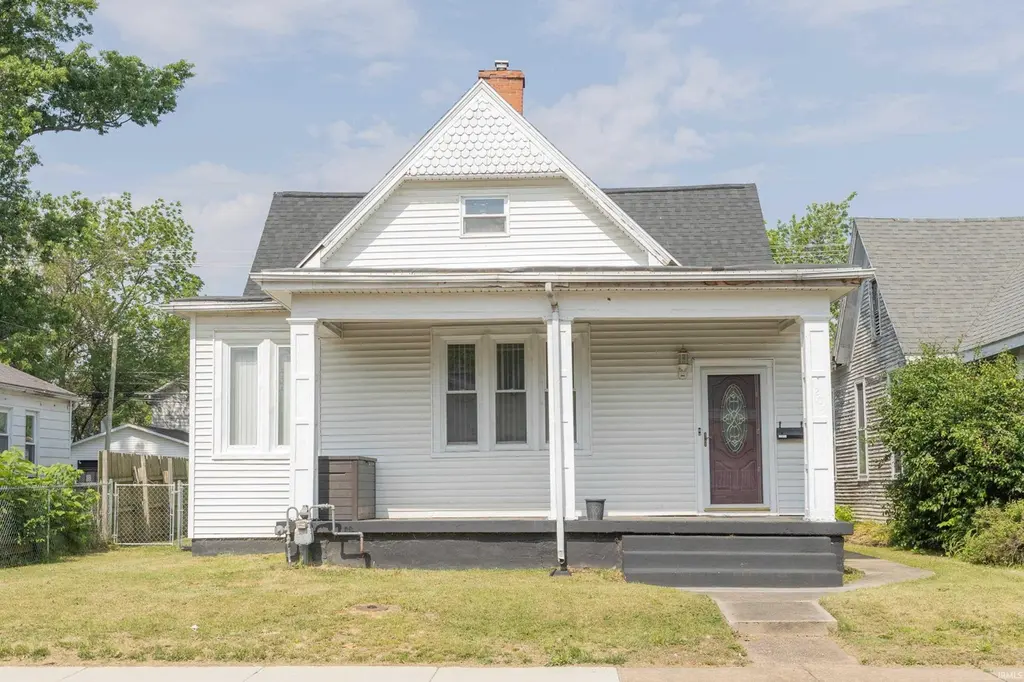
1205 S Kentucky Ave · Evansville, IN
Flood risk 1/10 · Minimal
- FEMA flood zone
- X
- Chance of flooding over 30 yrs
- 0.0%
- Est. flood insurance / yr
- $473 – $860
Fire risk 1/10 · Minimal
- Est. fire insurance / yr
- $717 – $1,331
Heat risk 5/10 · Moderate
- Hot days now (above 107°F)
- 7 days/yr
- Hot days in 30 yrs
- 19 days/yr
Wind risk 2/10 · Minimal
- Chance of severe wind over 30 yrs
- 3.0%
Air-quality risk 3/10 · Minor
- Unhealthy air days now
- 3 days/yr
- Unhealthy air days in 30 yrs
- 4 days/yr
Risk factors via First Street. Map © Google.
Why this score? — see what drove the D grade
The composite is a weighted blend of 9 inputs, each scored 0–100. Each bar is that input's sub-score; the figure is the points it added to the 100-point composite (weight × sub-score).
- Cash flow +19.7/30.0
- DSCR +6.2/10.0
- Rent growth +4.5/5.0
- 1% rule +4.0/10.0
- Schools +3.3/10.0
- Livability +3.2/5.0
- Condition / age +2.5/5.0
- ARV discount +0.0/15.0
- Appreciation +0.0/10.0
$145,000
🖨 Deal sheet 📄 Offer letter ✓ Due diligence
Listing remarks
Welcome to this charming 4-bedroom, 1.5-bath home filled with timeless character and beautiful Craftsman-style details throughout. The spacious living room showcases stunning original woodwork, large windows that bring in abundant natural light, and a cozy sitting area just off to the side. A generous dining room, newer light fixtures, and classic Craftsman-style doors add even more warmth and appeal to the main level. The roomy kitchen features black appliances and plenty of space for cooking and gathering. A convenient half bath also includes a partial laundry area, with the potential to easily reinstall a tub/shower combo and convert it back into a full main-level bathroom. Upstairs, you
Key facts
- Large windows
- Black appliances
- Generous dining room
Tags
Property features AI
Finance
- Other: Lot dimensions approximately 50 x 125 (0.14 acre)
- Financial info: No financial details provided
- HOA & community: No homeowners association listed
Exterior
- Parking: Parking details not provided
- Security: No specific security features listed
- Utilities: Public water; Public sewer; Cable available and connected
- Home design: Single-family residential, site-built home; 2 stories
- Construction: Aluminum and vinyl siding; Block foundation; Shingle roof; Built area above grade: 2,199
- Exterior features: Porch; Fenced yard (full chain link); Irregular, level lot
Interior
- Kitchen: Disposal; Dishwasher; Refrigerator; Gas range
- Bedrooms: Bedrooms included in 9 total rooms
- Flooring: Carpet; Laminate
- Bathrooms: 1 full bathroom; 1 half bathroom; 1 main-level bathroom
- Heating & cooling: Natural gas forced air heating; Central air; Ceiling fan(s)
- Interior features: Walk-in closet(s); Ceiling fan(s); Laminate countertops; Partial unfinished basement with sump pump
- Laundry & utility: Electric dryer hookup; Laundry in basement
Neighborhood map
What this means for you Summary
Snapshot
- This is a 3-bed/1.0-bath single-family listed at $145k.
Deal economics
- At list price, monthly cash flow is $170 ($2k/yr) — positive.
- The deal already cash-flows at list — no discount required.
- To meet the 1% rule (rent ≥ 1% of price), the offer needs to be $130k (10.0% below list).
- Recommended offer: $130k (10.0% below list) — sets the bar for 1% rule.
- Cap rate 7.7% vs local median 4.6% in Evansville — top-decile yield for the area; either an underpriced asset or a hidden risk that comps aren't pricing in. Stress-test before assuming the spread holds.
Location & tenants
- Location reads 63/100 on livability (#416 in IN) — a middle-class / working-renter tenant base. Strengths: cost of living A+, housing A+, health & safety A+; Watch: crime F, commute F, employment D-.
- Evansville Vanderburgh School Corporation (urban): math 36% / reading 43% proficiency, ranked #153 of 301 in IN (top 51%) — families likely to look elsewhere, expect single-tenant / working-renter base with shorter leases.
- Zoned schools: Glenwood Leadership Academy (math 10% / reading 12%, grade F, #909 of 994 statewide, top 92%, 416 students, 88% FRL) — zoned schools average 88% FRL vs 50% district-wide (38 pts higher); higher-poverty schools than district average — tighter screening recommended.
- Zoned-school proficiency averages 11% at this address vs 40% district-wide (-28 pts) — the specific schools serving this property underperform the Evansville Vanderburgh School Corporation average; the district grade overstates school quality for this exact location.
- Market conditions: Rents rising fast (+7.9%/yr); 188 active listings in the ZIP; 15 comparable units currently listed for rent nearby; rentals at typical pace (median 22d on market — plan ~3-4 weeks tenant-placement turnaround); 508 units permitted in Vanderburgh County in 2024 (32 in 5+ unit buildings).
Forward outlook
- Local home prices are declining (-3.0%/yr); year-one equity from $1k of loan paydown is wiped out by about $4k of value loss. Plan a longer hold.
- At projected returns (-3.0% appreciation + 7.9% rent growth), your $41k cash investment doubles in ~10 years — after that, you're playing with house money.
Negotiation context
- It's been on market 28 days — a 2% lower offer ($143k) is reasonable based on typical stale-listing flexibility.
Risks & watch-outs
- Watch-outs: built in 1909 — expect roof / HVAC / electrical / plumbing capex.
- Climate carrying-cost: extreme-heat days projected 7→19/yr by 2055 (HVAC capex compounding) — expect insurance premiums to compound above CPI over the hold.
Questions for the listing agent
- Built in 1909 — when were the roof, HVAC, electrical panel, plumbing, and water heater last replaced?
- Is there a deadline driving the sale (1031 exchange, divorce, estate, relocation)? That informs how much negotiation room exists.
- Schools are D-rated, which usually means shorter tenancies and higher turnover. Who's the typical renter profile here, and what's been the actual vacancy rate?
- Crime grade is F in this area — have there been break-ins, vandalism, or insurance claims at this property in the last 3 years? What carrier currently insures it and at what premium?
- The area grade is low — what's the realistic commute time and amenity access for the typical tenant pool here? Any planned neighborhood developments (good or bad) we should know about?
- What's the average days-on-market for RENTAL listings here right now (not sales)? A rising rental-DOM trend means longer vacancies and softer asking-rent achievability than the comps imply.
- What's the recent tenant-quality profile in this submarket — average credit score on applications, eviction rate, late-payment / NSF rate, and stable-employment percentage? A property-management company in the area should have these aggregated.
- How much new for-sale + rental construction is in the pipeline within 1–3 miles? Heavy new supply typically softens prices + rents 12–24 months out; constrained supply supports both.
Investment metrics
- 1% rule
- 0.90% ✗
- Cap rate
- 7.70%
- Cash-on-cash
- 5.03%
- DSCR
- 1.22
- GRM
- 9.3
CMA / ARV
- ARV (on-the-fly)
- $117,392
- Comps found
- 12
Show comp detail 12 sales within ~0.75 mi
| Address | Dist | Beds/Ba | Sqft | Sold | Price | $/sf | Match |
|---|---|---|---|---|---|---|---|
| 712 E Blackford Ave | 0.44mi | 2/1.0 (-1) | 1,327 (-0%) | 1mo | $22,000 | $17 | 73 |
| 1414 Marshall Ave | 0.49mi | 3/1.0 | 1,364 (+2%) | 1mo | $122,000 | $89 | 73 |
| 1101 Ravenswood Dr | 0.30mi | 2/1.0 (-1) | 1,269 (-5%) | 1mo | $155,000 | $122 | 72 |
| 1563 Marshall Ave | 0.52mi | 3/1.5 | 1,338 (+0%) | 3mo | $83,000 | $62 | 71 |
| 1225 S Bedford Ave | 0.13mi | 4/1.0 (+1) | 1,522 (+14%) | 2mo | $130,000 | $85 | 64 |
| 1045 Bayard Park Dr | 0.44mi | 3/1.5 | 1,440 (+8%) | 4mo | $110,000 | $76 | 61 |
| 1108 E Blackford Ave | 0.31mi | 2/1.0 (-1) | 1,176 (-12%) | 3mo | $48,500 | $41 | 58 |
| 613 Madison Ave | 0.44mi | 3/1.0 | 1,176 (-12%) | 4mo | $165,000 | $140 | 56 |
| 1425 Covert Ave | 0.66mi | 3/1.0 | 1,183 (-11%) | 1mo | $118,000 | $100 | 50 |
| 1059 Waggoner Ave | 0.42mi | 2/2.0 (-1) | 1,150 (-14%) | 1mo | $125,000 | $109 | 47 |
| 1628 Washington Ave | 0.74mi | 3/2.0 | 1,453 (+9%) | 1mo | $127,500 | $88 | 46 |
| 600 E Chandler Ave | 0.62mi | 3/2.0 | 1,525 (+14%) | 3mo | $51,000 | $33 | 40 |
Match score weights: distance 35% · size 25% · config 20% · recency 20%. Top-matched comps best support the ARV.
Projected returns pro-forma
-3.0% appreciation · 7.86% rent growth · sell at horizon
- IRR
- -3.8%
- Equity multiple
- 0.85×
- Total profit
- $-6,037
- Equity at exit
- $21,620
- IRR
- 10.3%
- Equity multiple
- 1.96×
- Total profit
- $38,795
- Equity at exit
- $12,537
Cash invested: $40,600 (down + closing). Projections, not guarantees.
Landlord ↔ Tenant lean methodology
- Overall (STATE)
- 90 Strongly Landlord-Friendly
- State Indiana
- 90 Strongly Landlord-Friendly · R+11
- County
- — inherits STATE
- City
- — inherits STATE
ZIP-level market 47714
- Rents YoY
- 7.9%
- Active inventory
- 188
- Price-to-rent
- 9.3×
Monthly cashflow live
- Estimated rent
- $1,305 high interval (Pro) →
- Mortgage (P&I)
- −$760
- Tax from tax record
- −$40 /mo · $480/yr
- Insurance
- −$60
- HOA
- −$0
- Vacancy / Maint / Mgmt
- −$274
- Net cashflow
- $170
Break-even live
UW: 25.0% down · 7.5% · 30yr · 1.5% tax · 5.0% vac · 8.0% maint · 8.0% mgmt
Financing live
Cash to close
- Down payment
- $36,250
- Closing costs
- $4,350
- Reserves months
- —
- Total cash needed
- —
Loan-product check · same deal, 3 products live
Conventional
25% down · 7.5% · 30yr
- Down + closing
- —
- Monthly P&I
- —
- Monthly cashflow
- —
- DSCR
- —
- Eligible?
- —
Personal DTI + credit; lowest rate.
DSCR
20% down · 8.5% · 30yr
- Down + closing
- —
- Monthly P&I
- —
- Monthly cashflow
- —
- DSCR
- —
- Eligible?
- —
No personal income docs; deal must DSCR.
Hard money
10% down · 12.0% · 12mo
- Down + closing
- —
- Monthly P&I
- —
- Monthly cashflow
- —
- DSCR
- —
- Eligible?
- —
Short-term bridge; refi at stabilization.
Rent comps 15 comps
| Address | Beds | Baths | Sqft | Rent | $/sqft | DOM | Units | Dist |
|---|---|---|---|---|---|---|---|---|
| 638 Jackson Ave Evansville, IN | 4.0 | 1.0 | 1176 | $1,495 | $1.27 | 21d | 1 | 0.40mi |
| 605 Madison Ave Evansville, IN | 2.0 | 1.0 | 1069 | $1,375 | $1.29 | 21d | 1 | 0.47mi |
| 1133 Bayard Park Dr Unit B Evansville, IN | 2.0 | 1.0 | 990 | $800 | $0.81 | 21d | 1 | 0.48mi |
| 734 Bayard Park Dr Evansville, IN | 3.0 | 2.0 | 1000 | $1,425 | $1.43 | 21d | 1 | 0.55mi |
| 827 Judson St Evansville, IN | 3.0 | 1.0 | 1008 | $1,295 | $1.28 | 14d | 1 | 0.82mi |
| 17 Washington Ave Evansville, IN | 2.0 | 1.0 | 882 | $1,455 | $1.65 | 21d | 1 | 0.97mi |
| 304 S Grand Ave Evansville, IN | 2.0 | 1.0 | 967 | $955 | $0.99 | 21d | 1 | 0.99mi |
| 1952 Colts Ln Evansville, IN | 1.0–3.0 | 1.0 | 1146 | $1,275 | $1.11 | 21d | 8 | 1.23mi |
| 1762 Spring Ct Evansville, IN | 2.0 | 1.0 | 975 | $1,450 | $1.49 | 21d | 1 | 1.28mi |
| 2340 Sunburst Blvd Unit 2200-202 Evansville, IN | 3.0 | 1.0 | 973 | $1,050 | $1.08 | 21d | 1 | 1.30mi |
| 1303 E Indiana St Evansville, IN | 2.0 | 1.0 | 975 | $1,195 | $1.23 | 14d | 1 | 1.31mi |
| 1321 E Indiana St Evansville, IN | 2.0 | 1.0 | 964 | $1,050 | $1.09 | 14d | 1 | 1.32mi |
| 322 SE 1st St Evansville, IN | 1.0–2.0 | 1.0 | 1100 | $1,700 | $1.55 | 21d | 6 | 1.37mi |
| 202 SE 1st St Evansville, IN | 1.0–2.0 | 1.0 | 926 | $2,449 | $2.64 | 21d | 4 | 1.46mi |
| 210 S Weinbach Ave Evansville, IN | 3.0 | 1.0 | 1080 | $1,450 | $1.34 | 21d | 1 | 1.46mi |
Listing history 15 events
-
2026-06-18days on market $145,000 Active 28 DOM
-
2026-06-17days on market $145,000 Active 27 DOM
-
2026-06-16days on market $145,000 Active 26 DOM
-
2026-06-15days on market $145,000 Active 25 DOM
-
2026-06-14days on market $145,000 Active 23 DOM
-
2026-06-13days on market $145,000 Active 22 DOM
-
2026-06-10days on market $145,000 Active 20 DOM
-
2026-06-09days on market $145,000 Active 19 DOM
-
2026-06-08days on market $145,000 Active 18 DOM
-
2026-06-07days on market $145,000 Active 17 DOM
-
2026-06-02days on market $145,000 Active 12 DOM
-
2026-06-01days on market $145,000 Active 11 DOM
-
2026-05-31days on market $145,000 Active 10 DOM
-
2026-05-30days on market $145,000 Active 9 DOM
-
2026-05-21$145,000 Active
ⓘ Source: listings_history table (triggers on properties + properties_extension) + one-shot
backfill from property_details.listing_events for pre-trigger history.
Tax reassessment forecast IN · Partial reset (capped growth)
- Current annual tax
- $480 · $40/mo
- Projected year-2 tax
- $856 · $71/mo
- Expected delta
- +$376/yr (+$31/mo · 78.5%)
ⓘ Screening estimate from a state-policy table — verify with the county assessor before closing.
Climate risk First Street
- Flood 1/10 Low FEMA zone X · 0% chance over 30 yrs
- Wildfire 1/10 Low
- Heat 5/10 Major 7 d/yr ≥107°F today · 19 d/yr by 30 yrs out
- Wind 2/10 Low 3% chance of damaging wind over 30 yrs
- Air quality 3/10 Moderate 3 unhealthy d/yr today · 4 by 30 yrs out
Nearby sold comps map
Loading sold comps map…
Walkable amenities ~0.75 mi
Loading nearby amenities…
Taxation est. · year 1
- Rental income
- $15,659
- − Mortgage interest
- −$8,122
- − Property taxes
- −$480
- − Insurance
- −$725
- − Repairs & maintenance
- −$1,253
- − Management
- −$1,253
- − Depreciation
- −$4,218
- Taxable loss
- −$392
- Est. tax savings @ 24.0%
- +$94
- After-tax cash flow
- $2,135/yr
For passive investors: Depreciation is non-cash, so a rental often shows a tax loss while cash-flowing — sheltering income. Rental losses are passive: they offset passive income freely, and up to $25,000/yr can offset ordinary (W-2) income if you actively participate and your MAGI is under $100k (phasing out to $0 by $150k); unused losses carry forward. On sale, claimed depreciation is recaptured at up to 25%, and gains may owe capital-gains tax (a 1031 exchange can defer both). Figures are a year-1 estimate at your 24.0% rate — not tax advice; consult a CPA.
Schools (NCES district)
- District
- Evansville Vanderburgh School Corporation
- NCES district ID
- 1803450
- Math proficiency
- 36% ▼ -7.00%
- Reading proficiency
- 43% ▼ -3.00%
- Median HH income
- $43,270
- Composite
- 33.41/100
- National rank
- #5471
- State rank
- #153 of 301 in IN
Livability — Evansville
- Score
- 63/100
- State rank
- #416
- US rank
- #15047
Category grades
Schools grade is shown separately in the Schools card above.
Census & demographics
- Census place
- Evansville, IN
- County
- Vanderburgh County · 146,793 people
- City population
- 146,793
- Metro
- Evansville, IN-KY
- Population (ZIP)
- 32,132
- Household income
- $55,910
- Rent vs Own
- Severe rent burden
- 1394.0
Population outlook (Vanderburgh County) Hauer SSP2
- Today (2025)
- 187,038 people
- By 2030
- 188,907 · +1.0%
- By 2040
- 190,272 · +1.7%
- By 2050
- 188,871 · +1.0%
- By 2075
- 180,751 · -3.4%
- By 2100
- 163,015 · -12.8%
Race, ethnicity, and origin ACS 2023
- Neighborhood character
- Predominantly White (71%)
- Race & ethnicity
- White 71% Black 17% Two or more races 6% Hispanic / Latino 6% Asian 1%
- Hispanic origin (detail)
- Mexican 3%
- Common ancestry
- Italian 3% Lithuanian 2% Slovak 1%
- Foreign-born
- 6% · Canada, China
- Languages at home
- 92% English-only · Spanish 4% Other Asian/Pacific 1% French/Haitian/Cajun 1%
Political lean MEDSL · Vanderburgh
- 2024 margin
- R (+12.7) · D 43.0% · R 55.6% · Other 1.4%
- 2008→2024 swing
- -15.1pp toward R · 2008: 2.5pp · 2024: -12.7pp
- All cycles
- 2024: R+12.7 2020: R+9.6 2016: R+16.9 2012: R+10.8 2008: D+2.5
Not yet ingested
- Civics
- —
Market trends
- HPI YoY
- ▼ -124.80%
- Current HPI
- 211.1755
- Rent YoY
- ▲ 7.86%
- Metro
- Evansville, IN-KY
- State GDP YoY
- ▲ 2.90%
- F500 in state
- 18
Industry mix (Fortune 500 HQ in IN)
| Industry | F500 HQs | Revenue |
|---|---|---|
| Industrial Machinery | 2 | $37B |
|
||
| Healthcare | 1 | $177B |
|
||
| Pharmaceuticals | 1 | $45B |
|
||
| Metals / Steel | 1 | $18B |
|
||
| Agriculture | 1 | $17B |
|
||
| Packaging | 1 | $12B |
|
||
Price history
1 event — show timeline
- 2026-05-21 Listed $145,000 IRMLS
Property tax history
+2.2%/yrLatest (2024): $480 · -14.0% YoY. Source: county tax records.
Cash-flow waterfall
monthlySold comps — $/sqft
last 12 mo · ≤1 miLoading sold comps…