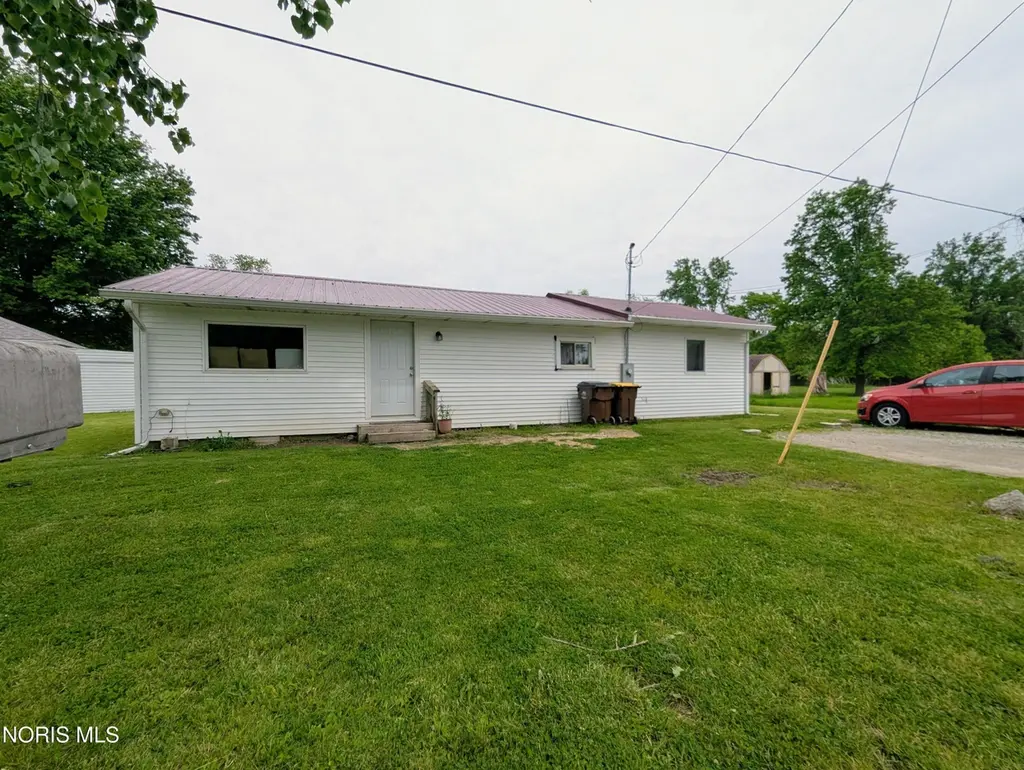
1207 Thurman St · Defiance, OH
Flood risk 1/10 · Minimal
- FEMA flood zone
- X (unshaded)
- Chance of flooding over 30 yrs
- 0.0%
- Est. flood insurance / yr
- $507 – $1,088
Fire risk 1/10 · Minimal
- Est. fire insurance / yr
- $713 – $1,323
Heat risk 3/10 · Minor
- Hot days now (above 99°F)
- 7 days/yr
- Hot days in 30 yrs
- 17 days/yr
Wind risk 2/10 · Minimal
- Chance of severe wind over 30 yrs
- —
Air-quality risk 2/10 · Minimal
- Unhealthy air days now
- 1 days/yr
- Unhealthy air days in 30 yrs
- 2 days/yr
Risk factors via First Street. Map © Google.
Why this score? — see what drove the B- grade
The composite is a weighted blend of 9 inputs, each scored 0–100. Each bar is that input's sub-score; the figure is the points it added to the 100-point composite (weight × sub-score).
- Cash flow +24.5/30.0
- ARV discount +15.0/15.0
- DSCR +7.9/10.0
- 1% rule +6.0/10.0
- Schools +4.2/10.0
- Livability +3.6/5.0
- Rent growth +2.5/5.0
- Condition / age +2.5/5.0
- Appreciation +0.0/10.0
$79,900
🖨 Deal sheet 📄 Offer letter ✓ Due diligence
Listing remarks MLS
Super cute New kitchen, front step and back steps, windows, siding, new metal roof, new carpet, laminate flooring, new walls,ceilings, fresh paint, new sinks, tubs and toilets, plumbing, lighting, furnace, sump pump and pit.
Key facts
- Laundry mud room
- Access to backyard
- Dead-end street
Tags
Property features AI
Exterior
- Parking: Off-street parking on gravel
- Utilities: Public water; Sanitary sewer (connected)
- Home design: Single-family residence; One story
- Construction: Vinyl siding; Crawl space foundation; Built as a residential single family home
- Exterior features: Metal roof; No throughway road frontage
Interior
- Kitchen: Eat-in kitchen; Electric range; Refrigerator; Water heater
- Bedrooms: Three bedrooms on the main level (approx. 11x14; 10x12; 10x10)
- Flooring: Carpet; Laminate
- Bathrooms: 2 full bathrooms
- Heating & cooling: Electric forced air heating
- Interior features: Open floorplan; Primary bathroom
- Laundry & utility: Laundry on main level
Neighborhood map
What this means for you Summary
Snapshot
- This is a 4-bed/1.0-bath single-family listed at $80k.
Deal economics
- At list price, monthly cash flow is $164 ($2k/yr) — positive.
- The deal already cash-flows at list — no discount required.
- Meets the 1% rule at list price ($876 rent vs $80k).
- Cap rate 8.8% vs local median 2.5% in Defiance — top-decile yield for the area; either an underpriced asset or a hidden risk that comps aren't pricing in. Stress-test before assuming the spread holds.
Location & tenants
- Location reads 71/100 on livability (#448 in OH) — a middle-class / working-renter tenant base. Strengths: cost of living A+, housing A+, crime B+; Watch: employment D, amenities F, commute F.
- Defiance City (town): math 48% / reading 51% proficiency, ranked #449 of 656 in OH (top 68%) — families likely to look elsewhere, expect single-tenant / working-renter base with shorter leases.
- Zoned schools: Defiance Elementary School (math 58% / reading 50%, grade C, #829 of 1,584 statewide, top 53%, 1,044 students, 65% FRL); Defiance Middle School (math 42% / reading 49%, grade D+, #467 of 654 statewide, top 72%, 586 students, 54% FRL); Defiance High School (math 37% / reading 57%, grade D-, #435 of 781 statewide, top 59%, 709 students, 45% FRL).
- Market conditions: 135 active listings in the ZIP; 41 units permitted in Defiance County in 2024 (0 in 5+ unit buildings).
- This rent is only 15% of the median local income ($72k/yr) — well below the 30% rent-burden line; pricing power to push rent on renewal without tenant pushback.
Forward outlook
- Local home prices are declining (-3.0%/yr); year-one equity from $552 of loan paydown is wiped out by about $2k of value loss. Plan a longer hold.
- Defiance County population projected at -16% by 2050 — secular population decline; favor cash flow + early exit over multi-decade hold.
Negotiation context
- Only 2 days on market — expect competitive offers; lowballing is unlikely to land.
- 4 sale attempts since 12y ago with the ask held roughly flat each time — persistent listings suggest the price (not the market) is what's stuck; bring a comps-based counter.
Questions for the listing agent
- Built in 1962 — when were the roof, HVAC, electrical panel, plumbing, and water heater last replaced?
- Is there a deadline driving the sale (1031 exchange, divorce, estate, relocation)? That informs how much negotiation room exists.
- Schools are B-rated — typically a magnet for longer-tenancy family renters. What's the average tenant stay here, and is there a school-zone premium baked into asking?
- What's the average days-on-market for RENTAL listings here right now (not sales)? A rising rental-DOM trend means longer vacancies and softer asking-rent achievability than the comps imply.
- What's the recent tenant-quality profile in this submarket — average credit score on applications, eviction rate, late-payment / NSF rate, and stable-employment percentage? A property-management company in the area should have these aggregated.
- How much new for-sale + rental construction is in the pipeline within 1–3 miles? Heavy new supply typically softens prices + rents 12–24 months out; constrained supply supports both.
Investment metrics
- 1% rule
- 1.10% ✓
- Cap rate
- 8.75%
- Cash-on-cash
- 8.78%
- DSCR
- 1.39
- GRM
- 7.6
CMA / ARV
- ARV (on-the-fly)
- $147,686
- Comps found
- 10
Show comp detail 10 sales within ~0.75 mi
| Address | Dist | Beds/Ba | Sqft | Sold | Price | $/sf | Match |
|---|---|---|---|---|---|---|---|
| 1275 Myrna St | 0.09mi | 3/1.0 (-1) | 1,078 (0%) | 2mo | $125,000 | $116 | 89 |
| 1122 Ottawa Ave | 0.15mi | 3/2.0 (-1) | 1,120 (+4%) | 1mo | $153,000 | $137 | 77 |
| 905 Hees Ct | 0.49mi | 3/1.0 (-1) | 1,040 (-4%) | 4mo | $135,000 | $130 | 63 |
| 1116 Ottawa Ave | 0.21mi | 3/1.0 (-1) | 950 (-12%) | 4mo | $140,000 | $147 | 62 |
| 840 Karnes Ave | 0.43mi | 3/1.0 (-1) | 920 (-15%) | 1mo | $96,000 | $104 | 50 |
| 512 Tiedeman Ave | 0.71mi | 3/1.5 (-1) | 960 (-11%) | 2mo | $150,000 | $156 | 40 |
| 907 Columbus Ave | 0.43mi | 3/1.0 (-1) | 951 (-12%) | 20mo | $131,000 | $138 | 39 |
| 430 Rulf St | 0.51mi | 3/1.0 (-1) | 1,194 (+11%) | 21mo | $145,000 | $121 | 36 |
| 122 Squires Ave | 0.67mi | 4/1.0 | 942 (-13%) | 15mo | $134,900 | $143 | 35 |
| 420 Highland St | 0.75mi | 3/1.5 (-1) | 935 (-13%) | 6mo | $120,000 | $128 | 31 |
Match score weights: distance 35% · size 25% · config 20% · recency 20%. Top-matched comps best support the ARV.
Projected returns pro-forma
-3.0% appreciation · 3.0% rent growth · sell at horizon
- IRR
- -3.0%
- Equity multiple
- 0.89×
- Total profit
- $-2,526
- Equity at exit
- $11,913
- IRR
- 6.7%
- Equity multiple
- 1.50×
- Total profit
- $11,217
- Equity at exit
- $6,908
Cash invested: $22,372 (down + closing). Projections, not guarantees.
Landlord ↔ Tenant lean methodology
- Overall (STATE)
- 73 Landlord-Friendly
- State Ohio
- 73 Landlord-Friendly · R+6
- County
- — inherits STATE
- City
- — inherits STATE
ZIP-level market 43512
- Home prices YoY
- -24.3%
- Active inventory
- 135
- Price-to-rent
- 7.6×
Monthly cashflow live
- Estimated rent
- $876 medium interval (Pro) →
- Mortgage (P&I)
- −$419
- Tax from tax record
- −$76 /mo · $915/yr
- Insurance
- −$33
- HOA
- −$0
- Vacancy / Maint / Mgmt
- −$184
- Net cashflow
- $164
Break-even live
UW: 25.0% down · 7.5% · 30yr · 1.5% tax · 5.0% vac · 8.0% maint · 8.0% mgmt
Financing live
Cash to close
- Down payment
- $19,975
- Closing costs
- $2,397
- Reserves months
- —
- Total cash needed
- —
Loan-product check · same deal, 3 products live
Conventional
25% down · 7.5% · 30yr
- Down + closing
- —
- Monthly P&I
- —
- Monthly cashflow
- —
- DSCR
- —
- Eligible?
- —
Personal DTI + credit; lowest rate.
DSCR
20% down · 8.5% · 30yr
- Down + closing
- —
- Monthly P&I
- —
- Monthly cashflow
- —
- DSCR
- —
- Eligible?
- —
No personal income docs; deal must DSCR.
Hard money
10% down · 12.0% · 12mo
- Down + closing
- —
- Monthly P&I
- —
- Monthly cashflow
- —
- DSCR
- —
- Eligible?
- —
Short-term bridge; refi at stabilization.
Listing history 14 events
-
2026-05-31status $79,900 Pending 2 DOM
-
2026-05-31days on market $79,900 Active 2 DOM
-
2026-05-28$79,900 Active
-
2025-10-13price $18,000
-
2019-08-29soldstatus $78,000 224-char remark
Show marketing remark (224 chars)
Super cute New kitchen, front step and back steps, windows, siding, new metal roof, new carpet, laminate flooring, new walls,ceilings, fresh paint, new sinks, tubs and toilets, plumbing, lighting, furnace, sump pump and pit.
-
2019-08-29soldstatus $78,000
Show marketing remark (224 chars)
Super cute New kitchen, front step and back steps, windows, siding, new metal roof, new carpet, laminate flooring, new walls,ceilings, fresh paint, new sinks, tubs and toilets, plumbing, lighting, furnace, sump pump and pit.
-
2019-07-18$78,000 224-char remark
Show marketing remark (224 chars)
Super cute New kitchen, front step and back steps, windows, siding, new metal roof, new carpet, laminate flooring, new walls,ceilings, fresh paint, new sinks, tubs and toilets, plumbing, lighting, furnace, sump pump and pit.
-
2016-01-05soldstatus $19,148
-
2015-03-13soldstatus $18,000
-
2015-03-12price $22,000
-
2015-02-03$22,000
-
2015-01-20historical
-
2014-08-05$26,000
-
1998-05-18soldstatus $17,000
ⓘ Source: listings_history table (triggers on properties + properties_extension) + one-shot
backfill from property_details.listing_events for pre-trigger history.
Tax reassessment forecast OH · Partial reset (capped growth)
- Current annual tax
- $915 · $76/mo
- Projected year-2 tax
- $1,081 · $90/mo
- Expected delta
- +$166/yr (+$14/mo · 18.1%)
ⓘ Screening estimate from a state-policy table — verify with the county assessor before closing.
Climate risk First Street
- Flood 1/10 Low FEMA zone X (unshaded) · 0% chance over 30 yrs
- Wildfire 1/10 Low
- Heat 3/10 Moderate 7 d/yr ≥99°F today · 17 d/yr by 30 yrs out
- Wind 2/10 Low
- Air quality 2/10 Low 1 unhealthy d/yr today · 2 by 30 yrs out
Nearby sold comps map
Loading sold comps map…
Walkable amenities ~0.75 mi
Loading nearby amenities…
Taxation est. · year 1
- Rental income
- $10,514
- − Mortgage interest
- −$4,476
- − Property taxes
- −$915
- − Insurance
- −$400
- − Repairs & maintenance
- −$841
- − Management
- −$841
- − Depreciation
- −$2,324
- Taxable income
- $718
- Est. tax owed @ 24.0%
- −$172
- After-tax cash flow
- $1,792/yr
For passive investors: Depreciation is non-cash, so a rental often shows a tax loss while cash-flowing — sheltering income. Rental losses are passive: they offset passive income freely, and up to $25,000/yr can offset ordinary (W-2) income if you actively participate and your MAGI is under $100k (phasing out to $0 by $150k); unused losses carry forward. On sale, claimed depreciation is recaptured at up to 25%, and gains may owe capital-gains tax (a 1031 exchange can defer both). Figures are a year-1 estimate at your 24.0% rate — not tax advice; consult a CPA.
Schools (NCES district)
- District
- Defiance City
- NCES district ID
- 3904386
- Math proficiency
- 48% ▼ -10.00%
- Reading proficiency
- 51% ▼ -9.00%
- Median HH income
- $44,700
- Composite
- 41.86/100
- National rank
- #3375
- State rank
- #449 of 656 in OH
Livability — Defiance
- Score
- 71/100
- State rank
- #448
- US rank
- #7316
Category grades
Schools grade is shown separately in the Schools card above.
Census & demographics
- Census place
- Defiance, OH
- County
- Defiance · 37,898 people
- City population
- 27,894
- Population (ZIP)
- 27,894
- Household income
- $72,082
- Rent vs Own
- Severe rent burden
- 7.6
Population outlook (Defiance County) Hauer SSP2
- Today (2025)
- 37,051 people
- By 2030
- 36,013 · -2.8%
- By 2040
- 33,583 · -9.4%
- By 2050
- 31,309 · -15.5%
- By 2075
- 26,980 · -27.2%
- By 2100
- 23,416 · -36.8%
Race, ethnicity, and origin ACS 2023
- Neighborhood character
- Predominantly White (83%)
- Race & ethnicity
- White 83% Hispanic / Latino 12% Two or more races 7% Black 2%
- Hispanic origin (detail)
- Mexican 10% Puerto Rican 1%
- Common ancestry
- Lithuanian 2% Slovak 2% Italian 1%
- Foreign-born
- 1% · Canada
- Languages at home
- 95% English-only · Spanish 4%
Political lean MEDSL · Defiance
- 2024 margin
- Solid R (+39.9) · D 29.6% · R 69.5%
- 2008→2024 swing
- -29.4pp toward R · 2008: -10.5pp · 2024: -39.9pp
- All cycles
- 2024: R+39.9 2020: R+36.4 2016: R+34.8 2012: R+14.1 2008: R+10.5
Not yet ingested
- Civics
- —
Market trends
- HPI YoY
- ▼ -67.33%
- Current HPI
- 210.2352
- Rent YoY
- —
- Metro
- —
- State GDP YoY
- ▲ 1.98%
- F500 in state
- 48
Industry mix (Fortune 500 HQ in OH)
| Industry | F500 HQs | Revenue |
|---|---|---|
| Insurance | 3 | $145B |
|
||
| Industrial Machinery | 3 | $49B |
|
||
| Financial Services | 3 | $24B |
|
||
| Consumer Goods | 2 | $93B |
|
||
| Aerospace / Defense | 2 | $47B |
|
||
| Utilities | 2 | $33B |
|
||
Price history
+370.0% since first listed12 events — show timeline
- 2026-05-28 Listed $79,900 NORIS
- 2025-10-13 Price Changed $18,000 NORIS
- 2019-08-29 Sold (Public Records) $78,000 Public Records
- 2019-08-29 Sold (MLS) $78,000 NORIS
- 2019-07-18 Listed $78,000 NORIS
- 2016-01-05 Sold (Public Records) $19,148 Public Records
- 2015-03-13 Sold (MLS) $18,000 NORIS
- 2015-03-12 Price Changed $22,000 NORIS
- 2015-02-03 Listed $22,000 NORIS
- 2015-01-20 Listing Removed — NORIS
- 2014-08-05 Listed $26,000 NORIS
- 1998-05-18 Sold (Public Records) $17,000 Public Records
Property tax history
+4.1%/yrLatest (2025): $915 · +1.5% YoY. Source: county tax records.
Cash-flow waterfall
monthlySold comps — $/sqft
last 12 mo · ≤1 miLoading sold comps…