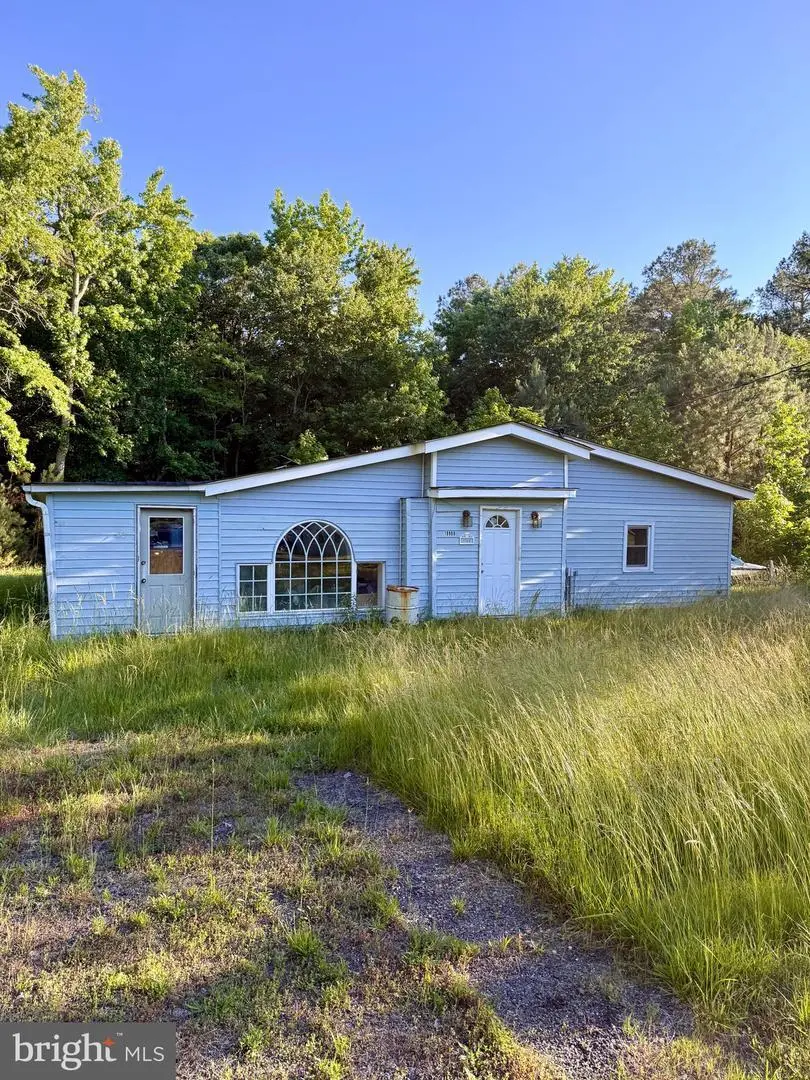
19980 Courtneyville Rd · Lexington Park, MD
Flood risk No data
- FEMA flood zone
- —
- Chance of flooding over 30 yrs
- —
- Est. flood insurance / yr
- —
Fire risk No data
- Est. fire insurance / yr
- —
Heat risk No data
- Hot days now (above threshold)
- —
- Hot days in 30 yrs
- —
Wind risk No data
- Chance of severe wind over 30 yrs
- —
Air-quality risk No data
- Unhealthy air days now
- —
- Unhealthy air days in 30 yrs
- —
Risk factors via First Street. Map © Google.
Why this score? — see what drove the B grade
The composite is a weighted blend of 9 inputs, each scored 0–100. Each bar is that input's sub-score; the figure is the points it added to the 100-point composite (weight × sub-score).
- Cash flow +30.0/30.0
- 1% rule +10.0/10.0
- DSCR +10.0/10.0
- ARV discount +7.5/15.0
- Appreciation +5.4/10.0
- Livability +3.1/5.0
- Schools +3.0/10.0
- Rent growth +2.5/5.0
- Condition / age +2.5/5.0
$100,000
🖨 Deal sheet 📄 Offer letter ✓ Due diligence
Listing remarks MLS
bed, 2 bath home located Courtneyville, MD. This home would be great for a contractor / investor. The home is in need of majorupdates and repairs. Please ENTER THE HOME WITH CAUTION / ENTER AT YOUR OWN RISK. Property
Key facts
- 0.33 acre lot
- Built 1966
- Listed 9 days
Property features AI
Finance
- Financial info: Improvement assessed at $1,500; Land assessed at $98,600; Tax assessed value $100,100 (2025); County tax / annual tax $960
Exterior
- Parking: Driveway
- Utilities: Other water source; Power and utility details not specified
- Home design: Detached structure; Fee simple ownership; Assessor-listed year built source
- Construction: Slab foundation; 1,956 finished above-grade square footage (assessor)
- Exterior features: Not in tidal water area; Above-grade and below-grade other structures
Interior
- Bedrooms: 3 bedrooms on the main level
- Bathrooms: 2 full bathrooms on the main level; 2 full bathrooms total
- Heating & cooling: Other heating; Other cooling; Other hot water
- Interior features: Assessor-listed living area; No basement
Neighborhood map
What this means for you Summary
Snapshot
- This is a 3-bed/2.0-bath single-family listed at $100k.
Deal economics
- At list price, monthly cash flow is $603 ($7k/yr) — positive.
- The deal already cash-flows at list — no discount required.
- Meets the 1% rule at list price ($2k rent vs $100k).
- Cap rate 13.5% vs local median 4.0% in Lexington Park — top-decile yield for the area; either an underpriced asset or a hidden risk that comps aren't pricing in. Stress-test before assuming the spread holds.
Location & tenants
- Location reads 61/100 on livability (#331 in MD) — a middle-class / working-renter tenant base. Strengths: employment A+, housing A; Watch: crime F, amenities F, commute F.
- St. Mary'S County Public Schools (rural): math 23% / reading 38% proficiency, ranked #8 of 24 in MD (top 33%) — families likely to look elsewhere, expect single-tenant / working-renter base with shorter leases.
- Zoned schools: Spring Ridge Middle (math 15% / reading 39%, grade F, #81 of 225 statewide, top 38%, 987 students, 60% FRL); Great Mills High (math 42% / reading 55%, grade D, #111 of 222 statewide, top 50%, 1,779 students, 55% FRL) — zoned schools average 58% FRL vs 28% district-wide (30 pts higher); higher-poverty schools than district average — tighter screening recommended.
- Market conditions: 4 active listings in the ZIP; 265 units permitted in St. Mary's County in 2024 (0 in 5+ unit buildings).
Forward outlook
- In year one you build about $2k of equity ($691 loan paydown + $826 appreciation (0.8% local appreciation)).
- St. Mary's County population projected at +16% by 2050 — long-run rental-demand tailwind backs the buy-and-hold thesis.
- At projected returns (0.8% appreciation + 3.0% rent growth), your $28k cash investment doubles in ~4 years — after that, you're playing with house money.
Negotiation context
- Only 10 days on market — expect competitive offers; lowballing is unlikely to land.
- 15 sale attempts since 9y ago with the ask held roughly flat each time — persistent listings suggest the price (not the market) is what's stuck; bring a comps-based counter.
- Current owner paid $12k; list at $100k implies a 733% gain — meaningful room to come down on a strong offer.
Questions for the listing agent
- Built in 1966 — when were the roof, HVAC, electrical panel, plumbing, and water heater last replaced?
- Is there a deadline driving the sale (1031 exchange, divorce, estate, relocation)? That informs how much negotiation room exists.
- Schools are D-rated, which usually means shorter tenancies and higher turnover. Who's the typical renter profile here, and what's been the actual vacancy rate?
- Crime grade is F in this area — have there been break-ins, vandalism, or insurance claims at this property in the last 3 years? What carrier currently insures it and at what premium?
- What's the average days-on-market for RENTAL listings here right now (not sales)? A rising rental-DOM trend means longer vacancies and softer asking-rent achievability than the comps imply.
- What's the recent tenant-quality profile in this submarket — average credit score on applications, eviction rate, late-payment / NSF rate, and stable-employment percentage? A property-management company in the area should have these aggregated.
- How much new for-sale + rental construction is in the pipeline within 1–3 miles? Heavy new supply typically softens prices + rents 12–24 months out; constrained supply supports both.
Investment metrics
- 1% rule
- 1.61% ✓
- Cap rate
- 13.52%
- Cash-on-cash
- 25.82%
- DSCR
- 2.15
- GRM
- 5.2
CMA / ARV
- ARV (on-the-fly)
- $481,176
- Comps found
- 2
Show comp detail 2 sales within ~0.75 mi
| Address | Dist | Beds/Ba | Sqft | Sold | Price | $/sf | Match |
|---|---|---|---|---|---|---|---|
| 18145 Point Lookout Rd | 0.45mi | 3/2.0 | 1,768 (-10%) | 8mo | $435,000 | $246 | 57 |
| 20220 Gilliam Dr | 0.73mi | 3/3.0 | 2,080 (+6%) | 23mo | $425,000 | $204 | 32 |
Match score weights: distance 35% · size 25% · config 20% · recency 20%. Top-matched comps best support the ARV.
Projected returns pro-forma
0.83% appreciation · 3.0% rent growth · sell at horizon
- IRR
- 27.7%
- Equity multiple
- 2.41×
- Total profit
- $39,409
- Equity at exit
- $33,238
- IRR
- 30.5%
- Equity multiple
- 4.63×
- Total profit
- $101,517
- Equity at exit
- $43,483
Cash invested: $28,000 (down + closing). Projections, not guarantees.
Landlord ↔ Tenant lean methodology
- Overall (STATE)
- 27 Tenant-Leaning
- State Maryland
- 27 Tenant-Leaning · D+14
- County
- — inherits STATE
- City
- — inherits STATE
ZIP-level market 20667
- Home prices YoY
- 0.8%
- Active inventory
- 4
- Price-to-rent
- 5.2×
Monthly cashflow live
- Estimated rent
- $1,608 medium interval (Pro) →
- Mortgage (P&I)
- −$524
- Tax from tax record
- −$102 /mo · $1,222/yr
- Insurance
- −$42
- HOA
- −$0
- Vacancy / Maint / Mgmt
- −$338
- Net cashflow
- $603
Break-even live
UW: 25.0% down · 7.5% · 30yr · 1.5% tax · 5.0% vac · 8.0% maint · 8.0% mgmt
Financing live
Cash to close
- Down payment
- $25,000
- Closing costs
- $3,000
- Reserves months
- —
- Total cash needed
- —
Loan-product check · same deal, 3 products live
Conventional
25% down · 7.5% · 30yr
- Down + closing
- —
- Monthly P&I
- —
- Monthly cashflow
- —
- DSCR
- —
- Eligible?
- —
Personal DTI + credit; lowest rate.
DSCR
20% down · 8.5% · 30yr
- Down + closing
- —
- Monthly P&I
- —
- Monthly cashflow
- —
- DSCR
- —
- Eligible?
- —
No personal income docs; deal must DSCR.
Hard money
10% down · 12.0% · 12mo
- Down + closing
- —
- Monthly P&I
- —
- Monthly cashflow
- —
- DSCR
- —
- Eligible?
- —
Short-term bridge; refi at stabilization.
Listing history 8 events
-
2026-06-19days on market $100,000 Active 10 DOM
-
2026-06-18days on market $100,000 Active 9 DOM
-
2026-06-17days on market $100,000 Active 8 DOM
-
2026-06-16days on market $100,000 Active 7 DOM
-
2026-06-15days on market $100,000 Active 6 DOM
-
2026-06-14days on market $100,000 Active 4 DOM
-
2026-06-12remarks 142-char remark
-
2026-06-12$100,000 Active 3 DOM
ⓘ Source: listings_history table (triggers on properties + properties_extension) + one-shot
backfill from property_details.listing_events for pre-trigger history.
Tax reassessment forecast MD · Partial reset (capped growth)
- Current annual tax
- $1,222 · $102/mo
- Projected year-2 tax
- $1,222 · $102/mo
- Expected delta
- $0/yr ($0/mo · 0.0%)
ⓘ Screening estimate from a state-policy table — verify with the county assessor before closing.
Nearby sold comps map
Loading sold comps map…
Walkable amenities ~0.75 mi
Loading nearby amenities…
Taxation est. · year 1
- Rental income
- $19,297
- − Mortgage interest
- −$5,602
- − Property taxes
- −$1,222
- − Insurance
- −$500
- − Repairs & maintenance
- −$1,544
- − Management
- −$1,544
- − Depreciation
- −$2,909
- Taxable income
- $5,978
- Est. tax owed @ 24.0%
- −$1,435
- After-tax cash flow
- $5,796/yr
For passive investors: Depreciation is non-cash, so a rental often shows a tax loss while cash-flowing — sheltering income. Rental losses are passive: they offset passive income freely, and up to $25,000/yr can offset ordinary (W-2) income if you actively participate and your MAGI is under $100k (phasing out to $0 by $150k); unused losses carry forward. On sale, claimed depreciation is recaptured at up to 25%, and gains may owe capital-gains tax (a 1031 exchange can defer both). Figures are a year-1 estimate at your 24.0% rate — not tax advice; consult a CPA.
Schools (NCES district)
- District
- St. Mary'S County Public Schools
- NCES district ID
- 2400600
- Math proficiency
- 23% ▼ -23.00%
- Reading proficiency
- 38% ▼ -12.00%
- Median HH income
- $83,240
- Composite
- 29.74/100
- National rank
- #6444
- State rank
- #8 of 24 in MD
Livability — Lexington Park
- Score
- 61/100
- State rank
- #331
- US rank
- #17418
Category grades
Schools grade is shown separately in the Schools card above.
Census & demographics
- City population
- 26,852
- Population (ZIP)
- 98
Population outlook (St. Mary's County) Hauer SSP2
- Today (2025)
- 123,125 people
- By 2030
- 128,374 · +4.3%
- By 2040
- 137,305 · +11.5%
- By 2050
- 143,065 · +16.2%
- By 2075
- 153,408 · +24.6%
- By 2100
- 151,790 · +23.3%
Race, ethnicity, and origin ACS 2023
- Neighborhood character
- Predominantly White (100%)
- Race & ethnicity
- White 100%
- Common ancestry
- Slovak 67% Romanian 33%
Political lean MEDSL · St. Mary's
- 2024 margin
- R (+17.2) · D 40.2% · R 57.4% · Other 2.4%
- 2008→2024 swing
- -4.4pp toward R · 2008: -12.8pp · 2024: -17.2pp
- All cycles
- 2024: R+17.2 2020: R+13.8 2016: R+24.6 2012: R+16.1 2008: R+12.8
Not yet ingested
- Civics
- —
Market trends
- HPI YoY
- ▲ 0.83%
- Current HPI
- 110.3314
- Rent YoY
- —
- Metro
- —
- State GDP YoY
- ▲ 2.97%
- F500 in state
- 12
Industry mix (Fortune 500 HQ in MD)
| Industry | F500 HQs | Revenue |
|---|---|---|
| Aerospace / Defense | 1 | $71B |
|
||
| Utilities | 1 | $25B |
|
||
| Hotels | 1 | $24B |
|
||
| Consumer Goods | 1 | $7B |
|
||
| Real Estate | 1 | $6B |
|
||
| Chemicals | 1 | $2B |
|
||
Price history
+26.1% since first listed49 events — show timeline
- 2026-06-09 Listed $100,000 BRIGHT MLS
- 2019-07-24 Sold (MLS) $12,000 BRIGHT MLS
- 2019-07-16 Pending — BRIGHT MLS
- 2019-07-11 Price Changed $13,900 BRIGHT MLS
- 2019-07-03 Relisted — BRIGHT MLS
- 2019-06-13 Pending — BRIGHT MLS
- 2019-05-31 Price Changed $15,900 BRIGHT MLS
- 2019-05-07 Price Changed $17,900 BRIGHT MLS
- 2019-04-06 Price Changed $26,900 BRIGHT MLS
- 2019-04-03 Relisted — BRIGHT MLS
- 2019-04-01 Pending — BRIGHT MLS
- 2019-03-07 Price Changed $29,900 BRIGHT MLS
- 2019-02-07 Price Changed $34,900 BRIGHT MLS
- 2019-01-22 Listed $39,900 BRIGHT MLS
- 2018-12-27 Listing Removed — BRIGHT MLS
- 2018-12-12 Price Changed $43,600 BRIGHT MLS
- 2018-12-06 Relisted — BRIGHT MLS
- 2018-11-10 Pending — BRIGHT MLS
- 2018-11-07 Listing Removed — BRIGHT MLS
- 2018-10-29 Price Changed $43,900 BRIGHT MLS
- 2018-10-10 Price Changed $44,200 BRIGHT MLS
- 2018-10-06 Relisted — BRIGHT MLS
- 2018-10-03 Listing Removed — BRIGHT MLS
- 2018-09-20 Relisted — BRIGHT MLS
- 2018-09-17 Pending — BRIGHT MLS
- 2018-09-14 Listing Removed — BRIGHT MLS
- 2018-09-14 Listing Removed — BRIGHT MLS
- 2018-09-10 Price Changed $44,500 BRIGHT MLS
- 2018-09-06 Relisted — BRIGHT MLS
- 2018-09-05 Listing Removed — BRIGHT MLS
- 2018-08-20 Relisted — BRIGHT MLS
- 2018-08-17 Listing Removed — BRIGHT MLS
- 2018-08-14 Price Changed $55,800 BRIGHT MLS
- 2018-08-10 Relisted — BRIGHT MLS
- 2018-08-08 Listing Removed — BRIGHT MLS
- 2018-07-17 Price Changed $58,700 BRIGHT MLS
- 2018-07-06 Relisted — BRIGHT MLS
- 2018-07-05 Listing Removed — BRIGHT MLS
- 2018-06-20 Price Changed $61,700 BRIGHT MLS
- 2018-06-07 Relisted — BRIGHT MLS
- 2018-06-06 Listing Removed — BRIGHT MLS
- 2018-05-17 Price Changed $64,900 BRIGHT MLS
- 2018-05-05 Relisted — BRIGHT MLS
- 2018-05-02 Listing Removed — BRIGHT MLS
- 2018-04-12 Relisted — BRIGHT MLS
- 2018-04-11 Listing Removed — BRIGHT MLS
- 2018-03-30 Price Changed $74,100 BRIGHT MLS
- 2018-03-22 Price Changed $77,900 BRIGHT MLS
- 2017-11-08 Listed $79,300 BRIGHT MLS
Property tax history
-2.6%/yrLatest (2025): $1,222 · +0.2% YoY. Source: county tax records.
Cash-flow waterfall
monthlySold comps — $/sqft
last 12 mo · ≤1 miLoading sold comps…