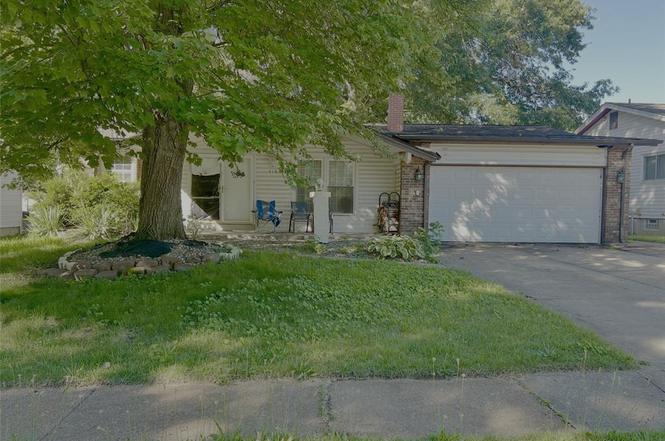
516 Queen Ann Dr · Hazelwood, MO
Flood risk 1/10 · Minimal
- FEMA flood zone
- X (unshaded)
- Chance of flooding over 30 yrs
- 0.0%
- Est. flood insurance / yr
- $473 – $860
Fire risk 1/10 · Minimal
- Est. fire insurance / yr
- $1,054 – $1,958
Heat risk 4/10 · Minor
- Hot days now (above 106°F)
- 7 days/yr
- Hot days in 30 yrs
- 21 days/yr
Wind risk 2/10 · Minimal
- Chance of severe wind over 30 yrs
- 1.0%
Air-quality risk 2/10 · Minimal
- Unhealthy air days now
- 2 days/yr
- Unhealthy air days in 30 yrs
- 2 days/yr
Risk factors via First Street. Map © Google.
Why this score? — see what drove the B- grade
The composite is a weighted blend of 9 inputs, each scored 0–100. Each bar is that input's sub-score; the figure is the points it added to the 100-point composite (weight × sub-score).
- Cash flow +30.0/30.0
- 1% rule +10.0/10.0
- DSCR +10.0/10.0
- ARV discount +7.5/15.0
- Rent growth +3.6/5.0
- Livability +3.1/5.0
- Condition / age +2.5/5.0
- Schools +1.7/10.0
- Appreciation +0.0/10.0
$105,000
🖨 Deal sheet 📄 Offer letter ✓ Due diligence
Listing remarks MLS
Welcome to very spacious family home with 6 Bedrooms and 3 Full Baths! The newly finished basement is has a newly remodeled bath (2015), two large bedrooms with large egress windows (2014). Main Baths remodeled 2013. Water heater 2/2015. Grg door opener 4/2015. The LR features beautiful sliding French doors that partition the DR from the LR for openness or privacy. A large dining/eat-in kitchen area is accommodating for entertaining lg gatherings. Enjoy the 23 x 13 den with atrium windows along the entire wall looking over the back yard. Enjoy entertaining with the enormous deck that has several covered and uncovered seating areas surrounding the above ground 16 x 32 pool with outdoor sound system! Many newer features including the Furnace and Air Conditioner that was installed in 2003 and serviced twice a year consistently. Hot water heater was installed 2/15, pool 2009, SS Refrigerator 2011, SS Dishwasher 2012, Microwave 2014, Roof/2006. This has been one owner's pride and joy!
Key facts
- 8,041 sq ft lot
- 2 garage spots
- Built 1969
Property features AI
Exterior
- Parking: Attached 2-car garage
- Utilities: Public water; Public sewer; Electric service: Ameren
- Home design: Single-family residence; One story; Residential property
- Construction: Aluminum siding; Vinyl siding
- Exterior features: Back yard
Interior
- Bedrooms: Four bedrooms (all on the main level)
- Bathrooms: Two full bathrooms (on the main level)
- Heating & cooling: Forced air heating; Central air conditioning
- Interior features: Full basement; One fireplace
Neighborhood map
What this means for you Summary
Snapshot
- This is a 4-bed/3.0-bath single-family listed at $105k.
Deal economics
- At list price, monthly cash flow is $638 ($8k/yr) — positive.
- The deal already cash-flows at list — no discount required.
- Meets the 1% rule at list price ($2k rent vs $105k).
- Cap rate 13.6% vs local median 7.2% in Hazelwood — top-decile yield for the area; either an underpriced asset or a hidden risk that comps aren't pricing in. Stress-test before assuming the spread holds.
Location & tenants
- Location reads 62/100 on livability (#395 in MO) — a middle-class / working-renter tenant base. Strengths: cost of living A+, housing A+; Watch: crime F, amenities F, commute F.
- Hazelwood (suburban): math 11% / reading 26% proficiency, ranked #306 of 324 in MO (top 94%) — low school quality limits family demand, transient renter base, plan for 1-2y turnover.
- Zoned schools: Mcnair Elem. (math 8% / reading 27%, grade F, #964 of 1,115 statewide, top 87%, 401 students, 66% FRL); Hazelwood West High (math 16% / reading 42%, grade F, #407 of 521 statewide, top 78%, 2,042 students, 54% FRL).
- Market conditions: Rents rising fast (+4.5%/yr); 68 active listings in the ZIP; 11 comparable units currently listed for rent nearby; rentals leasing fast (median 12d on market — plan ~1-2 weeks tenant-placement turnaround); 920 units permitted in St. Louis County in 2024 (250 in 5+ unit buildings).
- At $1,873/mo this rent would consume 45% of the median local household income ($49k/yr) (locally 766% of renters already pay >50% of income on rent) — very limited rent-growth headroom before tenants either downsize or default.
Forward outlook
- Local home prices are declining (-3.0%/yr); year-one equity from $726 of loan paydown is wiped out by about $3k of value loss. Plan a longer hold.
- At projected returns (-3.0% appreciation + 4.5% rent growth), your $29k cash investment doubles in ~5 years — after that, you're playing with house money.
Negotiation context
- Only 1 days on market — expect competitive offers; lowballing is unlikely to land.
- 3 sale attempts since 11y ago with the ask held roughly flat each time — persistent listings suggest the price (not the market) is what's stuck; bring a comps-based counter.
Risks & watch-outs
- Watch-outs: property tax is 2.8% of price.
Questions for the listing agent
- Built in 1969 — when were the roof, HVAC, electrical panel, plumbing, and water heater last replaced?
- Property tax is high relative to price — has the assessment been appealed recently, and will the sale trigger a re-assessment?
- Is there a deadline driving the sale (1031 exchange, divorce, estate, relocation)? That informs how much negotiation room exists.
- Schools are D-rated, which usually means shorter tenancies and higher turnover. Who's the typical renter profile here, and what's been the actual vacancy rate?
- Crime grade is F in this area — have there been break-ins, vandalism, or insurance claims at this property in the last 3 years? What carrier currently insures it and at what premium?
- What's the average days-on-market for RENTAL listings here right now (not sales)? A rising rental-DOM trend means longer vacancies and softer asking-rent achievability than the comps imply.
- What's the recent tenant-quality profile in this submarket — average credit score on applications, eviction rate, late-payment / NSF rate, and stable-employment percentage? A property-management company in the area should have these aggregated.
- How much new for-sale + rental construction is in the pipeline within 1–3 miles? Heavy new supply typically softens prices + rents 12–24 months out; constrained supply supports both.
Investment metrics
- 1% rule
- 1.78% ✓
- Cap rate
- 13.58%
- Cash-on-cash
- 26.03%
- DSCR
- 2.16
- GRM
- 4.7
CMA / ARV
- ARV (on-the-fly)
- $216,628
- Comps found
- 12
Show comp detail 12 sales within ~0.75 mi
| Address | Dist | Beds/Ba | Sqft | Sold | Price | $/sf | Match |
|---|---|---|---|---|---|---|---|
| 1938 Riverwood Trails Dr | 0.45mi | 4/3.0 | 1,672 (-4%) | 0mo | $205,000 | $123 | 71 |
| 1640 Tahoe Dr | 0.50mi | 3/2.0 (-1) | 1,717 (-2%) | 1mo | $228,000 | $133 | 64 |
| 1365 Yaqui Dr | 0.29mi | 3/1.0 (-1) | 1,676 (-4%) | 5mo | $194,000 | $116 | 62 |
| 583 Candle Light Ln | 0.42mi | 3/1.5 (-1) | 1,700 (-3%) | 4mo | $180,000 | $106 | 62 |
| 1528 Coachway Ln | 0.46mi | 3/2.0 (-1) | 1,686 (-4%) | 3mo | $209,500 | $124 | 61 |
| 525 Fox Crest Dr | 0.26mi | 3/2.0 (-1) | 1,922 (+10%) | 2mo | $239,900 | $125 | 60 |
| 630 Lamplight Ln | 0.53mi | 3/3.0 (-1) | 1,647 (-6%) | 2mo | $195,500 | $119 | 59 |
| 1013 Driftwood Trails Dr | 0.66mi | 3/2.5 (-1) | 1,822 (+4%) | 3mo | $279,989 | $154 | 53 |
| 655 Loyola Dr | 0.54mi | 3/1.0 (-1) | 1,600 (-8%) | 2mo | $184,900 | $116 | 46 |
| 39 Radford Dr | 0.68mi | 3/1.0 (-1) | 1,652 (-5%) | 2mo | $194,900 | $118 | 44 |
| 725 Riderwood Dr | 0.70mi | 3/1.5 (-1) | 1,650 (-6%) | 5mo | $209,900 | $127 | 43 |
| 1100 Keeven Ln | 0.63mi | 3/2.0 (-1) | 1,990 (+14%) | 1mo | $280,000 | $141 | 37 |
Match score weights: distance 35% · size 25% · config 20% · recency 20%. Top-matched comps best support the ARV.
Projected returns pro-forma
-3.0% appreciation · 4.45% rent growth · sell at horizon
- IRR
- 21.6%
- Equity multiple
- 1.90×
- Total profit
- $26,468
- Equity at exit
- $15,656
- IRR
- 30.7%
- Equity multiple
- 3.97×
- Total profit
- $87,461
- Equity at exit
- $9,078
Cash invested: $29,400 (down + closing). Projections, not guarantees.
Landlord ↔ Tenant lean methodology
- Overall (STATE)
- 81 Strongly Landlord-Friendly
- State Missouri
- 81 Strongly Landlord-Friendly · R+10
- County
- — inherits STATE
- City
- — inherits STATE
ZIP-level market 63042
- Rents YoY
- 4.5%
- Active inventory
- 68
- Price-to-rent
- 4.7×
Monthly cashflow live
- Estimated rent
- $1,873 high interval (Pro) →
- Mortgage (P&I)
- −$551
- Tax from tax record
- −$247 /mo · $2,970/yr
- Insurance
- −$44
- HOA
- −$0
- Vacancy / Maint / Mgmt
- −$393
- Net cashflow
- $638
Break-even live
UW: 25.0% down · 7.5% · 30yr · 1.5% tax · 5.0% vac · 8.0% maint · 8.0% mgmt
Financing live
Cash to close
- Down payment
- $26,250
- Closing costs
- $3,150
- Reserves months
- —
- Total cash needed
- —
Loan-product check · same deal, 3 products live
Conventional
25% down · 7.5% · 30yr
- Down + closing
- —
- Monthly P&I
- —
- Monthly cashflow
- —
- DSCR
- —
- Eligible?
- —
Personal DTI + credit; lowest rate.
DSCR
20% down · 8.5% · 30yr
- Down + closing
- —
- Monthly P&I
- —
- Monthly cashflow
- —
- DSCR
- —
- Eligible?
- —
No personal income docs; deal must DSCR.
Hard money
10% down · 12.0% · 12mo
- Down + closing
- —
- Monthly P&I
- —
- Monthly cashflow
- —
- DSCR
- —
- Eligible?
- —
Short-term bridge; refi at stabilization.
Rent comps 11 comps
| Address | Beds | Baths | Sqft | Rent | $/sqft | DOM | Units | Dist |
|---|---|---|---|---|---|---|---|---|
| 537 Lynn Haven Ln Hazelwood, MO | 3.0 | 2.0 | 1242 | $1,675 | $1.35 | 23d | 1 | 0.51mi |
| 785 Florland Dr Florissant, MO | 3.0 | 1.0 | 1100 | $1,700 | $1.55 | 17d | 1 | 0.53mi |
| 750 Carriage Ln Hazelwood, MO | 4.0 | 2.0 | 1701 | $2,026 | $1.19 | 11d | 1 | 0.63mi |
| 623 Holiday Ave Hazelwood, MO | 3.0 | 2.0 | 1176 | $1,591 | $1.35 | 12d | 1 | 0.65mi |
| 16 Mary Rose Ct Hazelwood, MO | 3.0 | 2.0 | 1506 | $1,706 | $1.13 | 14d | 1 | 0.68mi |
| 17 Elwood Ct Florissant, MO | 3.0 | 2.0 | 1572 | $1,945 | $1.24 | 1d | 1 | 0.81mi |
| 855 Teson Rd Hazelwood, MO | 3.0 | 2.0 | 1562 | $1,799 | $1.15 | 17d | 1 | 0.99mi |
| 14 Rivermeadows Dr Florissant, MO | 3.0 | 2.0 | 1587 | $2,386 | $1.50 | 14d | 1 | 1.10mi |
| 116 Graham Rd Florissant, MO | 3.0 | 2.0 | 1578 | $1,495 | $0.95 | 1d | 1 | 1.10mi |
| 9 Charlotte Dr Florissant, MO | 3.0 | 1.5 | 1404 | $1,641 | $1.17 | 4d | 1 | 1.36mi |
| 4 Sharon Ct Florissant, MO | 3.0 | 2.0 | 1108 | $1,800 | $1.62 | 2d | 1 | 1.45mi |
Listing history 2 events
-
2026-06-17remarks 236-char remark
-
2026-06-17$105,000 Active 1 DOM
ⓘ Source: listings_history table (triggers on properties + properties_extension) + one-shot
backfill from property_details.listing_events for pre-trigger history.
Tax reassessment forecast MO · Resets to sale price
- Current annual tax
- $2,970 · $247/mo
- Projected year-2 tax
- $2,970 · $247/mo
- Expected delta
- $0/yr ($0/mo · 0.0%)
ⓘ Screening estimate from a state-policy table — verify with the county assessor before closing.
Climate risk First Street
- Flood 1/10 Low FEMA zone X (unshaded) · 0% chance over 30 yrs
- Wildfire 1/10 Low
- Heat 4/10 Moderate 7 d/yr ≥106°F today · 21 d/yr by 30 yrs out
- Wind 2/10 Low 100% chance of damaging wind over 30 yrs
- Air quality 2/10 Low 2 unhealthy d/yr today · 2 by 30 yrs out
Nearby sold comps map
Loading sold comps map…
Walkable amenities ~0.75 mi
Loading nearby amenities…
Taxation est. · year 1
- Rental income
- $22,473
- − Mortgage interest
- −$5,882
- − Property taxes
- −$2,970
- − Insurance
- −$525
- − Repairs & maintenance
- −$1,798
- − Management
- −$1,798
- − Depreciation
- −$3,055
- Taxable income
- $6,447
- Est. tax owed @ 24.0%
- −$1,547
- After-tax cash flow
- $6,104/yr
For passive investors: Depreciation is non-cash, so a rental often shows a tax loss while cash-flowing — sheltering income. Rental losses are passive: they offset passive income freely, and up to $25,000/yr can offset ordinary (W-2) income if you actively participate and your MAGI is under $100k (phasing out to $0 by $150k); unused losses carry forward. On sale, claimed depreciation is recaptured at up to 25%, and gains may owe capital-gains tax (a 1031 exchange can defer both). Figures are a year-1 estimate at your 24.0% rate — not tax advice; consult a CPA.
Schools (NCES district)
- District
- Hazelwood
- NCES district ID
- 2913830
- Math proficiency
- 11% ▼ -13.00%
- Reading proficiency
- 26% ▼ -6.00%
- Median HH income
- $51,621
- Composite
- 16.77/100
- National rank
- #9156
- State rank
- #306 of 324 in MO
Livability — Hazelwood
- Score
- 62/100
- State rank
- #395
- US rank
- #16956
Category grades
Schools grade is shown separately in the Schools card above.
Census & demographics
- Census place
- Hazelwood, MO
- County
- Saint Louis County · 888,823 people
- City population
- 17,813
- Metro
- St. Louis, MO-IL
- Population (ZIP)
- 17,813
- Household income
- $49,453
- Rent vs Own
- Severe rent burden
- 766.0
Population outlook (St. Louis County) Hauer SSP2
- Today (2025)
- 1,025,227 people
- By 2030
- 1,028,023 · +0.3%
- By 2040
- 1,020,940 · -0.4%
- By 2050
- 1,007,280 · -1.8%
- By 2075
- 987,277 · -3.7%
- By 2100
- 921,984 · -10.1%
Race, ethnicity, and origin ACS 2023
- Neighborhood character
- Diverse neighborhood (Simpson 0.64)
- Race & ethnicity
- White 46% Black 38% Two or more races 10% Hispanic / Latino 4% Asian 2%
- Common ancestry
- Lithuanian 3% Romanian 1% Italian 1%
- Foreign-born
- 5% · Canada, Vietnam
- Languages at home
- 94% English-only · Spanish 3% Vietnamese 1% Tagalog/Filipino 1%
Political lean MEDSL · St. Louis
- 2024 margin
- Strong D (+23.4) · D 60.8% · R 37.4% · Other 1.7%
- 2008→2024 swing
- +3.5pp toward D · 2008: 19.9pp · 2024: 23.4pp
- All cycles
- 2024: D+23.4 2020: D+24.0 2016: D+16.2 2012: D+13.7 2008: D+19.9
Not yet ingested
- Civics
- —
Market trends
- HPI YoY
- ▼ -204.48%
- Current HPI
- 234.7353
- Rent YoY
- ▲ 4.45%
- Metro
- St. Louis, MO-IL
- State GDP YoY
- ▲ 1.84%
- F500 in state
- 20
Industry mix (Fortune 500 HQ in MO)
| Industry | F500 HQs | Revenue |
|---|---|---|
| Healthcare | 1 | $163B |
|
||
| Insurance | 1 | $21B |
|
||
| Industrial Technology | 1 | $17B |
|
||
| Retail | 1 | $16B |
|
||
| Industrial Distribution | 1 | $10B |
|
||
| Utilities | 1 | $9B |
|
||
Price history
-34.3% since first listed10 events — show timeline
- 2026-06-17 Listed $105,000 MARIS as Distributed by MLS Grid
- 2015-09-30 Sold (Public Records) $147,000 Public Records
- 2015-09-29 Sold (MLS) — MARIS as Distributed by MLS Grid
- 2015-09-01 Contingent — MARIS as Distributed by MLS Grid
- 2015-08-14 Delisted — MARIS as Distributed by MLS Grid
- 2015-07-23 Contingent — MARIS as Distributed by MLS Grid
- 2015-05-26 Price Changed $149,900 MARIS as Distributed by MLS Grid
- 2015-05-19 Relisted — MARIS as Distributed by MLS Grid
- 2015-05-08 Delisted — MARIS as Distributed by MLS Grid
- 2015-04-21 Listed $159,900 MARIS as Distributed by MLS Grid
Property tax history
+2.0%/yrLatest (2022): $2,970 · +1.7% YoY. Source: county tax records.
Cash-flow waterfall
monthlySold comps — $/sqft
last 12 mo · ≤1 miLoading sold comps…