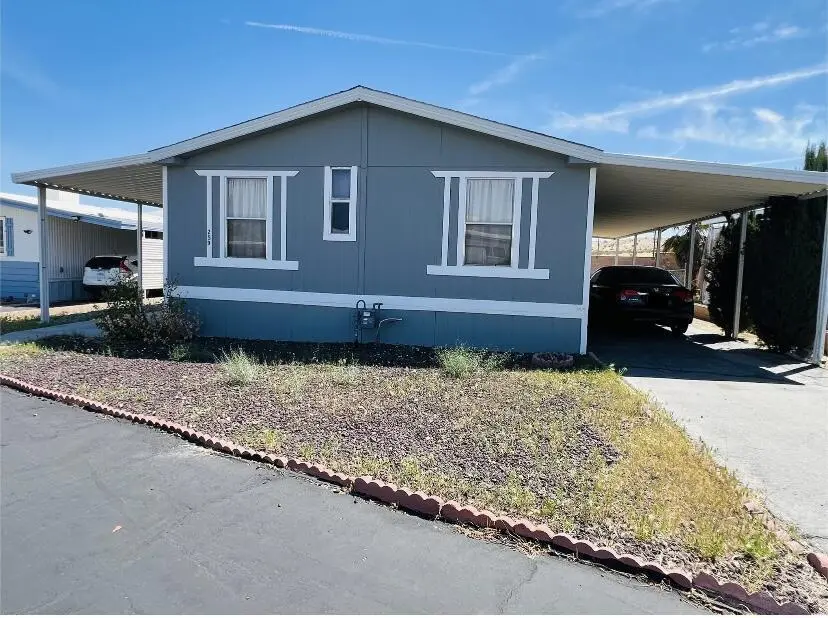
701 Montara Rd #259 · Barstow, CA
Flood risk 1/10 · Minimal
- FEMA flood zone
- X (unshaded)
- Chance of flooding over 30 yrs
- 0.0%
- Est. flood insurance / yr
- $507 – $1,088
Fire risk 4/10 · Minor
- Est. fire insurance / yr
- $659 – $1,223
Heat risk 8/10 · Major
- Hot days now (above 103°F)
- 6 days/yr
- Hot days in 30 yrs
- 17 days/yr
Wind risk 1/10 · Minimal
- Chance of severe wind over 30 yrs
- —
Air-quality risk 6/10 · Moderate
- Unhealthy air days now
- 11 days/yr
- Unhealthy air days in 30 yrs
- 15 days/yr
Risk factors via First Street. Map © Google.
Why this score? — see what drove the B- grade
The composite is a weighted blend of 9 inputs, each scored 0–100. Each bar is that input's sub-score; the figure is the points it added to the 100-point composite (weight × sub-score).
- Cash flow +30.0/30.0
- 1% rule +10.0/10.0
- DSCR +10.0/10.0
- ARV discount +7.5/15.0
- Livability +3.2/5.0
- Rent growth +3.1/5.0
- Condition / age +2.5/5.0
- Schools +1.4/10.0
- Appreciation +0.0/10.0
$63,500
🖨 Deal sheet 📄 Offer letter ✓ Due diligence
Listing remarks MLS
Great three bedroom two bath mobile home located in the Holiday Homes Mobile Home Park on Montara Rd. 1152 square foot home features a split floor plan with a master bedroom on one side and the other two bedrooms on the other. The front door opens up to a great gated deck area with a beautiful view of the Mountains. There is a fenced yard in the back of the home with two entry gates. Association Amenities: Laundry # of RV Spaces: 0 Special Features: Storage ShedFRON, PART Lot Location Type: Standard Location FireplaceFeatures: None Zoning: Residential 1 # of Attached Spaces: 0 # of Detached Spaces: 0 # of RV Spaces: 0
Key facts
- Community clubhouse
- Spa
- Gated park
Tags
Property features AI
Finance
- Other: Listing terms: Conventional, Cash to New Loan, Cash; Sale type: Standard; Property sold as-is
- Financial info: Land is lease type; land lease amount listed as $700 annually
- HOA & community: Senior community; No gated community; Monthly space rent: $625; No monthly association fee reported
Exterior
- Parking: Attached carport; 2 total parking spaces (2 carport spaces)
- Security: Community security
- Utilities: Sewer: Unknown; PUD: No
- Home design: Double-wide mobile home; Single-story; Ground level entry; Built in 1988 (manufacturer date reported)
- Construction: Manufactured by Champion; Mobile home to remain
- Exterior features: Community pool (in-ground); Mountain view; Detached property; Located in a senior park (Holiday Homes)
Interior
- Bedrooms: Ground level
- Flooring: Carpet; Linoleum
- Bathrooms: 2 full bathrooms
- Heating & cooling: Central heating; Air conditioning
- Interior features: Unfurnished; Community security
Neighborhood map
What this means for you Summary
Snapshot
- This is a 3-bed/2.0-bath manufactured listed at $64k.
Deal economics
- At list price, monthly cash flow is $1k ($15k/yr) — positive.
- The deal already cash-flows at list — no discount required.
- Meets the 1% rule at list price ($2k rent vs $64k).
- Recommended offer: $62k (3.0% below list) — sets the bar for market timing.
- Cap rate 29.4% vs local median 4.6% in Barstow — top-decile yield for the area; either an underpriced asset or a hidden risk that comps aren't pricing in. Stress-test before assuming the spread holds.
Location & tenants
- Location reads 63/100 on livability (#444 in CA) — a middle-class / working-renter tenant base. Strengths: commute A+, housing A+; Watch: amenities C-, health & safety C-, schools F.
- Barstow Unified (town): math 11% / reading 22% proficiency, ranked #482 of 517 in CA (top 93%) — low school quality limits family demand, transient renter base, plan for 1-2y turnover; 68% free/reduced lunch — lower-income household profile, screen leases tightly.
- Market conditions: Rents rising (+2.3%/yr); 343 active listings in the ZIP; 8 comparable units currently listed for rent nearby; rentals at typical pace (median 24d on market — plan ~3-4 weeks tenant-placement turnaround); 5,458 units permitted in San Bernardino County in 2024 (1,500 in 5+ unit buildings).
- This rent runs 39% of the median local income ($62k/yr) — at the standard rent-burdened threshold; future hikes will face affordability resistance.
Forward outlook
- Local home prices are declining (-3.0%/yr); year-one equity from $439 of loan paydown is wiped out by about $2k of value loss. Plan a longer hold.
- San Bernardino County population projected at +15% by 2050 — modest demand growth; plan on rents tracking national, not racing it.
- At projected returns (-3.0% appreciation + 2.3% rent growth), your $18k cash investment doubles in ~2 years — after that, you're playing with house money.
Negotiation context
- It's been on market 49 days — a 3% lower offer ($62k) is reasonable based on typical stale-listing flexibility.
- 3 sale attempts since 10y ago with the ask held roughly flat each time — persistent listings suggest the price (not the market) is what's stuck; bring a comps-based counter.
- Current owner paid $17k; list at $64k implies a 274% gain — meaningful room to come down on a strong offer.
Risks & watch-outs
- Climate carrying-cost: extreme-heat days projected 6→17/yr by 2055 (HVAC capex compounding) — expect insurance premiums to compound above CPI over the hold.
Questions for the listing agent
- It's been on market 49 days. Have you received any prior offers? Is the seller open to a 3% concession, seller financing, or rate buy-down credit?
- Is there a deadline driving the sale (1031 exchange, divorce, estate, relocation)? That informs how much negotiation room exists.
- Schools are F-rated, which usually means shorter tenancies and higher turnover. Who's the typical renter profile here, and what's been the actual vacancy rate?
- Crime grade is F in this area — have there been break-ins, vandalism, or insurance claims at this property in the last 3 years? What carrier currently insures it and at what premium?
- What's the average days-on-market for RENTAL listings here right now (not sales)? A rising rental-DOM trend means longer vacancies and softer asking-rent achievability than the comps imply.
- What's the recent tenant-quality profile in this submarket — average credit score on applications, eviction rate, late-payment / NSF rate, and stable-employment percentage? A property-management company in the area should have these aggregated.
- How much new for-sale + rental construction is in the pipeline within 1–3 miles? Heavy new supply typically softens prices + rents 12–24 months out; constrained supply supports both.
Investment metrics
- 1% rule
- 3.18% ✓
- Cap rate
- 29.39%
- Cash-on-cash
- 82.48%
- DSCR
- 4.67
- GRM
- 2.6
CMA / ARV
- ARV (median comp)
- $36,241
- List price
- $63,500
- Delta
- 75.21%
- Verdict
- OVERPRICED
- Comps
- 8 within 1.0 mi
Show comp detail 7 sales within ~0.75 mi
| Address | Dist | Beds/Ba | Sqft | Sold | Price | $/sf | Match |
|---|---|---|---|---|---|---|---|
| 701 Montara Rd #46 | 0.00mi | 2/2.0 (-1) | 1,056 (0%) | 12mo | $50,000 | $47 | 85 |
| 701 Montara Rd #110 | 0.10mi | 2/2.0 (-1) | 1,040 (-2%) | 6mo | $41,000 | $39 | 82 |
| 701 Montara Rd #113 | 0.16mi | 2/2.0 (-1) | 1,040 (-2%) | 6mo | $18,000 | $17 | 80 |
| 701 Montara Rd #261 | 0.00mi | 3/2.0 | 1,080 (+2%) | 22mo | $24,000 | $22 | 78 |
| 701 Montara Rd #122 | 0.10mi | 2/2.0 (-1) | 1,030 (-2%) | 13mo | $32,000 | $31 | 75 |
| 701 Montara Rd #227 | 0.00mi | 2/2.0 (-1) | 1,152 (+9%) | 13mo | $12,000 | $10 | 69 |
| 701 Montara Rd #77 | 0.10mi | 2/2.0 (-1) | 1,160 (+10%) | 17mo | $29,900 | $26 | 59 |
Match score weights: distance 35% · size 25% · config 20% · recency 20%. Top-matched comps best support the ARV.
Projected returns pro-forma
-3.0% appreciation · 2.32% rent growth · sell at horizon
- IRR
- 82.0%
- Equity multiple
- 4.72×
- Total profit
- $66,160
- Equity at exit
- $9,468
- IRR
- 85.2%
- Equity multiple
- 9.56×
- Total profit
- $152,239
- Equity at exit
- $5,490
Cash invested: $17,780 (down + closing). Projections, not guarantees.
Landlord ↔ Tenant lean methodology
- Overall (STATE)
- 18 Strongly Tenant-Friendly
- State California
- 18 Strongly Tenant-Friendly · D+13
- County
- — inherits STATE
- City
- — inherits STATE
ZIP-level market 92311
- Home prices YoY
- -30.6%
- Rents YoY
- 2.3%
- Active inventory
- 343
- Price-to-rent
- 2.6×
Monthly cashflow live
- Estimated rent
- $2,018 high interval (Pro) →
- Mortgage (P&I)
- −$333
- Tax from tax record
- −$12 /mo · $149/yr
- Insurance
- −$26
- HOA
- −$0
- Vacancy / Maint / Mgmt
- −$424
- Net cashflow
- $1,222
Break-even live
UW: 25.0% down · 7.5% · 30yr · 1.5% tax · 5.0% vac · 8.0% maint · 8.0% mgmt
Financing live
Cash to close
- Down payment
- $15,875
- Closing costs
- $1,905
- Reserves months
- —
- Total cash needed
- —
Loan-product check · same deal, 3 products live
Conventional
25% down · 7.5% · 30yr
- Down + closing
- —
- Monthly P&I
- —
- Monthly cashflow
- —
- DSCR
- —
- Eligible?
- —
Personal DTI + credit; lowest rate.
DSCR
20% down · 8.5% · 30yr
- Down + closing
- —
- Monthly P&I
- —
- Monthly cashflow
- —
- DSCR
- —
- Eligible?
- —
No personal income docs; deal must DSCR.
Hard money
10% down · 12.0% · 12mo
- Down + closing
- —
- Monthly P&I
- —
- Monthly cashflow
- —
- DSCR
- —
- Eligible?
- —
Short-term bridge; refi at stabilization.
Rent comps 8 comps
| Address | Beds | Baths | Sqft | Rent | $/sqft | DOM | Units | Dist |
|---|---|---|---|---|---|---|---|---|
| 800 Arbor Way Barstow, CA | 3.0 | 2.0 | 1000 | $2,500 | $2.50 | 24d | 1 | 0.14mi |
| 1801 Rimrock Rd Barstow, CA | 1.0–2.0 | 1.0–2.0 | 775 | $1,810 | $2.34 | 1d | 6 | 0.31mi |
| 332 Date Ave Barstow, CA | 4.0 | 2.0 | 1144 | $1,950 | $1.70 | 43d | 1 | 0.78mi |
| 751 Upton Dr Unit 2 Barstow, CA | 2.0 | 1.0 | 800 | $1,295 | $1.62 | 18d | 1 | 1.01mi |
| 761 Upton Dr Unit C Barstow, CA | 2.0 | 1.0 | 800 | $1,199 | $1.50 | 5d | 1 | 1.01mi |
| 810 Starlight St Barstow, CA | 3.0 | 2.0 | 1430 | $1,895 | $1.33 | 43d | 1 | 1.38mi |
| 937 E Elizabeth St Barstow, CA | 4.0 | 1.0 | 1422 | $2,195 | $1.54 | 4d | 1 | 1.39mi |
| 945 Carson St Barstow, CA | 2.0 | 1.0 | 800 | $1,300 | $1.62 | 43d | 1 | 1.43mi |
Listing history 19 events
-
2026-06-18days on market $63,500 Active 49 DOM
-
2026-06-17days on market $63,500 Active 48 DOM
-
2026-06-16days on market $63,500 Active 47 DOM
-
2026-06-15days on market $63,500 Active 46 DOM
-
2026-06-13days on market $63,500 Active 44 DOM
-
2026-06-13days on market $63,500 Active 43 DOM
-
2026-06-09days on market $63,500 Active 40 DOM
-
2026-06-08days on market $63,500 Active 39 DOM
-
2026-06-07days on market $63,500 Active 38 DOM
-
2026-06-04days on market $63,500 Active 35 DOM
-
2026-06-03days on market $63,500 Active 34 DOM
-
2026-06-02days on market $63,500 Active 33 DOM
-
2026-06-01days on market $63,500 Active 32 DOM
-
2026-05-31days on market $63,500 Active 31 DOM
-
2026-04-28$63,500 Active 317-char remark
-
2025-12-25historical
-
2025-05-22$90,000 Active
-
2016-09-16soldstatus $17,000
Show marketing remark (627 chars)
Great three bedroom two bath mobile home located in the Holiday Homes Mobile Home Park on Montara Rd. 1152 square foot home features a split floor plan with a master bedroom on one side and the other two bedrooms on the other. The front door opens up to a great gated deck area with a beautiful view of the Mountains. There is a fenced yard in the back of the home with two entry gates. Association Amenities: Laundry # of RV Spaces: 0 Special Features: Storage ShedFRON, PART Lot Location Type: Standard Location FireplaceFeatures: None Zoning: Residential 1 # of Attached Spaces: 0 # of Detached Spaces: 0 # of RV Spaces: 0
-
2016-03-09$19,995
Show marketing remark (627 chars)
Great three bedroom two bath mobile home located in the Holiday Homes Mobile Home Park on Montara Rd. 1152 square foot home features a split floor plan with a master bedroom on one side and the other two bedrooms on the other. The front door opens up to a great gated deck area with a beautiful view of the Mountains. There is a fenced yard in the back of the home with two entry gates. Association Amenities: Laundry # of RV Spaces: 0 Special Features: Storage ShedFRON, PART Lot Location Type: Standard Location FireplaceFeatures: None Zoning: Residential 1 # of Attached Spaces: 0 # of Detached Spaces: 0 # of RV Spaces: 0
ⓘ Source: listings_history table (triggers on properties + properties_extension) + one-shot
backfill from property_details.listing_events for pre-trigger history.
Tax reassessment forecast CA · Resets to sale price
- Current annual tax
- $149 · $12/mo
- Projected year-2 tax
- $483 · $40/mo
- Expected delta
- +$334/yr (+$28/mo · 224.2%)
ⓘ Screening estimate from a state-policy table — verify with the county assessor before closing.
Climate risk First Street
- Flood 1/10 Low FEMA zone X (unshaded) · 0% chance over 30 yrs
- Wildfire 4/10 Moderate
- Heat 8/10 Severe 6 d/yr ≥103°F today · 17 d/yr by 30 yrs out
- Wind 1/10 Low
- Air quality 6/10 Major 11 unhealthy d/yr today · 15 by 30 yrs out
Nearby sold comps map
Loading sold comps map…
Walkable amenities ~0.75 mi
Loading nearby amenities…
Taxation est. · year 1
- Rental income
- $24,211
- − Mortgage interest
- −$3,557
- − Property taxes
- −$149
- − Insurance
- −$318
- − Repairs & maintenance
- −$1,937
- − Management
- −$1,937
- − Depreciation
- −$1,847
- Taxable income
- $14,467
- Est. tax owed @ 24.0%
- −$3,472
- After-tax cash flow
- $11,192/yr
For passive investors: Depreciation is non-cash, so a rental often shows a tax loss while cash-flowing — sheltering income. Rental losses are passive: they offset passive income freely, and up to $25,000/yr can offset ordinary (W-2) income if you actively participate and your MAGI is under $100k (phasing out to $0 by $150k); unused losses carry forward. On sale, claimed depreciation is recaptured at up to 25%, and gains may owe capital-gains tax (a 1031 exchange can defer both). Figures are a year-1 estimate at your 24.0% rate — not tax advice; consult a CPA.
Schools (NCES district)
- District
- Barstow Unified
- NCES district ID
- 0604020
- Math proficiency
- 11% ▼ -7.00%
- Reading proficiency
- 22% ▼ -7.00%
- Median HH income
- $44,505
- Composite
- 14.44/100
- National rank
- #9430
- State rank
- #482 of 517 in CA
Livability — Barstow
- Score
- 63/100
- State rank
- #444
- US rank
- #15099
Category grades
Schools grade is shown separately in the Schools card above.
Census & demographics
- Census place
- Barstow, CA
- County
- San Bernardino County · 2,030,291 people
- City population
- 33,954
- Metro
- Riverside-San Bernardino-Ontario, CA
- Population (ZIP)
- 33,954
- Household income
- $61,862
- Rent vs Own
- Severe rent burden
- 1305.0
Population outlook (San Bernardino County) Hauer SSP2
- Today (2025)
- 2,300,329 people
- By 2030
- 2,378,907 · +3.4%
- By 2040
- 2,523,137 · +9.7%
- By 2050
- 2,642,388 · +14.9%
- By 2075
- 2,880,769 · +25.2%
- By 2100
- 2,909,436 · +26.5%
Race, ethnicity, and origin ACS 2023
- Neighborhood character
- Diverse neighborhood (Simpson 0.68)
- Race & ethnicity
- Hispanic / Latino 46% White 29% Two or more races 22% Black 15% Native American 3% Asian 2% Pacific Islander 1%
- Hispanic origin (detail)
- Mexican 39% Puerto Rican 2%
- Common ancestry
- Portuguese 1% Lithuanian 1% Italian 1%
- Foreign-born
- 9% · Canada, South Korea
- Languages at home
- 77% English-only · Spanish 20% Tagalog/Filipino 1% Other Indo-European 1%
Political lean MEDSL · San Bernardino
- 2024 margin
- Toss-up / Even · D 47.5% · R 49.7% · Other 2.8%
- 2008→2024 swing
- -8.5pp toward R · 2008: 6.3pp · 2024: -2.1pp
- All cycles
- 2024: R+2.1 2020: D+10.7 2016: D+9.8 2012: D+5.4 2008: D+6.3
Not yet ingested
- Civics
- —
Market trends
- HPI YoY
- ▼ -139.26%
- Current HPI
- 316.4858
- Rent YoY
- ▲ 2.32%
- Metro
- Riverside-San Bernardino-Ontario, CA
- State GDP YoY
- ▲ 3.21%
- F500 in state
- 116
Industry mix (Fortune 500 HQ in CA)
| Industry | F500 HQs | Revenue |
|---|---|---|
| Technology | 27 | $1,492B |
|
||
| Financial Services | 3 | $174B |
|
||
| Retail | 3 | $44B |
|
||
| Insurance | 3 | $26B |
|
||
| Media / Entertainment | 2 | $115B |
|
||
| Pharmaceuticals / Biotech | 2 | $62B |
|
||
Price history
+217.6% since first listed5 events — show timeline
- 2026-04-28 Listed $63,500 GPSMLS
- 2025-12-25 Listing Removed — GPSMLS
- 2025-05-22 Listed $90,000 GPSMLS
- 2016-09-16 Sold (MLS) $17,000 CRMLS
- 2016-03-09 Listed $19,995 CRMLS
Property tax history
-3.3%/yrLatest (2025): $149 · -0.2% YoY. Source: county tax records.
Cash-flow waterfall
monthlySold comps — $/sqft
last 12 mo · ≤1 miLoading sold comps…