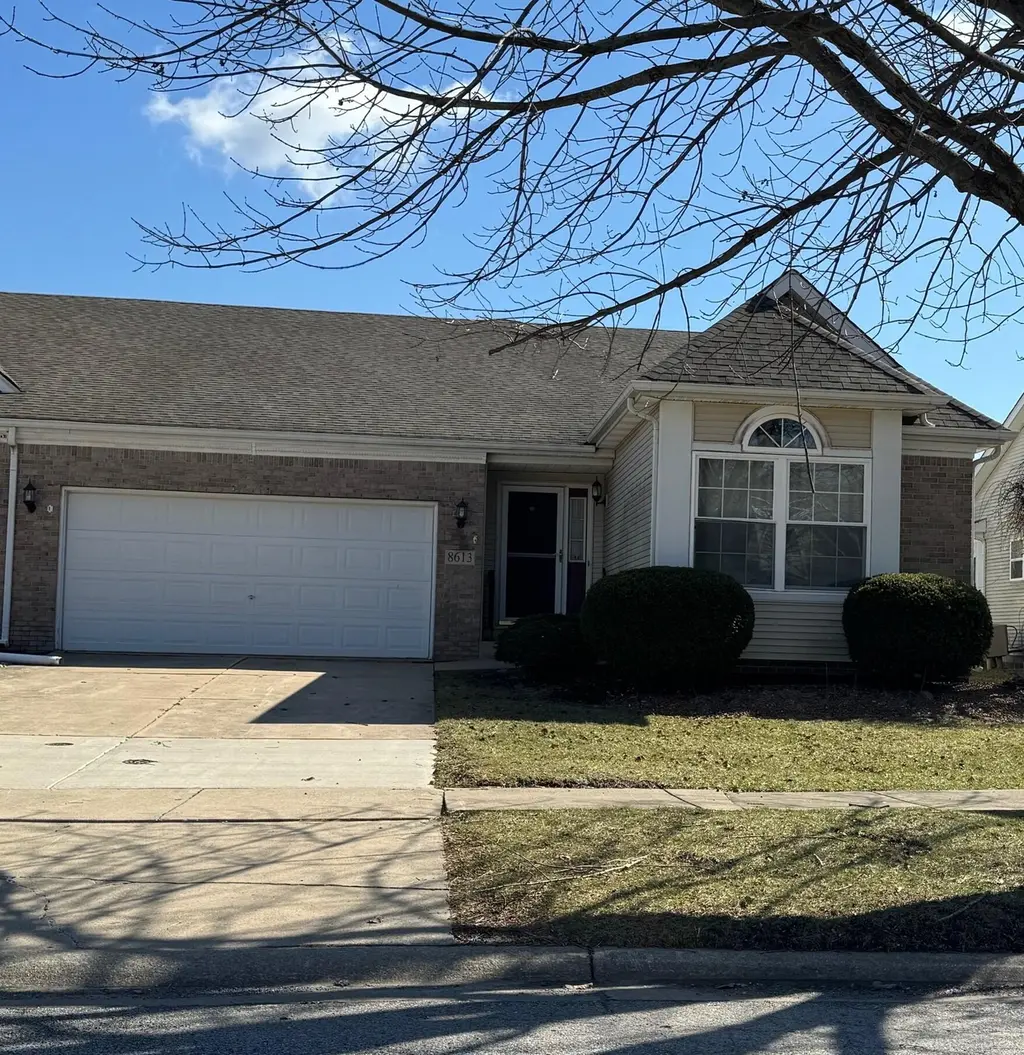
8613 Van Buren St · Merrillville, IN
Flood risk 1/10 · Minimal
- FEMA flood zone
- X (unshaded)
- Chance of flooding over 30 yrs
- 0.0%
- Est. flood insurance / yr
- $507 – $1,088
Fire risk 1/10 · Minimal
- Est. fire insurance / yr
- $717 – $1,331
Heat risk 2/10 · Minimal
- Hot days now (above 102°F)
- 7 days/yr
- Hot days in 30 yrs
- 16 days/yr
Wind risk 2/10 · Minimal
- Chance of severe wind over 30 yrs
- 0.0%
Air-quality risk 3/10 · Minor
- Unhealthy air days now
- 2 days/yr
- Unhealthy air days in 30 yrs
- 3 days/yr
Risk factors via First Street. Map © Google.
Why this score? — see what drove the D+ grade
The composite is a weighted blend of 9 inputs, each scored 0–100. Each bar is that input's sub-score; the figure is the points it added to the 100-point composite (weight × sub-score).
- Cash flow +16.7/30.0
- ARV discount +10.5/15.0
- DSCR +5.2/10.0
- 1% rule +4.6/10.0
- Livability +3.8/5.0
- Rent growth +3.5/5.0
- Schools +2.6/10.0
- Condition / age +2.5/5.0
- Appreciation +0.0/10.0
$234,900
🖨 Deal sheet (PDF) 📄 Offer letter ✓ Due diligence
Listing remarks MLS
SUNNY, SERENE & SIMPLY LOVELY!! Welcome home to this enchanting 3 bedroom patio home filled with warmth and natural light. Enjoy a bright eat-in kitchen plus a separate dining area - perfect for cozy mornings or hosting family and friends. The spacious primary en-suite is your personal retreat, featuring a private attached bath and and elegant high end walk-in jetted tub designed by relaxation and comfort. Step outside to a large patio where you can unwind and enjoy peaceful views of the woods - private, quiet, and perfect for morning coffee or evening sunsets. All appliances are included, and you'll love the low-maintenance living with snow removal and lawn care handled for you. Breathe. .. relax. .. and take it all in. This charming home offers comfort, privacy, and easy living - all in one beautiful space.
Key facts
- Primary en-suite
- Walk-in jetted tub
- Large patio
Tags
Neighborhood map
What this means for you Summary
Snapshot
- This is a 3-bed/2.0-bath single-family listed at $235k.
Deal economics
- At list price, monthly cash flow is $147 ($2k/yr) — positive.
- The deal already cash-flows at list — no discount required.
- To meet the 1% rule (rent ≥ 1% of price), the offer needs to be $225k (4.1% below list).
- Recommended offer: $207k (12.0% below list) — sets the bar for market timing.
- Cap rate 7.0% vs local median 4.7% in Merrillville — top-decile yield for the area; either an underpriced asset or a hidden risk that comps aren't pricing in. Stress-test before assuming the spread holds.
Location & tenants
- Location reads 76/100 on livability (#50 in IN, #3,393 nationally) — a middle-class / working-renter tenant base. Strengths: commute A+, cost of living A+, housing A+; Watch: schools D+, amenities F, health & safety D-.
- Merrillville Community School Corporation (suburban): math 22% / reading 36% proficiency, ranked #240 of 301 in IN (top 80%) — low school quality limits family demand, transient renter base, plan for 1-2y turnover.
- Market conditions: Rents rising fast (+4.1%/yr); 264 active listings in the ZIP; 9 comparable units currently listed for rent nearby; rentals leasing fast (median 7d on market — plan ~1-2 weeks tenant-placement turnaround); 1,642 units permitted in Lake County in 2024 (14 in 5+ unit buildings).
- This rent runs 42% of the median local income ($64k/yr) — at the standard rent-burdened threshold; future hikes will face affordability resistance.
Forward outlook
- Local home prices are declining (-3.0%/yr); year-one equity from $2k of loan paydown is wiped out by about $7k of value loss. Plan a longer hold.
- Lake County population projected to shrink 7% by 2050 — rents likely to lag national; underwrite the cash flow, not the appreciation.
Negotiation context
- It's been on market 125 days — a 12% lower offer ($207k) is reasonable based on typical stale-listing flexibility.
- 3 sale attempts since 28y ago; this cycle's ask has dropped $20k (8%) from the opening price — seller is motivated, your offer sets the floor, not the list.
Questions for the listing agent
- It's been on market 125 days. Have you received any prior offers? Is the seller open to a 12% concession, seller financing, or rate buy-down credit?
- What does the HOA fee cover, when was the last increase, and are there any pending special assessments or reserve-fund shortfalls?
- Why hasn't it sold? Are there any deal-killer items the seller is aware of (foundation, flood, title, zoning, code violations)?
- Is there a deadline driving the sale (1031 exchange, divorce, estate, relocation)? That informs how much negotiation room exists.
- Schools are D-rated, which usually means shorter tenancies and higher turnover. Who's the typical renter profile here, and what's been the actual vacancy rate?
- The area grade is low — what's the realistic commute time and amenity access for the typical tenant pool here? Any planned neighborhood developments (good or bad) we should know about?
- What's the average days-on-market for RENTAL listings here right now (not sales)? A rising rental-DOM trend means longer vacancies and softer asking-rent achievability than the comps imply.
- What's the recent tenant-quality profile in this submarket — average credit score on applications, eviction rate, late-payment / NSF rate, and stable-employment percentage? A property-management company in the area should have these aggregated.
- How much new for-sale + rental construction is in the pipeline within 1–3 miles? Heavy new supply typically softens prices + rents 12–24 months out; constrained supply supports both.
Investment metrics
- 1% rule
- 0.96% ✗
- Cap rate
- 7.05%
- Cash-on-cash
- 2.69%
- DSCR
- 1.12
- GRM
- 8.7
CMA / ARV
- ARV (median comp)
- $251,866
- List price
- $234,900
- Delta
- -6.74%
- Verdict
- FAIR
- Comps
- 20 within 1.0 mi
Show comp detail 12 sales within ~0.75 mi
| Address | Dist | Beds/Ba | Sqft | Sold | Price | $/sf | Match |
|---|---|---|---|---|---|---|---|
| 874 W 87th Ave | 0.15mi | 3/2.0 | 1,542 (+0%) | 16mo | $255,000 | $165 | 79 |
| 8712 Tyler St | 0.20mi | 3/2.0 | 1,644 (+7%) | 1mo | $300,000 | $182 | 78 |
| 8811 Harrison St | 0.17mi | 3/2.0 | 1,553 (+1%) | 18mo | $278,000 | $179 | 75 |
| 8474 Jackson St | 0.25mi | 3/2.0 | 1,565 (+2%) | 14mo | $270,000 | $173 | 73 |
| 8653 Madison St | 0.16mi | 3/2.0 | 1,574 (+3%) | 22mo | $274,928 | $175 | 70 |
| 8628 Madison St | 0.16mi | 3/2.0 | 1,574 (+3%) | 23mo | $255,137 | $162 | 69 |
| 8821 Jackson St | 0.19mi | 3/2.0 | 1,607 (+5%) | 20mo | $249,900 | $156 | 66 |
| 8524 Fillmore St | 0.26mi | 3/2.0 | 1,456 (-5%) | 20mo | $278,000 | $191 | 63 |
| 1202 W 84th Ln | 0.47mi | 2/2.0 (-1) | 1,555 (+1%) | 12mo | $260,000 | $167 | 60 |
| 8649 Madison St | 0.14mi | 3/2.0 | 1,733 (+13%) | 22mo | $315,495 | $182 | 54 |
| 1224 W 85th Ave | 0.37mi | 3/2.5 | 1,728 (+13%) | 8mo | $320,000 | $185 | 53 |
| 1228 W 82nd Ave | 0.70mi | 2/2.0 (-1) | 1,334 (-13%) | 20mo | $210,000 | $157 | 24 |
Match score weights: distance 35% · size 25% · config 20% · recency 20%. Top-matched comps best support the ARV.
Projected returns pro-forma
-3.0% appreciation · 4.1% rent growth · sell at horizon
- IRR
- -10.8%
- Equity multiple
- 0.60×
- Total profit
- $-26,122
- Equity at exit
- $35,024
- IRR
- 0.0%
- Equity multiple
- 1.00×
- Total profit
- $72
- Equity at exit
- $20,310
Cash invested: $65,772 (down + closing). Projections, not guarantees.
Landlord ↔ Tenant lean methodology
- Overall (STATE)
- 90 Strongly Landlord-Friendly
- State Indiana
- 90 Strongly Landlord-Friendly · R+11
- County
- — inherits STATE
- City
- — inherits STATE
ZIP-level market 46410
- Rents YoY
- 4.1%
- Active inventory
- 264
- Price-to-rent
- 8.7×
Monthly cashflow live
- Estimated rent
- $2,253 high interval (Pro) →
- Mortgage (P&I)
- −$1,232
- Tax from tax record
- −$153 /mo · $1,834/yr
- Insurance
- −$98
- HOA
- −$150
- Vacancy / Maint / Mgmt
- −$473
- Net cashflow
- $147
Break-even live
Sensitivity live
| Price | -10% $280 | -5% $214 | +0% $147 | +5% $81 | +10% $14 |
|---|---|---|---|---|---|
| Rent | -10% $-31 | -5% $58 | +0% $147 | +5% $236 | +10% $325 |
| Rate | -1.0pp $266 | -0.5pp $207 | base $147 | +0.5pp $86 | +1.0pp $25 |
UW: 25.0% down · 7.5% · 30yr · 1.5% tax · 5.0% vac · 8.0% maint · 8.0% mgmt
Financing live
Cash to close
- Down payment
- $58,725
- Closing costs
- $7,047
- Reserves months
- —
- Total cash needed
- —
Loan-product check · same deal, 3 products live
Conventional
25% down · 7.5% · 30yr
- Down + closing
- —
- Monthly P&I
- —
- Monthly cashflow
- —
- DSCR
- —
- Eligible?
- —
Personal DTI + credit; lowest rate.
DSCR
20% down · 8.5% · 30yr
- Down + closing
- —
- Monthly P&I
- —
- Monthly cashflow
- —
- DSCR
- —
- Eligible?
- —
No personal income docs; deal must DSCR.
Hard money
10% down · 12.0% · 12mo
- Down + closing
- —
- Monthly P&I
- —
- Monthly cashflow
- —
- DSCR
- —
- Eligible?
- —
Short-term bridge; refi at stabilization.
Rent comps 9 comps
| Address | Beds | Baths | Sqft | Rent | $/sqft | DOM | Units | Dist |
|---|---|---|---|---|---|---|---|---|
| 9000 Lincoln St Merrillville, IN | 2.0 | 2.0 | 1196 | $2,238 | $1.87 | 44d | 1 | 0.55mi |
| 9000 Lincoln St Merrillville, IN | 2.0 | 2.0 | 1196 | $2,181 | $1.82 | 16d | 1 | 0.55mi |
| 9000 Lincoln St Merrillville, IN | 3.0 | 2.0 | 1223 | $3,119 | $2.55 | 22d | 1 | 0.55mi |
| 8400 Grant Cir Merrillville, IN | 1.0–2.0 | 1.0–2.0 | 904 | $1,720 | $1.90 | 2d | 10 | 0.62mi |
| 9310 Monroe St Crown Point, IN | 3.0 | 2.0 | 1370 | $2,521 | $1.84 | 5d | 1 | 0.76mi |
| 9123 Cleveland St Merrillville, IN | 1.0–2.0 | 1.0–2.0 | 1068 | $2,145 | $2.01 | 2d | 35 | 0.91mi |
| 8201 Polo Club Dr Merrillville, IN | 1.0–3.0 | 1.0–2.0 | 1200 | $2,137 | $1.78 | 2d | 18 | 0.93mi |
| 691 W 77th Ave Unit 691 Merrillville, IN | 3.0 | 2.0 | 1300 | $2,300 | $1.77 | 8d | 1 | 1.20mi |
| 1400 W 97th Ave Crown Point, IN | 3.0 | 3.0 | 1928 | $2,800 | $1.45 | 7d | 1 | 1.25mi |
HOA detail
- Monthly dues
- $150 · $1,800/yr
- Likely covers
- landscapingsnow removal
Listing history 15 events
-
2026-06-13statusdays on market $234,900 Pending 125 DOM
-
2026-06-09days on market $234,900 Active 124 DOM
-
2026-06-08days on market $234,900 Active 123 DOM
-
2026-06-07days on market $234,900 Active 122 DOM
-
2026-06-04days on market $234,900 Active 119 DOM
-
2026-06-03days on market $234,900 Active 118 DOM
-
2026-06-02days on market $234,900 Active 117 DOM
-
2026-06-01days on market $234,900 Active 116 DOM
-
2026-05-31days on market $234,900 Active 115 DOM
-
2026-04-07price $239,900 827-char remark
Show marketing remark (827 chars)
SUNNY, SERENE & SIMPLY LOVELY!! Welcome home to this enchanting 3 bedroom patio home filled with warmth and natural light. Enjoy a bright eat-in kitchen plus a separate dining area - perfect for cozy mornings or hosting family and friends. The spacious primary en-suite is your personal retreat, featuring a private attached bath and and elegant high end walk-in jetted tub designed by relaxation and comfort. Step outside to a large patio where you can unwind and enjoy peaceful views of the woods - private, quiet, and perfect for morning coffee or evening sunsets. All appliances are included, and you'll love the low-maintenance living with snow removal and lawn care handled for you. Breathe. .. relax. .. and take it all in. This charming home offers comfort, privacy, and easy living - all in one beautiful space.
-
2026-02-13price $249,900 827-char remark
Show marketing remark (827 chars)
SUNNY, SERENE & SIMPLY LOVELY!! Welcome home to this enchanting 3 bedroom patio home filled with warmth and natural light. Enjoy a bright eat-in kitchen plus a separate dining area - perfect for cozy mornings or hosting family and friends. The spacious primary en-suite is your personal retreat, featuring a private attached bath and and elegant high end walk-in jetted tub designed by relaxation and comfort. Step outside to a large patio where you can unwind and enjoy peaceful views of the woods - private, quiet, and perfect for morning coffee or evening sunsets. All appliances are included, and you'll love the low-maintenance living with snow removal and lawn care handled for you. Breathe. .. relax. .. and take it all in. This charming home offers comfort, privacy, and easy living - all in one beautiful space.
-
2026-02-04$254,900 Active 827-char remark
Show marketing remark (827 chars)
SUNNY, SERENE & SIMPLY LOVELY!! Welcome home to this enchanting 3 bedroom patio home filled with warmth and natural light. Enjoy a bright eat-in kitchen plus a separate dining area - perfect for cozy mornings or hosting family and friends. The spacious primary en-suite is your personal retreat, featuring a private attached bath and and elegant high end walk-in jetted tub designed by relaxation and comfort. Step outside to a large patio where you can unwind and enjoy peaceful views of the woods - private, quiet, and perfect for morning coffee or evening sunsets. All appliances are included, and you'll love the low-maintenance living with snow removal and lawn care handled for you. Breathe. .. relax. .. and take it all in. This charming home offers comfort, privacy, and easy living - all in one beautiful space.
-
1999-11-12historical
-
1999-05-12$119,000
-
1998-02-13$117,900
ⓘ Source: listings_history table (triggers on properties + properties_extension) + one-shot
backfill from property_details.listing_events for pre-trigger history.
Tax reassessment forecast IN · Partial reset (capped growth)
- Current annual tax
- $1,834 · $153/mo
- Projected year-2 tax
- $1,915 · $160/mo
- Expected delta
- +$81/yr (+$7/mo · 4.4%)
ⓘ Screening estimate from a state-policy table — verify with the county assessor before closing.
Climate risk First Street
- Flood 1/10 Low FEMA zone X (unshaded) · 0% chance over 30 yrs
- Wildfire 1/10 Low
- Heat 2/10 Low 7 d/yr ≥102°F today · 16 d/yr by 30 yrs out
- Wind 2/10 Low 0% chance of damaging wind over 30 yrs
- Air quality 3/10 Moderate 2 unhealthy d/yr today · 3 by 30 yrs out
Nearby sold comps map
Loading sold comps map…
Walkable amenities ~0.75 mi
Loading nearby amenities…
Taxation est. · year 1
- Rental income
- $27,035
- − Mortgage interest
- −$13,158
- − Property taxes
- −$1,834
- − Insurance
- −$1,174
- − Repairs & maintenance
- −$2,163
- − Management
- −$2,163
- − HOA
- −$1,800
- − Depreciation
- −$6,833
- Taxable loss
- −$2,090
- Est. tax savings @ 24.0%
- +$502
- After-tax cash flow
- $2,269/yr
For passive investors: Depreciation is non-cash, so a rental often shows a tax loss while cash-flowing — sheltering income. Rental losses are passive: they offset passive income freely, and up to $25,000/yr can offset ordinary (W-2) income if you actively participate and your MAGI is under $100k (phasing out to $0 by $150k); unused losses carry forward. On sale, claimed depreciation is recaptured at up to 25%, and gains may owe capital-gains tax (a 1031 exchange can defer both). Figures are a year-1 estimate at your 24.0% rate — not tax advice; consult a CPA.
Schools (NCES district)
- District
- Merrillville Community School Corporation
- NCES district ID
- 1809690
- Math proficiency
- 22% ▼ -17.00%
- Reading proficiency
- 36% ▼ -8.00%
- Median HH income
- $54,401
- Composite
- 25.74/100
- National rank
- #7375
- State rank
- #240 of 301 in IN
Livability — Merrillville
- Score
- 76/100
- State rank
- #50
- US rank
- #3393
Category grades
Schools grade is shown separately in the Schools card above.
Census & demographics
- Census place
- Merrillville, IN
- County
- Lake County · 422,878 people
- City population
- 39,243
- Metro
- Chicago-Naperville-Elgin, IL-IN-WI
- Population (ZIP)
- 39,243
- Household income
- $64,127
- Rent vs Own
- Severe rent burden
- 1644.0
Population outlook (Lake County) Hauer SSP2
- Today (2025)
- 484,026 people
- By 2030
- 478,091 · -1.2%
- By 2040
- 462,974 · -4.3%
- By 2050
- 449,894 · -7.1%
- By 2075
- 436,169 · -9.9%
- By 2100
- 426,607 · -11.9%
Race, ethnicity, and origin ACS 2023
- Neighborhood character
- Diverse neighborhood (Simpson 0.66)
- Race & ethnicity
- Black 46% White 32% Hispanic / Latino 16% Two or more races 9% Asian 2%
- Hispanic origin (detail)
- Mexican 11% Puerto Rican 3%
- Common ancestry
- Romanian 4% Iranian 2% Italian 1%
- Foreign-born
- 7% · Canada
- Languages at home
- 88% English-only · Spanish 7% Other Indo-European 2%
Political lean MEDSL · Lake
- 2024 margin
- Lean D (+5.6) · D 52.1% · R 46.5% · Other 1.5%
- 2008→2024 swing
- -28.6pp toward R · 2008: 34.3pp · 2024: 5.6pp
- All cycles
- 2024: D+5.6 2020: D+15.1 2016: D+20.6 2012: D+31.0 2008: D+34.3
Not yet ingested
- Civics
- —
Market trends
- HPI YoY
- ▼ -180.11%
- Current HPI
- 240.8833
- Rent YoY
- ▲ 4.10%
- Metro
- Chicago-Naperville-Elgin, IL-IN-WI
- State GDP YoY
- ▲ 2.90%
- F500 in state
- 18
Industry mix (Fortune 500 HQ in IN)
| Industry | F500 HQs | Revenue |
|---|---|---|
| Industrial Machinery | 2 | $37B |
|
||
| Healthcare | 1 | $177B |
|
||
| Pharmaceuticals | 1 | $45B |
|
||
| Metals / Steel | 1 | $18B |
|
||
| Agriculture | 1 | $17B |
|
||
| Packaging | 1 | $12B |
|
||
Price history
+103.5% since first listed6 events — show timeline
- 2026-04-07 Price Changed $239,900 NIRA MLS as Distributed by MLS Grid
- 2026-02-13 Price Changed $249,900 NIRA MLS as Distributed by MLS Grid
- 2026-02-04 Listed $254,900 NIRA MLS as Distributed by MLS Grid
- 1999-11-12 Listing Removed — NIRA MLS as Distributed by MLS Grid
- 1999-05-12 Listed $119,000 NIRA MLS as Distributed by MLS Grid
- 1998-02-13 Listed $117,900 NIRA MLS as Distributed by MLS Grid
Property tax history
+3.0%/yrLatest (2024): $1,834 · +5.4% YoY. Source: county tax records.
Cash-flow waterfall
monthlySold comps — $/sqft
last 12 mo · ≤1 miLoading sold comps…