2109 Osprey Isle Ln SW · Shallotte, NC
Flood risk No data
- FEMA flood zone
- —
- Chance of flooding over 30 yrs
- —
- Est. flood insurance / yr
- —
Fire risk No data
- Est. fire insurance / yr
- —
Heat risk No data
- Hot days now (above threshold)
- —
- Hot days in 30 yrs
- —
Wind risk No data
- Chance of severe wind over 30 yrs
- —
Air-quality risk No data
- Unhealthy air days now
- —
- Unhealthy air days in 30 yrs
- —
Risk factors via First Street. Map © Google.
Why this score? — see what drove the D- grade
The composite is a weighted blend of 9 inputs, each scored 0–100. Each bar is that input's sub-score; the figure is the points it added to the 100-point composite (weight × sub-score).
- Cash flow +12.0/30.0
- ARV discount +4.0/15.0
- Condition / age +4.0/5.0
- Schools +3.9/10.0
- DSCR +3.6/10.0
- 1% rule +3.5/10.0
- Livability +3.2/5.0
- Rent growth +2.5/5.0
- Appreciation +0.0/10.0
$257,150
🖨 Deal sheet 📄 Offer letter ✓ Due diligence
Listing remarks
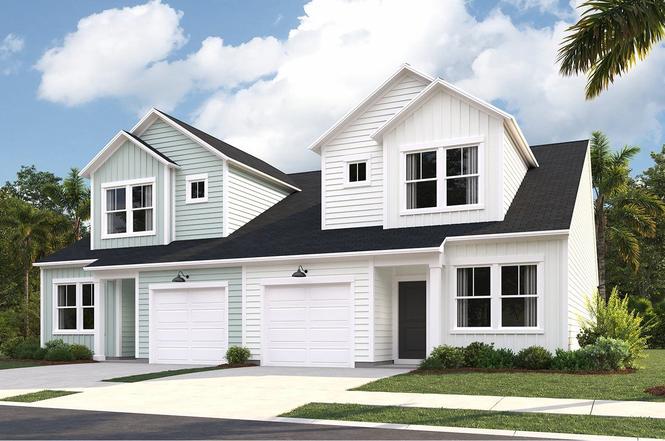
This new two-story home provides low-maintenance living with everything you need on the first floor. Past the foyer is a fully equipped kitchen which connects to the dining and living spaces, along with an attached patio for indoor-outdoor activities. The owner's suite with a private bathroom and walk-in closet is located at opposite ends of the home from the secondary bedroom. Upstairs, a versatile bedroom suite provides additional space for homeowners to customize as they please.
Key facts
- Walk-in closet
- Private bathroom
- Attached patio
Tags
Property features AI
Finance
- Other: Address: 2109 Osprey Isle Ln SW, Ocean Isle Beach, NC 28469; List price $297,700; Status: Active
Exterior
- Parking: Detached or attached garage with space for 1 vehicle; 1 parking space total
- Home design: Single-family property (BLAKELY plan)
- Exterior features: Living area approximately 1,437 square feet
Interior
- Bedrooms: 3 bedrooms
- Bathrooms: 3 full bathrooms
- Interior features: Spec home (new construction, BLAKELY plan)
Neighborhood map
What this means for you Summary
Snapshot
- This is a 3-bed/3.0-bath townhouse listed at $257k. Condition is rated good.
Deal economics
- At list price, monthly cash flow is $-59 ($-706/yr) — negative.
- To cash-flow at today's rent, offer at most $249k (3.3% below list).
- To meet the 1% rule (rent ≥ 1% of price), the offer needs to be $218k (15.4% below list).
- Recommended offer: $218k (15.4% below list) — sets the bar for 1% rule.
- Cap rate 6.0% vs local median 4.0% in Shallotte — top-decile yield for the area; either an underpriced asset or a hidden risk that comps aren't pricing in. Stress-test before assuming the spread holds.
Location & tenants
- Location reads 63/100 on livability (#411 in NC) — a middle-class / working-renter tenant base. Strengths: cost of living A+, housing A+, employment B; Watch: schools C-, health & safety D, crime F.
- Brunswick County Schools (rural): math 45% / reading 47% proficiency, ranked #82 of 178 in NC (top 46%) — families likely to look elsewhere, expect single-tenant / working-renter base with shorter leases.
- Market conditions: 536 active listings in the ZIP; 1 comparable units currently listed for rent nearby; 6,112 units permitted in Brunswick County in 2024 (990 in 5+ unit buildings).
Forward outlook
- Local home prices are declining (-3.0%/yr); year-one equity from $2k of loan paydown is wiped out by about $8k of value loss. Plan a longer hold.
- Brunswick County population projected at +36% by 2050 — long-run rental-demand tailwind backs the buy-and-hold thesis.
Negotiation context
- Only 3 days on market — expect competitive offers; lowballing is unlikely to land.
Questions for the listing agent
- What do current leases actually rent for vs. the listed asking? Can we see a recent rent roll and the last 12 months of T-12 income?
- Is there a deadline driving the sale (1031 exchange, divorce, estate, relocation)? That informs how much negotiation room exists.
- Crime grade is F in this area — have there been break-ins, vandalism, or insurance claims at this property in the last 3 years? What carrier currently insures it and at what premium?
- The area grade is low — what's the realistic commute time and amenity access for the typical tenant pool here? Any planned neighborhood developments (good or bad) we should know about?
- What's the average days-on-market for RENTAL listings here right now (not sales)? A rising rental-DOM trend means longer vacancies and softer asking-rent achievability than the comps imply.
- What's the recent tenant-quality profile in this submarket — average credit score on applications, eviction rate, late-payment / NSF rate, and stable-employment percentage? A property-management company in the area should have these aggregated.
- How much new for-sale + rental construction is in the pipeline within 1–3 miles? Heavy new supply typically softens prices + rents 12–24 months out; constrained supply supports both.
Investment metrics
- 1% rule
- 0.85% ✗
- Cap rate
- 6.02%
- Cash-on-cash
- -0.98%
- DSCR
- 0.96
- GRM
- 9.9
CMA / ARV
- ARV (on-the-fly)
- $238,542
- Comps found
- 12
Show comp detail 12 sales within ~0.75 mi
| Address | Dist | Beds/Ba | Sqft | Sold | Price | $/sf | Match |
|---|---|---|---|---|---|---|---|
| 2082 Osprey Isle Ln SW Lot 53 Blakely | 0.05mi | 3/3.0 | 1,437 (0%) | 1mo | $232,000 | $161 | 97 |
| 2066 Osprey Isle Ln SW Unit 49 Blakely | 0.07mi | 3/3.0 | 1,437 (0%) | 1mo | $225,900 | $157 | 96 |
| 2054 Osprey Isle Ln SW Lot 46 Blakely | 0.09mi | 3/3.0 | 1,437 (0%) | 1mo | $235,900 | $164 | 95 |
| 2050 Osprey Isle Ln SW Lot 45 Blakely | 0.10mi | 3/3.0 | 1,437 (0%) | 2mo | $249,000 | $173 | 94 |
| 2057 Osprey Isle Ln SW Unit 73 Blakely | 0.08mi | 3/3.0 | 1,437 (0%) | 4mo | $240,000 | $167 | 93 |
| 2045 Osprey Isle Ln SW Unit 70 Blakely | 0.12mi | 3/3.0 | 1,437 (0%) | 3mo | $239,900 | $167 | 92 |
| 1736 Hunting Harris Ct SW Lot 8 Blakely | 0.16mi | 3/3.0 | 1,437 (0%) | 4mo | $234,000 | $163 | 90 |
| 1736 Hunting Harris Ct #8 | 0.16mi | 3/3.0 | 1,437 (0%) | 4mo | $234,000 | $163 | 89 |
| 1732 Hunting Harris Ct SW Lot 7 Blakely | 0.16mi | 3/3.0 | 1,437 (0%) | 4mo | $239,000 | $166 | 89 |
| 1732 Hunting Harris Ct #7 | 0.16mi | 3/3.0 | 1,437 (0%) | 4mo | $239,000 | $166 | 89 |
| 2029 Osprey Isle Ln SW Lot 66 Blakeley | 0.19mi | 3/3.0 | 1,437 (0%) | 3mo | $244,500 | $170 | 88 |
| 2025 Osprey Isle Ln SW Lot 65 Blakeley | 0.19mi | 3/3.0 | 1,437 (0%) | 3mo | $247,500 | $172 | 88 |
Match score weights: distance 35% · size 25% · config 20% · recency 20%. Top-matched comps best support the ARV.
Projected returns pro-forma
-3.0% appreciation · 3.0% rent growth · sell at horizon
- IRR
- -17.9%
- Equity multiple
- 0.37×
- Total profit
- $-45,385
- Equity at exit
- $38,342
- IRR
- -10.0%
- Equity multiple
- 0.39×
- Total profit
- $-44,214
- Equity at exit
- $22,234
Cash invested: $72,002 (down + closing). Projections, not guarantees.
Landlord ↔ Tenant lean methodology
- Overall (STATE)
- 85 Strongly Landlord-Friendly
- State North Carolina
- 85 Strongly Landlord-Friendly · R+3
- County
- — inherits STATE
- City
- — inherits STATE
ZIP-level market 28469
- Active inventory
- 536
- Price-to-rent
- 9.9×
Monthly cashflow live
- Estimated rent
- $2,175 medium interval (Pro) →
- Mortgage (P&I)
- −$1,349
- Tax est. 1.5%
- −$321 /mo · $3,857/yr
- Insurance
- −$107
- HOA
- −$0
- Vacancy / Maint / Mgmt
- −$457
- Net cashflow
- $-59
Break-even live
UW: 25.0% down · 7.5% · 30yr · 1.5% tax · 5.0% vac · 8.0% maint · 8.0% mgmt
Financing live
Cash to close
- Down payment
- $64,288
- Closing costs
- $7,714
- Reserves months
- —
- Total cash needed
- —
Loan-product check · same deal, 3 products live
Conventional
25% down · 7.5% · 30yr
- Down + closing
- —
- Monthly P&I
- —
- Monthly cashflow
- —
- DSCR
- —
- Eligible?
- —
Personal DTI + credit; lowest rate.
DSCR
20% down · 8.5% · 30yr
- Down + closing
- —
- Monthly P&I
- —
- Monthly cashflow
- —
- DSCR
- —
- Eligible?
- —
No personal income docs; deal must DSCR.
Hard money
10% down · 12.0% · 12mo
- Down + closing
- —
- Monthly P&I
- —
- Monthly cashflow
- —
- DSCR
- —
- Eligible?
- —
Short-term bridge; refi at stabilization.
Rent comps 1 comps
| Address | Beds | Baths | Sqft | Rent | $/sqft | DOM | Units | Dist |
|---|---|---|---|---|---|---|---|---|
| 855 Bertwood Rd SW Ocean Isle Beach, NC | 3.0 | 2.0 | 1750 | $2,175 | $1.24 | 23d | 1 | 0.39mi |
Listing history 5 events
-
2026-06-18days on market $257,150 Active 3 DOM
-
2026-06-18price $257,150 Active 2 DOM
-
2026-06-17days on market $297,700 Active 2 DOM
-
2026-06-15remarks 486-char remark
-
2026-06-15$297,700 Active 1 DOM
ⓘ Source: listings_history table (triggers on properties + properties_extension) + one-shot
backfill from property_details.listing_events for pre-trigger history.
Nearby sold comps map
Loading sold comps map…
Walkable amenities ~0.75 mi
Loading nearby amenities…
Taxation est. · year 1
- Rental income
- $26,100
- − Mortgage interest
- −$14,404
- − Property taxes
- −$3,857
- − Insurance
- −$1,286
- − Repairs & maintenance
- −$2,088
- − Management
- −$2,088
- − Depreciation
- −$7,481
- Taxable loss
- −$5,104
- Est. tax savings @ 24.0%
- +$1,225
- After-tax cash flow
- $519/yr
For passive investors: Depreciation is non-cash, so a rental often shows a tax loss while cash-flowing — sheltering income. Rental losses are passive: they offset passive income freely, and up to $25,000/yr can offset ordinary (W-2) income if you actively participate and your MAGI is under $100k (phasing out to $0 by $150k); unused losses carry forward. On sale, claimed depreciation is recaptured at up to 25%, and gains may owe capital-gains tax (a 1031 exchange can defer both). Figures are a year-1 estimate at your 24.0% rate — not tax advice; consult a CPA.
Condition & rehab AI · 6 photos
This move-in-ready two-story townhouse offers a modern and well-maintained living space with a good condition score of 80. It has a good kitchen, bathrooms, and exterior, with minimal maintenance required. The property has a good resale and rental value potential with some updates that can further enhance its appeal.
Value-add opportunities
- Both Painting the exterior and interior walls — Fresh paint can enhance curb appeal and interior aesthetics.
- Both Landscaping improvements — Enhanced landscaping can increase curb appeal and property value.
- Both Adding smart home features — Smart home features can increase property value and attract tech-savvy buyers/tenants.
- Both Upgrading the kitchen appliances — Modern appliances can make the kitchen more functional and appealing to potential buyers/tenants.
Renovation cost estimate screening
Value-add ROI direction
- Both Painting the exterior and interior walls — Fresh paint can enhance curb appeal and interior aesthetics. ↑
- Both Landscaping improvements — Enhanced landscaping can increase curb appeal and property value. ↑
- Both Adding smart home features — Smart home features can increase property value and attract tech-savvy buyers/tenants. ↑
- Both Upgrading the kitchen appliances — Modern appliances can make the kitchen more functional and appealing to potential buyers/tenants. ↑
ⓘ Cost ranges are severity-bucket heuristics (US national rule-of-thumb). Get contractor quotes + a written scope before underwriting a rehab budget.
Schools (NCES district)
- District
- Brunswick County Schools
- NCES district ID
- 3700420
- Math proficiency
- 45% ▲ 4.00%
- Reading proficiency
- 47% ▲ 4.00%
- Median HH income
- $47,494
- Composite
- 39.23/100
- National rank
- #4011
- State rank
- #82 of 178 in NC
Livability — Shallotte
- Score
- 63/100
- State rank
- #411
- US rank
- #15490
Category grades
Schools grade is shown separately in the Schools card above.
Census & demographics
- City population
- 11,219
- Population (ZIP)
- 9,364
Population outlook (Brunswick County) Hauer SSP2
- Today (2025)
- 152,111 people
- By 2030
- 165,705 · +8.9%
- By 2040
- 188,494 · +23.9%
- By 2050
- 206,228 · +35.6%
- By 2075
- 237,876 · +56.4%
- By 2100
- 251,451 · +65.3%
Race, ethnicity, and origin ACS 2023
- Neighborhood character
- Predominantly White (92%)
- Race & ethnicity
- White 92% Hispanic / Latino 4% Black 2% Two or more races 1%
- Common ancestry
- Romanian 3% Lithuanian 3% Serbian 2%
- Foreign-born
- 4% · Canada
- Languages at home
- 96% English-only · Spanish 3% Other Indo-European 1%
Political lean MEDSL · Brunswick
- 2024 margin
- Strong R (+24.9) · D 37.2% · R 62.0%
- 2008→2024 swing
- -6.9pp toward R · 2008: -17.9pp · 2024: -24.9pp
- All cycles
- 2024: R+24.9 2020: R+25.0 2016: R+28.7 2012: R+22.2 2008: R+17.9
Not yet ingested
- Civics
- —
Market trends
- HPI YoY
- ▼ -270.51%
- Current HPI
- 143.229
- Rent YoY
- —
- Metro
- —
- State GDP YoY
- ▲ 3.28%
- F500 in state
- 26
Industry mix (Fortune 500 HQ in NC)
| Industry | F500 HQs | Revenue |
|---|---|---|
| Financial Services | 2 | $213B |
|
||
| Retail | 2 | $95B |
|
||
| Industrial Conglomerate | 1 | $38B |
|
||
| Metals / Steel | 1 | $35B |
|
||
| Utilities | 1 | $30B |
|
||
| Industrial Machinery | 1 | $19B |
|
||
Cash-flow waterfall
monthlySold comps — $/sqft
last 12 mo · ≤1 miLoading sold comps…