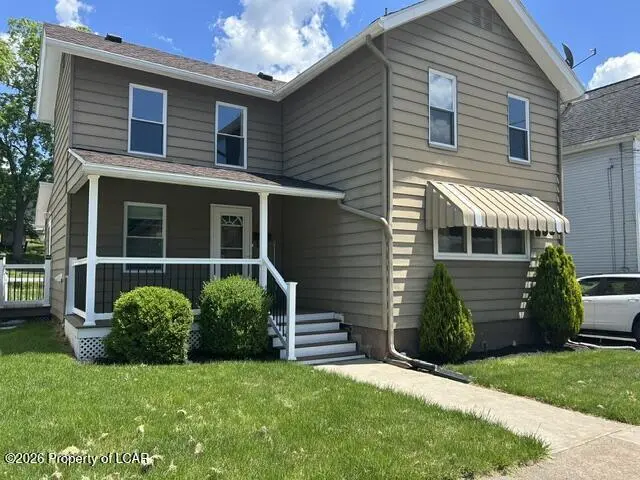
735 Bennett St · Luzerne, PA
Flood risk 1/10 · Minimal
- FEMA flood zone
- X (unshaded)
- Chance of flooding over 30 yrs
- 0.0%
- Est. flood insurance / yr
- $507 – $1,088
Fire risk 2/10 · Minimal
- Est. fire insurance / yr
- $511 – $949
Heat risk 4/10 · Minor
- Hot days now (above 97°F)
- 7 days/yr
- Hot days in 30 yrs
- 16 days/yr
Wind risk 3/10 · Minor
- Chance of severe wind over 30 yrs
- 5.0%
Air-quality risk 3/10 · Minor
- Unhealthy air days now
- 2 days/yr
- Unhealthy air days in 30 yrs
- 4 days/yr
Risk factors via First Street. Map © Google.
Why this score? — see what drove the F grade
The composite is a weighted blend of 9 inputs, each scored 0–100. Each bar is that input's sub-score; the figure is the points it added to the 100-point composite (weight × sub-score).
- Appreciation +10.0/10.0
- Cash flow +8.7/30.0
- Livability +3.8/5.0
- Rent growth +2.5/5.0
- Schools +2.5/10.0
- Condition / age +2.5/5.0
- DSCR +2.4/10.0
- 1% rule +2.1/10.0
- ARV discount +0.5/15.0
$199,900
🖨 Deal sheet (PDF) 📄 Offer letter ✓ Due diligence
Listing remarks MLS
Tasteful renovation in this 3 BR, 1 & 1/2 bath 2 story on great lot! Modern kitchen with stainless appliances and laundry area, brand new bathrooms, roof, windows, flooring, heat and central air. Freshly painted inside and out. Great yard, off street parking. Nothing to do for years to come!!
Key facts
- Rear fenced yard
- Large deck
- Newer front porch
Tags
Property features AI
Exterior
- Utilities: Public water; Public sewer
- Home design: Single-family residence; Two levels
- Construction: Aluminum siding
- Exterior features: Deck; Porch; Fenced yard; Cleared lot
Interior
- Kitchen: Eat-in kitchen
- Bedrooms: Total of 5 rooms (includes bedrooms and living spaces)
- Bathrooms: 1 full bathroom; 1 half bathroom
- Heating & cooling: Natural gas heating with forced air; Central air conditioning
- Interior features: Eat-in kitchen; Dining room fireplace; Full unfinished basement
Neighborhood map
What this means for you Summary
Snapshot
- This is a 3-bed/1.5-bath single-family listed at $200k.
Deal economics
- At list price, monthly cash flow is $-169 ($-2k/yr) — negative.
- To cash-flow at today's rent, offer at most $170k (14.9% below list).
- To meet the 1% rule (rent ≥ 1% of price), the offer needs to be $142k (29.1% below list).
- Recommended offer: $142k (29.1% below list) — sets the bar for 1% rule.
Location & tenants
- Location reads 76/100 on livability (#391 in PA, #3,538 nationally) — a middle-class / working-renter tenant base. Strengths: crime A+, cost of living A+, housing A+; Watch: amenities C-, commute F, employment F.
- Wyoming Valley West SD (suburban): math 18% / reading 42% proficiency, ranked #445 of 539 in PA (top 83%) — families likely to look elsewhere, expect single-tenant / working-renter base with shorter leases.
- Zoned schools: Dana El Ctr (math 20% / reading 54%, grade F, #1,004 of 1,518 statewide, top 68%, 617 students, 100% FRL); Wyoming Valley West Ms (math 13% / reading 41%, grade F, #404 of 512 statewide, top 80%, 1,191 students, 100% FRL); Wyoming Valley West Shs (math 57% / reading 24%, grade F, #255 of 437 statewide, top 60%, 1,357 students, 100% FRL) — zoned schools average 100% FRL vs 56% district-wide (44 pts higher); higher-poverty schools than district average — tighter screening recommended.
- Market conditions: 18 active listings in the ZIP; 20 comparable units currently listed for rent nearby; rentals at typical pace (median 23d on market — plan ~3-4 weeks tenant-placement turnaround); 40% of comp listings sitting > 30 days — soft ceiling on asking rent; 349 units permitted in Luzerne County in 2024 (16 in 5+ unit buildings).
Forward outlook
- In year one you build about $21k of equity ($1k loan paydown + $20k appreciation (10.0% local appreciation)).
- Luzerne County population projected at +4% by 2050 — modest demand growth; plan on rents tracking national, not racing it.
- By year 2, paydown + projected appreciation supports a ~$34k cash-out refi (75% LTV) — recoverable capital for the next deal without selling this one.
Negotiation context
- Only 3 days on market — expect competitive offers; lowballing is unlikely to land.
- 2 sale attempts since 11y ago with the ask held roughly flat each time — persistent listings suggest the price (not the market) is what's stuck; bring a comps-based counter.
- Current owner paid $120k; list at $200k implies a 67% gain — meaningful room to come down on a strong offer.
Risks & watch-outs
- Watch-outs: built in 1920 — expect roof / HVAC / electrical / plumbing capex.
Questions for the listing agent
- What do current leases actually rent for vs. the listed asking? Can we see a recent rent roll and the last 12 months of T-12 income?
- Built in 1920 — when were the roof, HVAC, electrical panel, plumbing, and water heater last replaced?
- Is there a deadline driving the sale (1031 exchange, divorce, estate, relocation)? That informs how much negotiation room exists.
- Schools are D-rated, which usually means shorter tenancies and higher turnover. Who's the typical renter profile here, and what's been the actual vacancy rate?
- The area grade is low — what's the realistic commute time and amenity access for the typical tenant pool here? Any planned neighborhood developments (good or bad) we should know about?
- What's the average days-on-market for RENTAL listings here right now (not sales)? A rising rental-DOM trend means longer vacancies and softer asking-rent achievability than the comps imply.
- What's the recent tenant-quality profile in this submarket — average credit score on applications, eviction rate, late-payment / NSF rate, and stable-employment percentage? A property-management company in the area should have these aggregated.
- How much new for-sale + rental construction is in the pipeline within 1–3 miles? Heavy new supply typically softens prices + rents 12–24 months out; constrained supply supports both.
Investment metrics
- 1% rule
- 0.71% ✗
- Cap rate
- 5.28%
- Cash-on-cash
- -3.62%
- DSCR
- 0.84
- GRM
- 11.8
CMA / ARV
- ARV (on-the-fly)
- $172,860
- Comps found
- 12
Show comp detail 12 sales within ~0.75 mi
| Address | Dist | Beds/Ba | Sqft | Sold | Price | $/sf | Match |
|---|---|---|---|---|---|---|---|
| 750 Miller St | 0.12mi | 3/1.5 | 1,250 (-7%) | 1mo | $176,000 | $141 | 82 |
| 820 North St | 0.16mi | 3/1.0 | 1,440 (+8%) | 9mo | $135,000 | $94 | 70 |
| 385 Vaughn St | 0.54mi | 3/1.0 | 1,368 (+2%) | 0mo | $120,000 | $88 | 69 |
| 18 Linden St | 0.32mi | 3/1.0 | 1,219 (-9%) | 2mo | $190,000 | $156 | 67 |
| 738 Bennett St | 0.02mi | 3/1.0 | 1,167 (-13%) | 12mo | $230,000 | $197 | 66 |
| 831 N Walnut St | 0.15mi | 3/1.0 | 1,200 (-10%) | 10mo | $150,000 | $125 | 65 |
| 814 Charles St | 0.12mi | 4/2.0 (+1) | 1,189 (-11%) | 6mo | $130,000 | $109 | 64 |
| 548 Miller St | 0.31mi | 3/1.5 | 1,500 (+12%) | 7mo | $105,000 | $70 | 60 |
| 276 Academy St | 0.49mi | 3/2.0 | 1,420 (+6%) | 12mo | $228,000 | $161 | 56 |
| 281 Academy St | 0.52mi | 3/1.0 | 1,452 (+8%) | 12mo | $187,000 | $129 | 50 |
| 19 Cooper St | 0.63mi | 4/2.0 (+1) | 1,389 (+4%) | 13mo | $143,730 | $103 | 47 |
| 40 Evans St | 0.71mi | 4/1.0 (+1) | 1,250 (-7%) | 11mo | $165,000 | $132 | 40 |
Match score weights: distance 35% · size 25% · config 20% · recency 20%. Top-matched comps best support the ARV.
Projected returns pro-forma
10.0% appreciation · 3.0% rent growth · sell at horizon
- IRR
- 21.7%
- Equity multiple
- 2.75×
- Total profit
- $98,069
- Equity at exit
- $180,086
- IRR
- 19.5%
- Equity multiple
- 6.31×
- Total profit
- $297,193
- Equity at exit
- $388,362
Cash invested: $55,972 (down + closing). Projections, not guarantees.
Landlord ↔ Tenant lean methodology
- Overall (STATE)
- 62 Landlord-Friendly
- State Pennsylvania
- 62 Landlord-Friendly · EVEN
- County
- — inherits STATE
- City
- — inherits STATE
ZIP-level market 18709
- Home prices YoY
- 12.7%
- Active inventory
- 18
- Price-to-rent
- 11.8×
Monthly cashflow live
- Estimated rent
- $1,418 high interval (Pro) →
- Mortgage (P&I)
- −$1,048
- Tax from tax record
- −$157 /mo · $1,889/yr
- Insurance
- −$83
- HOA
- −$0
- Vacancy / Maint / Mgmt
- −$298
- Net cashflow
- $-169
Break-even live
Sensitivity live
| Price | -10% $-56 | -5% $-112 | +0% $-169 | +5% $-226 | +10% $-282 |
|---|---|---|---|---|---|
| Rent | -10% $-281 | -5% $-225 | +0% $-169 | +5% $-113 | +10% $-57 |
| Rate | -1.0pp $-68 | -0.5pp $-118 | base $-169 | +0.5pp $-221 | +1.0pp $-274 |
UW: 25.0% down · 7.5% · 30yr · 1.5% tax · 5.0% vac · 8.0% maint · 8.0% mgmt
Financing live
Cash to close
- Down payment
- $49,975
- Closing costs
- $5,997
- Reserves months
- —
- Total cash needed
- —
Loan-product check · same deal, 3 products live
Conventional
25% down · 7.5% · 30yr
- Down + closing
- —
- Monthly P&I
- —
- Monthly cashflow
- —
- DSCR
- —
- Eligible?
- —
Personal DTI + credit; lowest rate.
DSCR
20% down · 8.5% · 30yr
- Down + closing
- —
- Monthly P&I
- —
- Monthly cashflow
- —
- DSCR
- —
- Eligible?
- —
No personal income docs; deal must DSCR.
Hard money
10% down · 12.0% · 12mo
- Down + closing
- —
- Monthly P&I
- —
- Monthly cashflow
- —
- DSCR
- —
- Eligible?
- —
Short-term bridge; refi at stabilization.
Rent comps 20 comps
| Address | Beds | Baths | Sqft | Rent | $/sqft | DOM | Units | Dist |
|---|---|---|---|---|---|---|---|---|
| 1154 Murray St Kingston, PA | 2.0 | 1.5 | 1152 | $1,600 | $1.39 | 45d | 1 | 0.88mi |
| 321 Shoemaker St Kingston, PA | 3.0 | 1.5 | 1598 | $1,750 | $1.10 | 23d | 1 | 0.90mi |
| 942 Wyoming Ave Unit A Forty Fort, PA | 2.0 | 1.5 | 1054 | $1,600 | $1.52 | 45d | 1 | 1.08mi |
| 109 Penn St Unit 1 Kingston, PA | 3.0 | 1.0 | 1200 | $1,400 | $1.17 | 15d | 1 | 1.15mi |
| 109 Penn St Kingston, PA | 3.0 | 1.0 | 1200 | $1,400 | $1.17 | 45d | 1 | 1.15mi |
| 9 Snowden St Forty Fort, PA | 3.0 | 1.0 | 1500 | $1,250 | $0.83 | 23d | 1 | 1.16mi |
| 256 E Grove St Kingston, PA | 2.0 | 1.0 | 1000 | $1,250 | $1.25 | 15d | 1 | 1.17mi |
| 27 1/2 Penn St Kingston, PA | 3.0 | 1.0 | 1200 | $1,400 | $1.17 | 45d | 1 | 1.25mi |
| 27 Penn St Kingston, PA | 3.0 | 1.5 | 1225 | $1,550 | $1.27 | 23d | 1 | 1.28mi |
| 41 Pulaski St Kingston, PA | 3.0 | 1.5 | 1292 | $1,450 | $1.12 | 23d | 1 | 1.30mi |
| 59 Price St Unit 2 Kingston, PA | 3.0 | 1.0 | 1000 | $1,100 | $1.10 | 45d | 1 | 1.31mi |
| 36 Pulaski St Kingston, PA | 3.0 | 2.0 | 1432 | $1,600 | $1.12 | 15d | 1 | 1.31mi |
| 182 Roosevelt St Kingston, PA | 2.0 | 1.0 | 1152 | $1,625 | $1.41 | 15d | 1 | 1.32mi |
| 47 Price St Apt 2 Kingston, PA | 2.0 | 1.0 | 1200 | $1,200 | $1.00 | 45d | 1 | 1.33mi |
| 98 E Walnut St Kingston, PA | 3.0 | 1.0 | 1280 | $1,500 | $1.17 | 23d | 1 | 1.36mi |
| 104 Meyers St Kingston, PA | 3.0 | 1.0 | 1200 | $1,495 | $1.25 | 45d | 1 | 1.36mi |
| 151 E Walnut St Kingston, PA | 2.0 | 1.0 | 900 | $1,000 | $1.11 | 15d | 1 | 1.46mi |
| 157 E Walnut St Kingston, PA | 2.0 | 1.0 | 900 | $1,000 | $1.11 | 15d | 1 | 1.47mi |
| 341 Hughes St Unit 1 Swoyersville, PA | 2.0 | 1.0 | 950 | $1,175 | $1.24 | 45d | 1 | 1.48mi |
| 365 N Maple Ave Kingston, PA | 3.0 | 1.0 | 1600 | $1,400 | $0.88 | 23d | 1 | 1.48mi |
Listing history 4 events
-
2026-06-09status $199,900 Pending 3 DOM
-
2026-06-08days on market $199,900 Active 3 DOM
-
2026-06-07remarks 194-char remark
-
2026-06-07$199,900 Active 2 DOM
ⓘ Source: listings_history table (triggers on properties + properties_extension) + one-shot
backfill from property_details.listing_events for pre-trigger history.
Tax reassessment forecast PA · Partial reset (capped growth)
- Current annual tax
- $1,889 · $157/mo
- Projected year-2 tax
- $2,524 · $210/mo
- Expected delta
- +$635/yr (+$53/mo · 33.6%)
ⓘ Screening estimate from a state-policy table — verify with the county assessor before closing.
Climate risk First Street
- Flood 1/10 Low FEMA zone X (unshaded) · 0% chance over 30 yrs
- Wildfire 2/10 Low
- Heat 4/10 Moderate 7 d/yr ≥97°F today · 16 d/yr by 30 yrs out
- Wind 3/10 Moderate 5% chance of damaging wind over 30 yrs
- Air quality 3/10 Moderate 2 unhealthy d/yr today · 4 by 30 yrs out
Nearby sold comps map
Loading sold comps map…
Walkable amenities ~0.75 mi
Loading nearby amenities…
Taxation est. · year 1
- Rental income
- $17,012
- − Mortgage interest
- −$11,198
- − Property taxes
- −$1,889
- − Insurance
- −$1,000
- − Repairs & maintenance
- −$1,361
- − Management
- −$1,361
- − Depreciation
- −$5,815
- Taxable loss
- −$5,611
- Est. tax savings @ 24.0%
- +$1,347
- After-tax cash flow
- $-682/yr
For passive investors: Depreciation is non-cash, so a rental often shows a tax loss while cash-flowing — sheltering income. Rental losses are passive: they offset passive income freely, and up to $25,000/yr can offset ordinary (W-2) income if you actively participate and your MAGI is under $100k (phasing out to $0 by $150k); unused losses carry forward. On sale, claimed depreciation is recaptured at up to 25%, and gains may owe capital-gains tax (a 1031 exchange can defer both). Figures are a year-1 estimate at your 24.0% rate — not tax advice; consult a CPA.
Schools (NCES district)
- District
- Wyoming Valley West SD
- NCES district ID
- 4225950
- Math proficiency
- 18% ▼ -11.00%
- Reading proficiency
- 42% ▼ -12.00%
- Median HH income
- $42,437
- Composite
- 25.38/100
- National rank
- #7470
- State rank
- #445 of 539 in PA
Livability — Luzerne
- Score
- 76/100
- State rank
- #391
- US rank
- #3538
Category grades
Schools grade is shown separately in the Schools card above.
Census & demographics
- Census place
- Luzerne, PA
- City population
- 2,959
- Population (ZIP)
- 2,959
Population outlook (Luzerne County) Hauer SSP2
- Today (2025)
- 319,505 people
- By 2030
- 319,943 · +0.1%
- By 2040
- 322,643 · +1.0%
- By 2050
- 330,817 · +3.5%
- By 2075
- 379,145 · +18.7%
- By 2100
- 431,908 · +35.2%
Race, ethnicity, and origin ACS 2023
- Neighborhood character
- Predominantly White (89%)
- Race & ethnicity
- White 89% Two or more races 6% Black 4% Hispanic / Latino 1%
- Common ancestry
- Romanian 18% Scotch-Irish 8% Iranian 4%
- Foreign-born
- 1%
- Languages at home
- 99% English-only · Other Indo-European 1%
Political lean MEDSL · Luzerne
- 2024 margin
- R (+19.2) · D 40.0% · R 59.2%
- 2008→2024 swing
- -27.6pp toward R · 2008: 8.4pp · 2024: -19.2pp
- All cycles
- 2024: R+19.2 2020: R+14.4 2016: R+19.6 2012: D+4.8 2008: D+8.4
Not yet ingested
- Civics
- —
Market trends
- HPI YoY
- ▲ 28.54%
- Current HPI
- 254.1718
- Rent YoY
- —
- Metro
- —
- State GDP YoY
- ▲ 1.68%
- F500 in state
- 34
Industry mix (Fortune 500 HQ in PA)
| Industry | F500 HQs | Revenue |
|---|---|---|
| Healthcare | 2 | $309B |
|
||
| Insurance | 2 | $27B |
|
||
| Telecommunications / Media | 1 | $124B |
|
||
| Industrial Distribution | 1 | $22B |
|
||
| Financial Services | 1 | $20B |
|
||
| Chemicals / Materials | 1 | $18B |
|
||
Price history
+61.9% since first listed4 events — show timeline
- 2026-06-03 Listed $199,900 LCAR
- 2016-01-04 Sold (Public Records) $120,000 Public Records
- 2015-12-18 Sold (MLS) $120,000 LCAR
- 2015-10-18 Listed $123,500 LCAR
Property tax history
+2.5%/yrLatest (2026): $1,889 · +0.7% YoY. Source: county tax records.
Cash-flow waterfall
monthlySold comps — $/sqft
last 12 mo · ≤1 miLoading sold comps…