 🏷️ Likely Rental
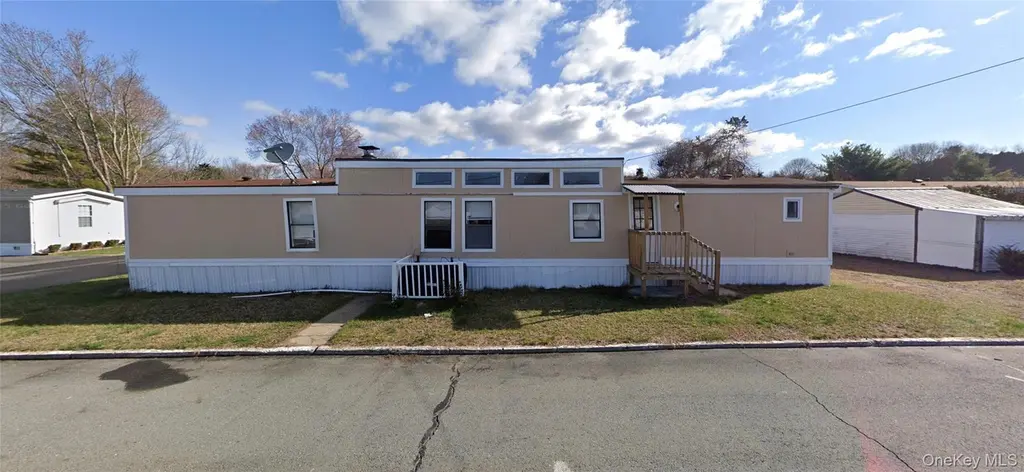
26 Tiger Lily Dr · Port Jervis, NY
Flood risk 6/10 · Moderate
- FEMA flood zone
- X (unshaded)
- Chance of flooding over 30 yrs
- 0.75%
- Est. flood insurance / yr
- $507 – $1,088
Fire risk 3/10 · Minor
- Est. fire insurance / yr
- $691 – $1,283
Heat risk 4/10 · Minor
- Hot days now (above 97°F)
- 7 days/yr
- Hot days in 30 yrs
- 16 days/yr
Wind risk 4/10 · Minor
- Chance of severe wind over 30 yrs
- 9.0%
Air-quality risk 2/10 · Minimal
- Unhealthy air days now
- 1 days/yr
- Unhealthy air days in 30 yrs
- 2 days/yr
Risk factors via First Street. Map © Google.
Why this score? — see what drove the B+ grade
The composite is a weighted blend of 9 inputs, each scored 0–100. Each bar is that input's sub-score; the figure is the points it added to the 100-point composite (weight × sub-score).
- Cash flow +30.0/30.0
- ARV discount +15.0/15.0
- 1% rule +10.0/10.0
- DSCR +10.0/10.0
- Schools +3.9/10.0
- Livability +3.5/5.0
- Rent growth +2.5/5.0
- Condition / age +2.2/5.0
- Appreciation +0.0/10.0
$54,891
🖨 Deal sheet 📄 Offer letter ✓ Due diligence
Listing remarks MLS
26 Tiger Lily Drive – 3-Bedroom, 2-Bath Mobile Home in Port Jervis Bright and spacious ranch-style mobile home located in an RHP Properties land-lease community. This well-maintained home offers three bedrooms, including a primary suite with a private full bathroom, plus an additional full bath for added convenience. The home features a long, open layout with wood-style flooring in the main living areas, carpeted bedrooms, and large windows that provide abundant natural light throughout. Ceiling fans are installed in multiple rooms to enhance comfort. Additional highlights include a private driveway with space for up to three vehicles and a storage shed for added functionality. The home is heated with kerosene and uses propane for cooking. Community & Lot Details: Monthly lot rent: $968 (includes water, sewer, and taxes) Trash fee: $24.15/month Pet policy: Maximum of 2 pets (breed restrictions apply; 45 lb weight limit) Buyer approval required by park (minimum 550 credit score) Conveniently located in Port Jervis near shopping, dining, and outdoor recreation, this home offers an affordable opportunity for comfortable living in a well-maintained community. please do not drive by
Key facts
- Master suite
- Extra storage
- Ceiling fans
Tags
Neighborhood map
What this means for you Summary
Snapshot
- This is a 3-bed/2.0-bath manufactured listed at $55k. Condition is rated fair.
Deal economics
- At list price, monthly cash flow is $1k ($15k/yr) — positive.
- The deal already cash-flows at list — no discount required.
- Meets the 1% rule at list price ($2k rent vs $55k).
- Recommended offer: $52k (6.0% below list) — sets the bar for market timing.
- Cap rate 33.8% vs local median 4.6% in Port Jervis — top-decile yield for the area; either an underpriced asset or a hidden risk that comps aren't pricing in. Stress-test before assuming the spread holds.
Location & tenants
- Location reads 69/100 on livability (#475 in NY) — a middle-class / working-renter tenant base. Strengths: health & safety A+, amenities B+, cost of living B+; Watch: schools C-, housing C-, crime D+.
- Port Jervis City School District (rural): math 43% / reading 50% proficiency, ranked #451 of 590 in NY (top 76%) — families likely to look elsewhere, expect single-tenant / working-renter base with shorter leases.
- Market conditions: 107 active listings in the ZIP; 2 comparable units currently listed for rent nearby; 1,746 units permitted in Orange County in 2024 (1,265 in 5+ unit buildings).
- This rent runs 37% of the median local income ($68k/yr) — at the standard rent-burdened threshold; future hikes will face affordability resistance.
Forward outlook
- Local home prices are declining (-3.0%/yr); year-one equity from $379 of loan paydown is wiped out by about $2k of value loss. Plan a longer hold.
- At projected returns (-3.0% appreciation + 3.0% rent growth), your $15k cash investment doubles in ~2 years — after that, you're playing with house money.
Negotiation context
- It's been on market 90 days — a 6% lower offer ($52k) is reasonable based on typical stale-listing flexibility.
Risks & watch-outs
- Climate carrying-cost: major flood risk — expect insurance premiums to compound above CPI over the hold.
Questions for the listing agent
- It's been on market 90 days. Have you received any prior offers? Is the seller open to a 6% concession, seller financing, or rate buy-down credit?
- Have any recent inspections been done? Can we get a copy of the seller's disclosures and any deferred-maintenance estimates?
- Why hasn't it sold? Are there any deal-killer items the seller is aware of (foundation, flood, title, zoning, code violations)?
- Is there a deadline driving the sale (1031 exchange, divorce, estate, relocation)? That informs how much negotiation room exists.
- Crime grade is D in this area — have there been break-ins, vandalism, or insurance claims at this property in the last 3 years? What carrier currently insures it and at what premium?
- What's the average days-on-market for RENTAL listings here right now (not sales)? A rising rental-DOM trend means longer vacancies and softer asking-rent achievability than the comps imply.
- What's the recent tenant-quality profile in this submarket — average credit score on applications, eviction rate, late-payment / NSF rate, and stable-employment percentage? A property-management company in the area should have these aggregated.
- How much new for-sale + rental construction is in the pipeline within 1–3 miles? Heavy new supply typically softens prices + rents 12–24 months out; constrained supply supports both.
Investment metrics
- 1% rule
- 3.78% ✓
- Cap rate
- 33.80%
- Cash-on-cash
- 98.22%
- DSCR
- 5.37
- GRM
- 2.2
CMA / ARV
- ARV (on-the-fly)
- $95,408
- Comps found
- 1
Show comp detail 1 sale within ~0.75 mi
| Address | Dist | Beds/Ba | Sqft | Sold | Price | $/sf | Match |
|---|---|---|---|---|---|---|---|
| 20 Forrest Dr | 0.37mi | 2/2.0 (-1) | 1,008 (-6%) | 12mo | $90,000 | $89 | 57 |
Match score weights: distance 35% · size 25% · config 20% · recency 20%. Top-matched comps best support the ARV.
Projected returns pro-forma
-3.0% appreciation · 3.0% rent growth · sell at horizon
- IRR
- 99.2%
- Equity multiple
- 5.64×
- Total profit
- $71,260
- Equity at exit
- $8,184
- IRR
- —
- Equity multiple
- 11.76×
- Total profit
- $165,351
- Equity at exit
- $4,746
Cash invested: $15,369 (down + closing). Projections, not guarantees.
Landlord ↔ Tenant lean methodology
- Overall (STATE)
- 15 Strongly Tenant-Friendly
- State New York
- 15 Strongly Tenant-Friendly · D+10
- County
- — inherits STATE
- City
- — inherits STATE
ZIP-level market 12771
- Home prices YoY
- -20.1%
- Active inventory
- 107
- Price-to-rent
- 2.2×
Monthly cashflow live
- Estimated rent
- $2,073 medium interval (Pro) →
- Mortgage (P&I)
- −$288
- Tax est. 1.5%
- −$69 /mo · $823/yr
- Insurance
- −$23
- HOA
- −$0
- Vacancy / Maint / Mgmt
- −$435
- Net cashflow
- $1,258
Break-even live
UW: 25.0% down · 7.5% · 30yr · 1.5% tax · 5.0% vac · 8.0% maint · 8.0% mgmt
Financing live
Cash to close
- Down payment
- $13,723
- Closing costs
- $1,647
- Reserves months
- —
- Total cash needed
- —
Loan-product check · same deal, 3 products live
Conventional
25% down · 7.5% · 30yr
- Down + closing
- —
- Monthly P&I
- —
- Monthly cashflow
- —
- DSCR
- —
- Eligible?
- —
Personal DTI + credit; lowest rate.
DSCR
20% down · 8.5% · 30yr
- Down + closing
- —
- Monthly P&I
- —
- Monthly cashflow
- —
- DSCR
- —
- Eligible?
- —
No personal income docs; deal must DSCR.
Hard money
10% down · 12.0% · 12mo
- Down + closing
- —
- Monthly P&I
- —
- Monthly cashflow
- —
- DSCR
- —
- Eligible?
- —
Short-term bridge; refi at stabilization.
Rent comps 2 comps
| Address | Beds | Baths | Sqft | Rent | $/sqft | DOM | Units | Dist |
|---|---|---|---|---|---|---|---|---|
| 23 Daisy Dr Port Jervis, NY | 3.0 | 1.5 | 950 | $1,800 | $1.89 | 14d | 1 | 0.08mi |
| 15 Hobson Rd Port Jervis, NY | 2.0 | 1.0 | 940 | $2,000 | $2.13 | 43d | 1 | 0.28mi |
Listing history 16 events
-
2026-06-18days on market $54,891 Active 90 DOM
-
2026-06-17days on market $54,891 Active 89 DOM
-
2026-06-16days on market $54,891 Active 88 DOM
-
2026-06-15days on market $54,891 Active 87 DOM
-
2026-06-14days on market $54,891 Active 85 DOM
-
2026-06-13days on market $54,891 Active 84 DOM
-
2026-06-10days on market $54,891 Active 82 DOM
-
2026-06-09days on market $54,891 Active 81 DOM
-
2026-06-08days on market $54,891 Active 80 DOM
-
2026-06-07days on market $54,891 Active 79 DOM
-
2026-06-03days on market $54,891 Active 75 DOM
-
2026-06-02days on market $54,891 Active 74 DOM
-
2026-06-01days on market $54,891 Active 73 DOM
-
2026-05-31days on market $54,891 Active 72 DOM
-
2026-05-30days on market $54,891 Active 71 DOM
-
2026-03-20$59,000 Active 1212-char remark
Show marketing remark (1212 chars)
26 Tiger Lily Drive – 3-Bedroom, 2-Bath Mobile Home in Port Jervis Bright and spacious ranch-style mobile home located in an RHP Properties land-lease community. This well-maintained home offers three bedrooms, including a primary suite with a private full bathroom, plus an additional full bath for added convenience. The home features a long, open layout with wood-style flooring in the main living areas, carpeted bedrooms, and large windows that provide abundant natural light throughout. Ceiling fans are installed in multiple rooms to enhance comfort. Additional highlights include a private driveway with space for up to three vehicles and a storage shed for added functionality. The home is heated with kerosene and uses propane for cooking. Community & Lot Details: Monthly lot rent: $968 (includes water, sewer, and taxes) Trash fee: $24.15/month Pet policy: Maximum of 2 pets (breed restrictions apply; 45 lb weight limit) Buyer approval required by park (minimum 550 credit score) Conveniently located in Port Jervis near shopping, dining, and outdoor recreation, this home offers an affordable opportunity for comfortable living in a well-maintained community. please do not drive by
ⓘ Source: listings_history table (triggers on properties + properties_extension) + one-shot
backfill from property_details.listing_events for pre-trigger history.
Climate risk First Street
- Flood 6/10 Major FEMA zone X (unshaded) · 75% chance over 30 yrs
- Wildfire 3/10 Moderate
- Heat 4/10 Moderate 7 d/yr ≥97°F today · 16 d/yr by 30 yrs out
- Wind 4/10 Moderate 9% chance of damaging wind over 30 yrs
- Air quality 2/10 Low 1 unhealthy d/yr today · 2 by 30 yrs out
Nearby sold comps map
Loading sold comps map…
Walkable amenities ~0.75 mi
Loading nearby amenities…
Taxation est. · year 1
- Rental income
- $24,871
- − Mortgage interest
- −$3,075
- − Property taxes
- −$823
- − Insurance
- −$274
- − Repairs & maintenance
- −$1,990
- − Management
- −$1,990
- − Depreciation
- −$1,597
- Taxable income
- $15,122
- Est. tax owed @ 24.0%
- −$3,629
- After-tax cash flow
- $11,467/yr
For passive investors: Depreciation is non-cash, so a rental often shows a tax loss while cash-flowing — sheltering income. Rental losses are passive: they offset passive income freely, and up to $25,000/yr can offset ordinary (W-2) income if you actively participate and your MAGI is under $100k (phasing out to $0 by $150k); unused losses carry forward. On sale, claimed depreciation is recaptured at up to 25%, and gains may owe capital-gains tax (a 1031 exchange can defer both). Figures are a year-1 estimate at your 24.0% rate — not tax advice; consult a CPA.
Condition & rehab AI · 2 photos
This mobile home requires moderate repairs and maintenance, particularly to the exterior and landscaping, to improve its condition and value.
Repairs flagged
- Major exterior siding — Significant wear and tear
- Minor interior paint — Faded paint
Value-add opportunities
- Both Landscaping and exterior painting — Enhances curb appeal and resale value
- Both New flooring in bedrooms — Improves aesthetics and rental appeal
- Both Painting interior walls — Freshens up the home and enhances resale value
Renovation cost estimate screening
| Repair item | Severity | Est. cost |
|---|---|---|
| exterior siding · Significant wear and tear | Major | $15,000–50,000 |
| interior paint · Faded paint | Minor | $500–3,000 |
| Total estimated repair cost · 2 items | $15,500–53,000 |
Value-add ROI direction
- Both Landscaping and exterior painting — Enhances curb appeal and resale value ↑
- Both New flooring in bedrooms — Improves aesthetics and rental appeal ↑
- Both Painting interior walls — Freshens up the home and enhances resale value ↑
ⓘ Cost ranges are severity-bucket heuristics (US national rule-of-thumb). Get contractor quotes + a written scope before underwriting a rehab budget.
Schools (NCES district)
- District
- Port Jervis City School District
- NCES district ID
- 3623520
- Math proficiency
- 43% ▼ -7.00%
- Reading proficiency
- 50% ▲ 5.00%
- Median HH income
- $44,506
- Composite
- 39.33/100
- National rank
- #3984
- State rank
- #451 of 590 in NY
Livability — Port Jervis
- Score
- 69/100
- State rank
- #475
- US rank
- #8376
Category grades
Schools grade is shown separately in the Schools card above.
Census & demographics
- County
- Orange County · 267,004 people
- City population
- 14,049
- Metro
- Poughkeepsie-Newburgh-Middletown, NY
- Population (ZIP)
- 14,049
- Household income
- $68,136
- Rent vs Own
- Severe rent burden
- 792.0
Population outlook (Orange County) Hauer SSP2
- Today (2025)
- 379,830 people
- By 2030
- 378,955 · -0.2%
- By 2040
- 375,444 · -1.2%
- By 2050
- 369,311 · -2.8%
- By 2075
- 354,233 · -6.7%
- By 2100
- 318,150 · -16.2%
Race, ethnicity, and origin ACS 2023
- Neighborhood character
- Predominantly White (67%)
- Race & ethnicity
- White 67% Hispanic / Latino 18% Two or more races 11% Black 6% Asian 3% Native American 3%
- Hispanic origin (detail)
- Mexican 3% Puerto Rican 8% Dominican 2%
- Common ancestry
- Romanian 5% Iranian 4% Lithuanian 3%
- Foreign-born
- 10% · Canada, China, Jamaica
- Languages at home
- 84% English-only · Spanish 10% Other Indo-European 3% Chinese 2%
Political lean MEDSL · Orange
- 2024 margin
- Lean R (+8.4) · D 45.8% · R 54.2%
- 2008→2024 swing
- -12.5pp toward R · 2008: 4.1pp · 2024: -8.4pp
- All cycles
- 2024: R+8.4 2020: R+0.2 2016: R+6.5 2012: D+5.2 2008: D+4.1
Not yet ingested
- Civics
- —
Market trends
- HPI YoY
- ▼ -75.78%
- Current HPI
- 301.5132
- Rent YoY
- —
- Metro
- Poughkeepsie-Newburgh-Middletown, NY
- State GDP YoY
- ▲ 2.60%
- F500 in state
- 92
Industry mix (Fortune 500 HQ in NY)
| Industry | F500 HQs | Revenue |
|---|---|---|
| Financial Services | 10 | $950B |
|
||
| Consumer Goods | 9 | $162B |
|
||
| Insurance | 4 | $225B |
|
||
| Telecommunications | 2 | $144B |
|
||
| Pharmaceuticals | 2 | $112B |
|
||
| Media / Entertainment | 2 | $69B |
|
||
Price history
1 event — show timeline
- 2026-03-20 Listed $59,000 OneKey® MLS as Distributed by MLS Grid
Cash-flow waterfall
monthlySold comps — $/sqft
last 12 mo · ≤1 miLoading sold comps…