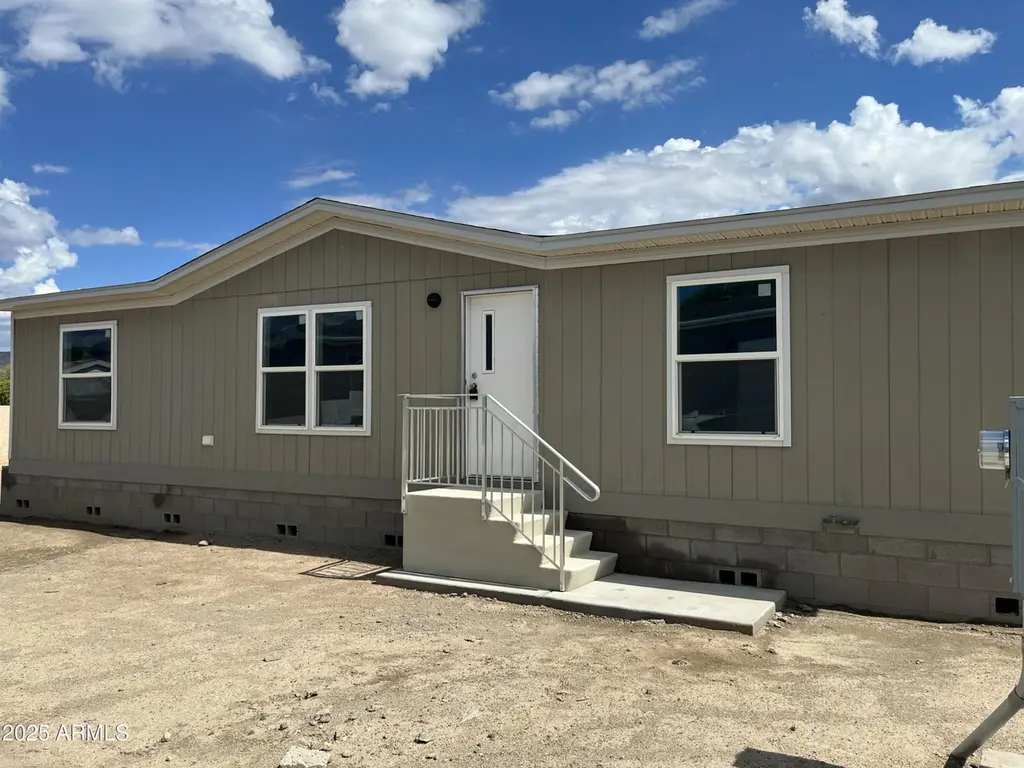
19500 E Gregory St #16 · Black Canyon City, AZ
Flood risk 4/10 · Minor
- FEMA flood zone
- AE
- Chance of flooding over 30 yrs
- 0.23%
- Est. flood insurance / yr
- $1,737 – $8,500
Fire risk 7/10 · Major
- Est. fire insurance / yr
- $610 – $1,132
Heat risk 8/10 · Major
- Hot days now (above 109°F)
- 7 days/yr
- Hot days in 30 yrs
- 19 days/yr
Wind risk 1/10 · Minimal
- Chance of severe wind over 30 yrs
- —
Air-quality risk 2/10 · Minimal
- Unhealthy air days now
- 1 days/yr
- Unhealthy air days in 30 yrs
- 1 days/yr
Risk factors via First Street. Map © Google.
Why this score? — see what drove the A- grade
The composite is a weighted blend of 9 inputs, each scored 0–100. Each bar is that input's sub-score; the figure is the points it added to the 100-point composite (weight × sub-score).
- Cash flow +27.3/30.0
- ARV discount +15.0/15.0
- Appreciation +10.0/10.0
- DSCR +9.5/10.0
- 1% rule +7.4/10.0
- Condition / age +4.0/5.0
- Livability +2.9/5.0
- Schools +2.8/10.0
- Rent growth +2.5/5.0
$165,000
🖨 Deal sheet 📄 Offer letter ✓ Due diligence
Listing remarks
Enjoy living away from the bustle of Phoenix with unbeatable mountain views! New build in a gated 55+ community with clubhouse featuring fitness center, full kitchen, large dining area, billiards, and outdoor community pool and spa. Lot rent includes water, sewer, and trash. With accepted offer, seller may either partially assist with closing costs, or construct a small carport awning. Prospective new residents must submit an application for park approval.
Key facts
- Gated community
- Fitness center
- Clubhouse
Tags
Property features AI
Finance
- Other: Directions: Exit the freeway, go left, then right onto Black Canyon Hwy. Turn right at Mud Springs Rd, veering left at Gregory St to entrance to park. Once through the gate, take an immediate left, then the first right. Property will be second on the left.
- Financial info: Current financing: Conventional
- HOA & community: Land lease: $515 monthly; No association fees included; Community pool; Community spa (heated); Fitness center
Exterior
- Parking: 2 covered parking spaces; 2 open parking spaces; Common parking; 2 carport spaces
- Security: Gated community
- Utilities: Private water company; Septic tank
- Home design: Manufactured/mobile home; Leasehold ownership; Complete spec home
- Construction: Wood frame and slump block construction; Composition roof; Building area per builder
- Exterior features: Block and partial fencing; Dirt in front and back yard; Private maintained road access; Mountain view
Interior
- Kitchen: Refrigerator; Dishwasher; Laminate countertops
- Bedrooms: 3 possible bedrooms
- Flooring: Other flooring
- Bathrooms: 3 full bathrooms
- Heating & cooling: Central air conditioning; Electric heating
- Interior features: Eat-in kitchen; Full bathroom in master bedroom; Laminate counters; Dual-pane windows
- Laundry & utility: No laundry hookups (none listed)
Neighborhood map
What this means for you Summary
Snapshot
- This is a 3-bed/3.0-bath manufactured listed at $165k. Condition is rated good.
Deal economics
- At list price, monthly cash flow is $53 ($637/yr) — positive.
- The deal already cash-flows at list — no discount required.
- Meets the 1% rule at list price ($2k rent vs $165k).
- Recommended offer: $155k (6.0% below list) — sets the bar for market timing.
- Cap rate 9.8% vs local median 4.9% in Black Canyon City — top-decile yield for the area; either an underpriced asset or a hidden risk that comps aren't pricing in. Stress-test before assuming the spread holds.
Location & tenants
- Location reads 58/100 on livability (#213 in AZ) — a working-class tenant base; expect higher turnover. Strengths: cost of living A+, housing A+, crime A; Watch: schools F, amenities F, commute F.
- Canon Elementary District (4484) (rural): math 25% / reading 35% proficiency, ranked #294 of 501 in AZ (top 59%) — families likely to look elsewhere, expect single-tenant / working-renter base with shorter leases; 65% free/reduced lunch — lower-income household profile, screen leases tightly.
- Market conditions: 45 active listings in the ZIP; 2,062 units permitted in Yavapai County in 2024 (98 in 5+ unit buildings).
Forward outlook
- In year one you build about $18k of equity ($1k loan paydown + $16k appreciation (10.0% local appreciation)).
- Yavapai County population projected at +10% by 2050 — modest demand growth; plan on rents tracking national, not racing it.
- At projected returns (10.0% appreciation + 3.0% rent growth), your $46k cash investment doubles in ~3 years — after that, you're playing with house money.
- By year 3, paydown + projected appreciation supports a ~$45k cash-out refi (75% LTV) — recoverable capital for the next deal without selling this one.
Negotiation context
- It's been on market 62 days — a 6% lower offer ($155k) is reasonable based on typical stale-listing flexibility.
- 3 sale attempts with the ask held roughly flat each time — persistent listings suggest the price (not the market) is what's stuck; bring a comps-based counter.
Risks & watch-outs
- Watch-outs: flood insurance adds $427/mo.
- Climate carrying-cost: in FEMA flood zone AE (mandatory federal flood insurance); major wildfire risk; extreme-heat days projected 7→19/yr by 2055 (HVAC capex compounding) — expect insurance premiums to compound above CPI over the hold.
Questions for the listing agent
- It's been on market 62 days. Have you received any prior offers? Is the seller open to a 6% concession, seller financing, or rate buy-down credit?
- What's the actual annual flood-insurance premium (NFIP or private), and is the property in a SFHA with mandatory coverage?
- Why hasn't it sold? Are there any deal-killer items the seller is aware of (foundation, flood, title, zoning, code violations)?
- Is there a deadline driving the sale (1031 exchange, divorce, estate, relocation)? That informs how much negotiation room exists.
- Schools are F-rated, which usually means shorter tenancies and higher turnover. Who's the typical renter profile here, and what's been the actual vacancy rate?
- What's the average days-on-market for RENTAL listings here right now (not sales)? A rising rental-DOM trend means longer vacancies and softer asking-rent achievability than the comps imply.
- What's the recent tenant-quality profile in this submarket — average credit score on applications, eviction rate, late-payment / NSF rate, and stable-employment percentage? A property-management company in the area should have these aggregated.
- How much new for-sale + rental construction is in the pipeline within 1–3 miles? Heavy new supply typically softens prices + rents 12–24 months out; constrained supply supports both.
Investment metrics
- 1% rule
- 1.24% ✓
- Cap rate
- 9.78%
- Cash-on-cash
- 12.46%
- DSCR
- 1.55
- GRM
- 6.7
CMA / ARV
- ARV (on-the-fly)
- $268,576
- Comps found
- 8
Show comp detail 8 sales within ~0.75 mi
| Address | Dist | Beds/Ba | Sqft | Sold | Price | $/sf | Match |
|---|---|---|---|---|---|---|---|
| 34580 S Albins St | 0.37mi | 3/2.0 | 1,189 (-4%) | 9mo | $260,000 | $219 | 66 |
| 19275 E Saguaro Dr | 0.35mi | 2/2.0 (-1) | 1,134 (-8%) | 6mo | $263,000 | $232 | 57 |
| 34775 S Cholla Dr | 0.50mi | 3/2.0 | 1,222 (-1%) | 18mo | $325,000 | $266 | 57 |
| 19741 E Indian Hills Dr | 0.51mi | 3/2.0 | 1,345 (+9%) | 2mo | $256,000 | $190 | 56 |
| 34930 S Cholla Dr | 0.44mi | 3/2.0 | 1,114 (-10%) | 5mo | $179,000 | $161 | 55 |
| 19381 E Spencer St | 0.17mi | 2/2.0 (-1) | 1,152 (-6%) | 24mo | $150,000 | $130 | 52 |
| 34965 S School Loop Rd | 0.51mi | 3/1.0 | 1,346 (+9%) | 19mo | $241,000 | $179 | 37 |
| 34450 S K Field Rd | 0.74mi | 3/2.0 | 1,094 (-11%) | 21mo | $238,500 | $218 | 25 |
Match score weights: distance 35% · size 25% · config 20% · recency 20%. Top-matched comps best support the ARV.
Projected returns pro-forma
10.0% appreciation · 3.0% rent growth · sell at horizon
- IRR
- 25.3%
- Equity multiple
- 3.02×
- Total profit
- $93,536
- Equity at exit
- $148,645
- IRR
- 22.4%
- Equity multiple
- 6.92×
- Total profit
- $273,374
- Equity at exit
- $320,559
Cash invested: $46,200 (down + closing). Projections, not guarantees.
Landlord ↔ Tenant lean methodology
- Overall (STATE)
- 87 Strongly Landlord-Friendly
- State Arizona
- 87 Strongly Landlord-Friendly · R+3
- County
- — inherits STATE
- City
- — inherits STATE
ZIP-level market 85324
- Home prices YoY
- 7.5%
- Active inventory
- 45
- Price-to-rent
- 6.7×
Monthly cashflow live
- Estimated rent
- $2,050 medium interval (Pro) →
- Mortgage (P&I)
- −$865
- Tax est. 1.5%
- −$206 /mo · $2,475/yr
- Insurance
- −$69
- Flood insurance flood zone
- −$427 /mo · $5,118/yr
- HOA
- −$0
- Vacancy / Maint / Mgmt
- −$431
- Net cashflow
- $53
Break-even live
UW: 25.0% down · 7.5% · 30yr · 1.5% tax · 5.0% vac · 8.0% maint · 8.0% mgmt
Financing live
Cash to close
- Down payment
- $41,250
- Closing costs
- $4,950
- Reserves months
- —
- Total cash needed
- —
Loan-product check · same deal, 3 products live
Conventional
25% down · 7.5% · 30yr
- Down + closing
- —
- Monthly P&I
- —
- Monthly cashflow
- —
- DSCR
- —
- Eligible?
- —
Personal DTI + credit; lowest rate.
DSCR
20% down · 8.5% · 30yr
- Down + closing
- —
- Monthly P&I
- —
- Monthly cashflow
- —
- DSCR
- —
- Eligible?
- —
No personal income docs; deal must DSCR.
Hard money
10% down · 12.0% · 12mo
- Down + closing
- —
- Monthly P&I
- —
- Monthly cashflow
- —
- DSCR
- —
- Eligible?
- —
Short-term bridge; refi at stabilization.
Listing history 22 events
-
2026-06-19days on market $165,000 Active 62 DOM
-
2026-06-18days on market $165,000 Active 61 DOM
-
2026-06-17days on market $165,000 Active 60 DOM
-
2026-06-16days on market $165,000 Active 59 DOM
-
2026-06-15days on market $165,000 Active 58 DOM
-
2026-06-14days on market $165,000 Active 56 DOM
-
2026-06-12days on market $165,000 Active 55 DOM
-
2026-06-09days on market $165,000 Active 52 DOM
-
2026-06-08days on market $165,000 Active 51 DOM
-
2026-06-07days on market $165,000 Active 50 DOM
-
2026-06-07days on market $165,000 Active 49 DOM
-
2026-06-04days on market $165,000 Active 46 DOM
-
2026-06-02days on market $165,000 Active 45 DOM
-
2026-06-01days on market $165,000 Active 44 DOM
-
2026-05-31days on market $165,000 Active 43 DOM
-
2026-05-31days on market $165,000 Active 42 DOM
-
2026-04-18$165,000 Active
-
2026-04-01historical
-
2026-04-01historical
-
2025-11-03$170,000 Active
-
2025-09-29price $170,000
-
2025-09-24$180,000 Active
ⓘ Source: listings_history table (triggers on properties + properties_extension) + one-shot
backfill from property_details.listing_events for pre-trigger history.
Climate risk First Street
- Flood 4/10 Moderate FEMA zone AE · 23% chance over 30 yrs
- Wildfire 7/10 Severe
- Heat 8/10 Severe 7 d/yr ≥109°F today · 19 d/yr by 30 yrs out
- Wind 1/10 Low
- Air quality 2/10 Low 1 unhealthy d/yr today · 1 by 30 yrs out
Nearby sold comps map
Loading sold comps map…
Walkable amenities ~0.75 mi
Loading nearby amenities…
Taxation est. · year 1
- Rental income
- $24,606
- − Mortgage interest
- −$9,243
- − Property taxes
- −$2,475
- − Insurance
- −$5,944
- − Repairs & maintenance
- −$1,968
- − Management
- −$1,968
- − Depreciation
- −$4,800
- Taxable loss
- −$1,792
- Est. tax savings @ 24.0%
- +$430
- After-tax cash flow
- $1,067/yr
For passive investors: Depreciation is non-cash, so a rental often shows a tax loss while cash-flowing — sheltering income. Rental losses are passive: they offset passive income freely, and up to $25,000/yr can offset ordinary (W-2) income if you actively participate and your MAGI is under $100k (phasing out to $0 by $150k); unused losses carry forward. On sale, claimed depreciation is recaptured at up to 25%, and gains may owe capital-gains tax (a 1031 exchange can defer both). Figures are a year-1 estimate at your 24.0% rate — not tax advice; consult a CPA.
Condition & rehab AI · 13 photos
This new build mobile home is in excellent condition with no visible repairs needed. It offers a great value with its new construction and potential for further updates to enhance its curb appeal and rental value.
Value-add opportunities
- Both Landscaping — Enhances curb appeal and adds value
- Both Painting — Fresh paint can make the home more appealing
- Both Landscaping — Enhances curb appeal and adds value
Renovation cost estimate screening
Value-add ROI direction
- Both Landscaping — Enhances curb appeal and adds value ↑
- Both Painting — Fresh paint can make the home more appealing ↑
- Both Landscaping — Enhances curb appeal and adds value ↑
ⓘ Cost ranges are severity-bucket heuristics (US national rule-of-thumb). Get contractor quotes + a written scope before underwriting a rehab budget.
Schools (NCES district)
- District
- Canon Elementary District (4484)
- NCES district ID
- 0401650
- Math proficiency
- 25% ▲ 5.00%
- Reading proficiency
- 35% ▬ 0.00%
- Median HH income
- $37,755
- Composite
- 27.85/100
- National rank
- #12286
- State rank
- #294 of 501 in AZ
Livability — Black Canyon City
- Score
- 58/100
- State rank
- #213
- US rank
- #21226
Category grades
Schools grade is shown separately in the Schools card above.
Census & demographics
- Census place
- Black Canyon City, AZ
- Population (ZIP)
- 2,297
Population outlook (Yavapai County) Hauer SSP2
- Today (2025)
- 241,389 people
- By 2030
- 249,523 · +3.4%
- By 2040
- 259,966 · +7.7%
- By 2050
- 264,736 · +9.7%
- By 2075
- 269,334 · +11.6%
- By 2100
- 256,505 · +6.3%
Race, ethnicity, and origin ACS 2023
- Neighborhood character
- Predominantly White (91%)
- Race & ethnicity
- White 91% Two or more races 7% Hispanic / Latino 3%
- Common ancestry
- Iranian 5% Serbian 3% Lithuanian 2%
- Foreign-born
- 1% · Canada
Political lean MEDSL · Yavapai
- 2024 margin
- Solid R (+33.9) · D 32.6% · R 66.5%
- 2008→2024 swing
- -9.5pp toward R · 2008: -24.4pp · 2024: -33.9pp
- All cycles
- 2024: R+33.9 2020: R+29.3 2016: R+31.4 2012: R+30.7 2008: R+24.4
Not yet ingested
- Civics
- —
Market trends
- HPI YoY
- ▲ 29.16%
- Current HPI
- 417.6032
- Rent YoY
- —
- Metro
- —
- State GDP YoY
- ▲ 4.54%
- F500 in state
- 20
Industry mix (Fortune 500 HQ in AZ)
| Industry | F500 HQs | Revenue |
|---|---|---|
| Technology | 2 | $13B |
|
||
| Mining / Metals | 1 | $23B |
|
||
| Environmental Services | 1 | $16B |
|
||
| Metals / Steel | 1 | $14B |
|
||
| Technology Distribution | 1 | $9B |
|
||
| Homebuilding | 1 | $8B |
|
||
Price history
-8.3% since first listed6 events — show timeline
- 2026-04-18 Listed $165,000 ARMLS
- 2026-04-01 Listing Removed — PAARMLS as Distributed by MLS Grid
- 2026-04-01 Listing Removed — ARMLS
- 2025-11-03 Listed $170,000 PAARMLS as Distributed by MLS Grid
- 2025-09-29 Price Changed $170,000 ARMLS
- 2025-09-24 Listed $180,000 ARMLS
Cash-flow waterfall
monthlySold comps — $/sqft
last 12 mo · ≤1 miLoading sold comps…