 🏷️ Likely Rental
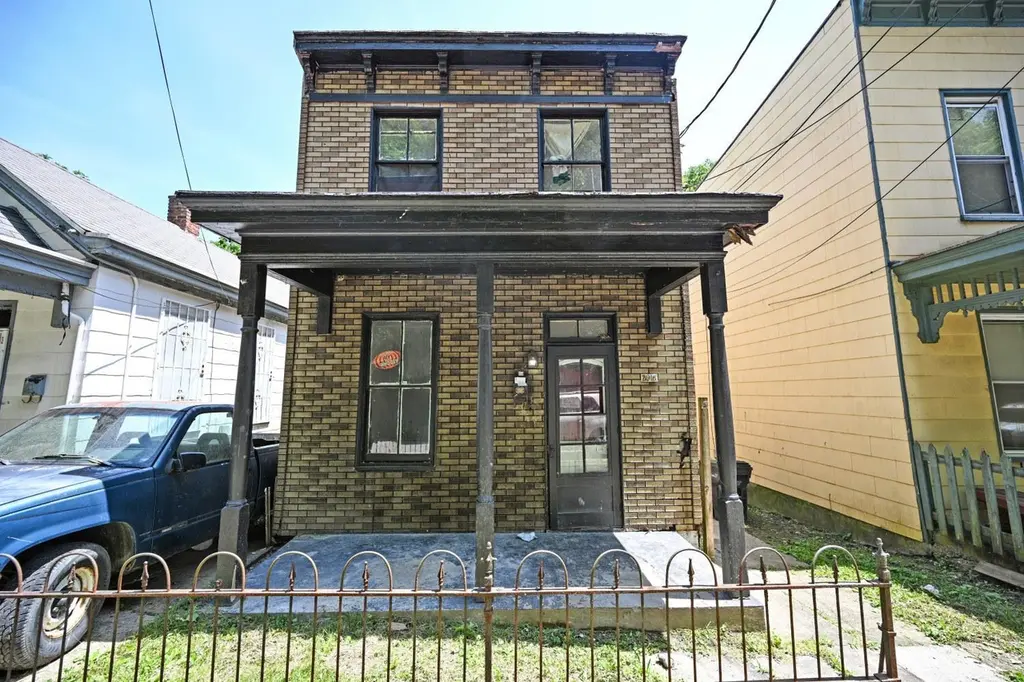
3918 Tappan Ave · Cincinnati, OH
Flood risk 1/10 · Minimal
- FEMA flood zone
- X (unshaded)
- Chance of flooding over 30 yrs
- 0.0%
- Est. flood insurance / yr
- $507 – $1,088
Fire risk 1/10 · Minimal
- Est. fire insurance / yr
- $713 – $1,323
Heat risk 4/10 · Minor
- Hot days now (above 103°F)
- 7 days/yr
- Hot days in 30 yrs
- 19 days/yr
Wind risk 2/10 · Minimal
- Chance of severe wind over 30 yrs
- 1.0%
Air-quality risk 2/10 · Minimal
- Unhealthy air days now
- 1 days/yr
- Unhealthy air days in 30 yrs
- 1 days/yr
Risk factors via First Street. Map © Google.
Why this score? — see what drove the B grade
The composite is a weighted blend of 9 inputs, each scored 0–100. Each bar is that input's sub-score; the figure is the points it added to the 100-point composite (weight × sub-score).
- Cash flow +30.0/30.0
- 1% rule +10.0/10.0
- DSCR +10.0/10.0
- ARV discount +7.5/15.0
- Rent growth +5.0/5.0
- Livability +4.0/5.0
- Schools +2.5/10.0
- Condition / age +2.5/5.0
- Appreciation +0.0/10.0
$89,000
🖨 Deal sheet 📄 Offer letter ✓ Due diligence
Listing remarks MLS
Don't miss out on this great opportunity! Previously a rental, this home is now ready for a new owner occupant or investor looking to add a solid rental to their portfolio! Previously rented for $1300/mo! Bonus room on second floor that could easily be used as a third bedroom! Schedule a showing today!
Key facts
- Employment centers
- Downtown cincinnati
- Shopping
Tags
Property features AI
Finance
- HOA & community: No HOA
Exterior
- Utilities: Public water; Public sewer; Natural gas; Gas water heater
- Home design: Traditional single-family home; Two levels; Stone foundation
- Construction: Brick construction
- Exterior features: Shingle roof; Vinyl and wood windows
Interior
- Kitchen: Wood cabinets
- Bedrooms: Two bedrooms total; Primary bedroom about 12 x 12 (on first level); Second bedroom about 12 x 15 (on second level)
- Bathrooms: One full bathroom on the first level; One half bathroom on the second level
- Heating & cooling: Forced-air heating; Gas heating
- Interior features: Five total rooms; Partial basement
Neighborhood map
What this means for you Summary
Snapshot
- This is a 2-bed/2.0-bath single-family listed at $89k.
Deal economics
- At list price, monthly cash flow is $572 ($7k/yr) — positive.
- The deal already cash-flows at list — no discount required.
- Meets the 1% rule at list price ($1k rent vs $89k).
- Recommended offer: $88k (1.5% below list) — sets the bar for market timing.
- Cap rate 14.0% vs local median 3.9% in Cincinnati — top-decile yield for the area; either an underpriced asset or a hidden risk that comps aren't pricing in. Stress-test before assuming the spread holds.
Location & tenants
- Location reads 80/100 on livability (#130 in OH, #1,856 nationally) — a professional / high-income tenant draw. Strengths: amenities A+, commute A+, cost of living A+; Watch: employment D, crime F.
- Cincinnati Public Schools (urban): math 25% / reading 36% proficiency, ranked #581 of 656 in OH (top 89%) — families likely to look elsewhere, expect single-tenant / working-renter base with shorter leases; 70% free/reduced lunch — lower-income household profile, screen leases tightly.
- Market conditions: Rents rising fast (+16.7%/yr); 46 active listings in the ZIP; 18 comparable units currently listed for rent nearby; rentals at typical pace (median 15d on market — plan ~3-4 weeks tenant-placement turnaround); 801 units permitted in Hamilton County in 2024 (190 in 5+ unit buildings).
- This rent runs 36% of the median local income ($49k/yr) — at the standard rent-burdened threshold; future hikes will face affordability resistance.
Forward outlook
- Local home prices are declining (-3.0%/yr); year-one equity from $615 of loan paydown is wiped out by about $3k of value loss. Plan a longer hold.
- At projected returns (-3.0% appreciation + 8.0% rent growth), your $25k cash investment doubles in ~4 years — after that, you're playing with house money.
Negotiation context
- It's been on market 17 days — a 2% lower offer ($88k) is reasonable based on typical stale-listing flexibility.
- 2 sale attempts with the ask held roughly flat each time — persistent listings suggest the price (not the market) is what's stuck; bring a comps-based counter.
- Current owner paid $48k; list at $89k implies a 85% gain — meaningful room to come down on a strong offer.
Risks & watch-outs
- Watch-outs: built in 1893 — expect roof / HVAC / electrical / plumbing capex.
Questions for the listing agent
- Built in 1893 — when were the roof, HVAC, electrical panel, plumbing, and water heater last replaced?
- Is there a deadline driving the sale (1031 exchange, divorce, estate, relocation)? That informs how much negotiation room exists.
- Schools are B-rated — typically a magnet for longer-tenancy family renters. What's the average tenant stay here, and is there a school-zone premium baked into asking?
- Crime grade is F in this area — have there been break-ins, vandalism, or insurance claims at this property in the last 3 years? What carrier currently insures it and at what premium?
- What's the average days-on-market for RENTAL listings here right now (not sales)? A rising rental-DOM trend means longer vacancies and softer asking-rent achievability than the comps imply.
- What's the recent tenant-quality profile in this submarket — average credit score on applications, eviction rate, late-payment / NSF rate, and stable-employment percentage? A property-management company in the area should have these aggregated.
- How much new for-sale + rental construction is in the pipeline within 1–3 miles? Heavy new supply typically softens prices + rents 12–24 months out; constrained supply supports both.
Investment metrics
- 1% rule
- 1.66% ✓
- Cap rate
- 14.01%
- Cash-on-cash
- 27.56%
- DSCR
- 2.23
- GRM
- 5.0
CMA / ARV
- ARV (on-the-fly)
- $263,630
- Comps found
- 12
Show comp detail 12 sales within ~0.75 mi
| Address | Dist | Beds/Ba | Sqft | Sold | Price | $/sf | Match |
|---|---|---|---|---|---|---|---|
| 3742 Beekman St | 0.33mi | 3/1.0 (+1) | 1,244 (-3%) | 2mo | $68,000 | $55 | 68 |
| 1949 Washburn St | 0.62mi | 2/1.5 | 1,292 (+0%) | 2mo | $271,500 | $210 | 66 |
| 1787 Townsend St | 0.37mi | 3/1.0 (+1) | 1,333 (+4%) | 5mo | $45,525 | $34 | 64 |
| 1747 Jester St | 0.56mi | 2/1.5 | 1,256 (-2%) | 5mo | $257,300 | $205 | 64 |
| 4135 Lakeman St | 0.60mi | 2/1.5 | 1,344 (+4%) | 2mo | $299,000 | $222 | 60 |
| 4212 Colerain Ave | 0.43mi | 2/1.0 | 1,156 (-10%) | 5mo | $182,000 | $157 | 54 |
| 1917 Webman Ct | 0.52mi | 3/1.5 (+1) | 1,392 (+8%) | 4mo | $118,000 | $85 | 52 |
| 4128 Lakeman St | 0.61mi | 3/2.5 (+1) | 1,357 (+6%) | 7mo | $368,000 | $271 | 49 |
| 1754 Jester St | 0.57mi | 3/2.0 (+1) | 1,391 (+8%) | 7mo | $220,000 | $158 | 49 |
| 3910 Cherry St | 0.64mi | 3/2.5 (+1) | 1,456 (+13%) | 3mo | $336,000 | $231 | 39 |
| 4222 Georgia Ave | 0.60mi | 3/1.0 (+1) | 1,462 (+14%) | 2mo | $217,500 | $149 | 38 |
| 4249 Kirby Ave | 0.68mi | 2/1.0 | 1,114 (-13%) | 8mo | $235,000 | $211 | 35 |
Match score weights: distance 35% · size 25% · config 20% · recency 20%. Top-matched comps best support the ARV.
Projected returns pro-forma
-3.0% appreciation · 8.0% rent growth · sell at horizon
- IRR
- 27.1%
- Equity multiple
- 2.20×
- Total profit
- $29,839
- Equity at exit
- $13,270
- IRR
- 37.5%
- Equity multiple
- 5.35×
- Total profit
- $108,461
- Equity at exit
- $7,695
Cash invested: $24,920 (down + closing). Projections, not guarantees.
Landlord ↔ Tenant lean methodology
- Overall (STATE)
- 73 Landlord-Friendly
- State Ohio
- 73 Landlord-Friendly · R+6
- County
- — inherits STATE
- City
- — inherits STATE
ZIP-level market 45223
- Rents YoY
- 16.7%
- Active inventory
- 46
- Price-to-rent
- 5.0×
Monthly cashflow live
- Estimated rent
- $1,476 high interval (Pro) →
- Mortgage (P&I)
- −$467
- Tax from tax record
- −$90 /mo · $1,079/yr
- Insurance
- −$37
- HOA
- −$0
- Vacancy / Maint / Mgmt
- −$310
- Net cashflow
- $572
Break-even live
UW: 25.0% down · 7.5% · 30yr · 1.5% tax · 5.0% vac · 8.0% maint · 8.0% mgmt
Financing live
Cash to close
- Down payment
- $22,250
- Closing costs
- $2,670
- Reserves months
- —
- Total cash needed
- —
Loan-product check · same deal, 3 products live
Conventional
25% down · 7.5% · 30yr
- Down + closing
- —
- Monthly P&I
- —
- Monthly cashflow
- —
- DSCR
- —
- Eligible?
- —
Personal DTI + credit; lowest rate.
DSCR
20% down · 8.5% · 30yr
- Down + closing
- —
- Monthly P&I
- —
- Monthly cashflow
- —
- DSCR
- —
- Eligible?
- —
No personal income docs; deal must DSCR.
Hard money
10% down · 12.0% · 12mo
- Down + closing
- —
- Monthly P&I
- —
- Monthly cashflow
- —
- DSCR
- —
- Eligible?
- —
Short-term bridge; refi at stabilization.
Rent comps 18 comps
| Address | Beds | Baths | Sqft | Rent | $/sqft | DOM | Units | Dist |
|---|---|---|---|---|---|---|---|---|
| 1905 Elmore St Cincinnati, OH | 3.0 | 1.0 | 925 | $1,320 | $1.43 | 13d | 3 | 0.28mi |
| 4046 Colerain Ave Unit 1 Cincinnati, OH | 1.0 | 1.0 | 900 | $1,400 | $1.56 | 3d | 1 | 0.55mi |
| 4489 Ammon Ave Cincinnati, OH | 3.0 | 2.0 | 1300 | $1,795 | $1.38 | 3d | 1 | 0.59mi |
| 4123 Lakeman St Cincinnati, OH | 3.0 | 1.5 | 1541 | $1,950 | $1.27 | 14d | 1 | 0.61mi |
| 4125 Apple St Cincinnati, OH | 2.0 | 1.5 | 1150 | $1,795 | $1.56 | 23d | 1 | 0.78mi |
| 3570 McHenry Ave Unit 3574-3 Cincinnati, OH | 2.0 | 1.0 | 900 | $1,000 | $1.11 | 23d | 1 | 0.79mi |
| 1710 Bruce Ave Cincinnati, OH | 2.0 | 1.0 | 974 | $1,495 | $1.53 | 23d | 1 | 0.83mi |
| 1580 Blue Rock St Cincinnati, OH | 2.0 | 1.0–2.0 | 730 | $1,970 | $2.70 | 1d | 5 | 0.88mi |
| 4101 Spring Grove Ave Cincinnati, OH | 2.0 | 1.0–2.0 | 2586 | $2,130 | $0.82 | 1d | 8 | 0.97mi |
| 2230 Westwood Northern Blvd Cincinnati, OH | 1.0–2.0 | 1.0–2.0 | 792 | $940 | $1.19 | 23d | 3 | 0.99mi |
| 3401 McHenry Ave Unit 43 Cincinnati, OH | 2.0 | 1.0 | 1000 | $1,250 | $1.25 | 23d | 1 | 1.04mi |
| 4264 Williamson Pl Unit 2 Cincinnati, OH | 2.0 | 1.0 | 1650 | $1,700 | $1.03 | 4d | 1 | 1.10mi |
| 1438 Pullan Ave Unit 2 Cincinnati, OH | 3.0 | 1.0 | 1200 | $1,500 | $1.25 | 14d | 1 | 1.17mi |
| 4652 Ashtree Dr Cincinnati, OH | 3.0 | 1.0 | 925 | $1,350 | $1.46 | 21d | 1 | 1.28mi |
| 1759 Monterey Ct Cincinnati, OH | 3.0 | 1.0 | 920 | $1,750 | $1.90 | 4d | 1 | 1.31mi |
| 3301 Colerain Ave Cincinnati, OH | 1.0 | 1.0 | 1021 | $1,491 | $1.46 | 4d | 9 | 1.32mi |
| 3064 Aquadale Ln Cincinnati, OH | 3.0 | 3.0 | 1102 | $1,850 | $1.68 | 23d | 1 | 1.47mi |
| 3272 Gobel Ave Unit 2465-2 Cincinnati, OH | 2.0 | 1.0 | 900 | $900 | $1.00 | 23d | 1 | 1.50mi |
Listing history 12 events
-
2026-06-18days on market $89,000 Active 17 DOM
-
2026-06-17days on market $89,000 Active 16 DOM
-
2026-06-16days on market $89,000 Active 15 DOM
-
2026-06-15days on market $89,000 Active 14 DOM
-
2026-06-13days on market $89,000 Active 12 DOM
-
2026-06-13days on market $89,000 Active 11 DOM
-
2026-06-09days on market $89,000 Active 8 DOM
-
2026-06-08days on market $89,000 Active 7 DOM
-
2026-06-07days on market $89,000 Active 6 DOM
-
2026-06-03days on market $89,000 Active 2 DOM
-
2026-06-02remarks 699-char remark
-
2026-06-02$89,000 Active 1 DOM
ⓘ Source: listings_history table (triggers on properties + properties_extension) + one-shot
backfill from property_details.listing_events for pre-trigger history.
Tax reassessment forecast OH · Partial reset (capped growth)
- Current annual tax
- $1,079 · $90/mo
- Projected year-2 tax
- $1,234 · $103/mo
- Expected delta
- +$154/yr (+$13/mo · 14.3%)
ⓘ Screening estimate from a state-policy table — verify with the county assessor before closing.
Climate risk First Street
- Flood 1/10 Low FEMA zone X (unshaded) · 0% chance over 30 yrs
- Wildfire 1/10 Low
- Heat 4/10 Moderate 7 d/yr ≥103°F today · 19 d/yr by 30 yrs out
- Wind 2/10 Low 100% chance of damaging wind over 30 yrs
- Air quality 2/10 Low 1 unhealthy d/yr today · 1 by 30 yrs out
Nearby sold comps map
Loading sold comps map…
Walkable amenities ~0.75 mi
Loading nearby amenities…
Taxation est. · year 1
- Rental income
- $17,713
- − Mortgage interest
- −$4,985
- − Property taxes
- −$1,079
- − Insurance
- −$445
- − Repairs & maintenance
- −$1,417
- − Management
- −$1,417
- − Depreciation
- −$2,589
- Taxable income
- $5,780
- Est. tax owed @ 24.0%
- −$1,387
- After-tax cash flow
- $5,481/yr
For passive investors: Depreciation is non-cash, so a rental often shows a tax loss while cash-flowing — sheltering income. Rental losses are passive: they offset passive income freely, and up to $25,000/yr can offset ordinary (W-2) income if you actively participate and your MAGI is under $100k (phasing out to $0 by $150k); unused losses carry forward. On sale, claimed depreciation is recaptured at up to 25%, and gains may owe capital-gains tax (a 1031 exchange can defer both). Figures are a year-1 estimate at your 24.0% rate — not tax advice; consult a CPA.
Schools (NCES district)
- District
- Cincinnati Public Schools
- NCES district ID
- 3904375
- Math proficiency
- 25% ▼ -19.00%
- Reading proficiency
- 36% ▼ -14.00%
- Median HH income
- $35,743
- Composite
- 25.21/100
- National rank
- #7508
- State rank
- #581 of 656 in OH
Livability — Cincinnati
- Score
- 80/100
- State rank
- #130
- US rank
- #1856
Category grades
Schools grade is shown separately in the Schools card above.
Census & demographics
- Census place
- Cincinnati, OH
- County
- Hamilton County · 701,295 people
- City population
- 505,555
- Metro
- Cincinnati, OH-KY-IN
- Population (ZIP)
- 14,182
- Household income
- $49,312
- Rent vs Own
- Severe rent burden
- 943.0
Population outlook (Hamilton County) Hauer SSP2
- Today (2025)
- 826,054 people
- By 2030
- 830,947 · +0.6%
- By 2040
- 832,319 · +0.8%
- By 2050
- 822,428 · -0.4%
- By 2075
- 788,688 · -4.5%
- By 2100
- 710,674 · -14.0%
Race, ethnicity, and origin ACS 2023
- Neighborhood character
- Diverse neighborhood (Simpson 0.61)
- Race & ethnicity
- White 53% Black 33% Two or more races 11% Hispanic / Latino 6% Asian 1%
- Hispanic origin (detail)
- Common ancestry
- Slovak 3% Romanian 2% Italian 1%
- Foreign-born
- 6% · Canada, Guatemala
- Languages at home
- 93% English-only · Spanish 4% German/W. Germanic 1%
Political lean MEDSL · Hamilton
- 2024 margin
- D (+14.9) · D 57.0% · R 42.1%
- 2008→2024 swing
- +7.9pp toward D · 2008: 7.0pp · 2024: 14.9pp
- All cycles
- 2024: D+14.9 2020: D+15.9 2016: D+9.5 2012: D+4.9 2008: D+7.0
Not yet ingested
- Civics
- —
Market trends
- HPI YoY
- ▼ -171.27%
- Current HPI
- 239.5488
- Rent YoY
- ▲ 16.66%
- Metro
- Cincinnati, OH-KY-IN
- State GDP YoY
- ▲ 1.98%
- F500 in state
- 48
Industry mix (Fortune 500 HQ in OH)
| Industry | F500 HQs | Revenue |
|---|---|---|
| Insurance | 3 | $145B |
|
||
| Industrial Machinery | 3 | $49B |
|
||
| Financial Services | 3 | $24B |
|
||
| Consumer Goods | 2 | $93B |
|
||
| Aerospace / Defense | 2 | $47B |
|
||
| Utilities | 2 | $33B |
|
||
Price history
+223.6% since first listed8 events — show timeline
- 2026-06-01 Listed $89,000 Cincy MLS
- 2025-05-29 Listing Removed — Cincy MLS
- 2025-05-01 Price Changed $94,500 Cincy MLS
- 2025-04-14 Price Changed $99,900 Cincy MLS
- 2025-02-19 Listed $109,900 Cincy MLS
- 2022-11-10 Sold (Public Records) $48,000 Public Records
- 2012-06-21 Sold (Public Records) $20,000 Public Records
- 1997-01-30 Sold (Public Records) $27,500 Public Records
Property tax history
+8.0%/yrLatest (2025): $1,079 · +0.1% YoY. Source: county tax records.
Cash-flow waterfall
monthlySold comps — $/sqft
last 12 mo · ≤1 miLoading sold comps…