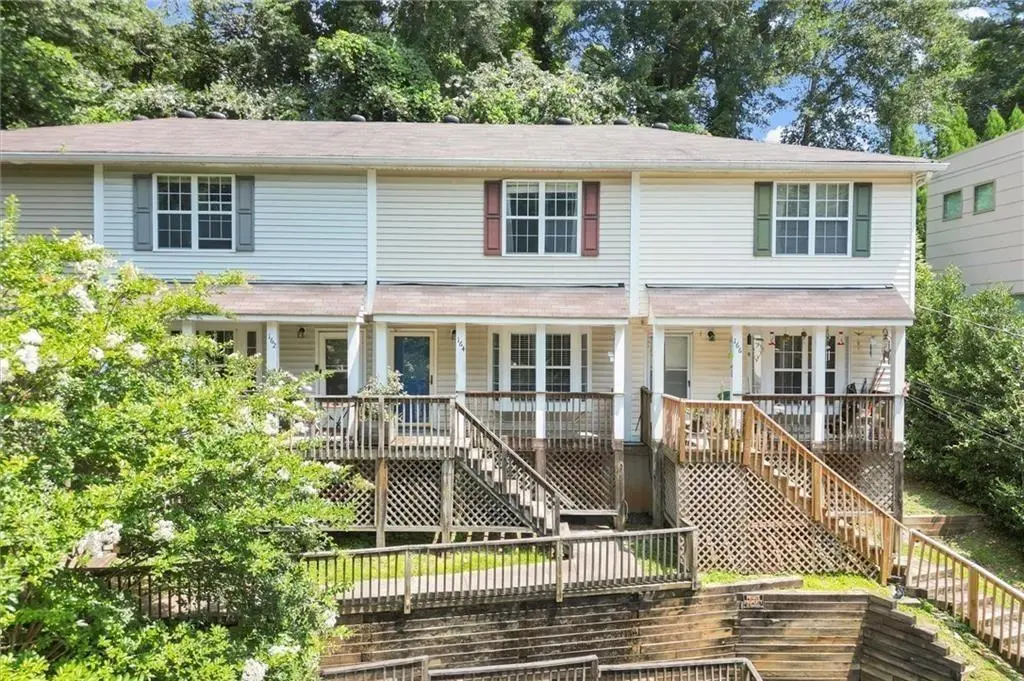
164 Oxbo Rd · Roswell, GA
Flood risk 7/10 · Major
- FEMA flood zone
- X (unshaded)
- Chance of flooding over 30 yrs
- 0.78%
- Est. flood insurance / yr
- $507 – $1,088
Fire risk 1/10 · Minimal
- Est. fire insurance / yr
- $963 – $1,789
Heat risk 5/10 · Moderate
- Hot days now (above 102°F)
- 7 days/yr
- Hot days in 30 yrs
- 18 days/yr
Wind risk 4/10 · Minor
- Chance of severe wind over 30 yrs
- 19.0%
Air-quality risk 5/10 · Moderate
- Unhealthy air days now
- 7 days/yr
- Unhealthy air days in 30 yrs
- 8 days/yr
Risk factors via First Street. Map © Google.
Why this score? — see what drove the D+ grade
The composite is a weighted blend of 9 inputs, each scored 0–100. Each bar is that input's sub-score; the figure is the points it added to the 100-point composite (weight × sub-score).
- Cash flow +12.8/30.0
- ARV discount +10.0/15.0
- Schools +4.5/10.0
- Livability +4.0/5.0
- 1% rule +3.9/10.0
- DSCR +3.8/10.0
- Rent growth +3.7/5.0
- Condition / age +2.5/5.0
- Appreciation +0.0/10.0
$275,000
🖨 Deal sheet (PDF) 📄 Offer letter ✓ Due diligence
Listing remarks
Perfectly positioned across from Big Creek and the Oxbo Trail, this inviting townhome offers an unbeatable combination of natural beauty and walkable convenience just minutes from Downtown Roswell and Canton Street. Enjoy easy access to some of Roswell’s best restaurants, boutique shopping, coffee houses, art galleries, and year-round community events. The location also places you just minutes from the highly anticipated Hillrose mixed-use development, bringing even more dining, retail, and gathering spaces to the area. Inside, the light-filled open floor plan is designed for comfortable everyday living and easy entertaining. The main level features a spacious living area, open dining
Key facts
- $275 HOA
- 2 parking spots
- Built 2003
Neighborhood map
What this means for you Summary
Snapshot
- This is a 3-bed/2.0-bath townhouse listed at $275k.
Deal economics
- At list price, monthly cash flow is $-90 ($-1k/yr) — negative.
- To cash-flow at today's rent, offer at most $259k (5.8% below list).
- To meet the 1% rule (rent ≥ 1% of price), the offer needs to be $245k (11.0% below list).
- Recommended offer: $245k (11.0% below list) — sets the bar for 1% rule.
- Cap rate 6.2% vs local median 2.6% in Roswell — top-decile yield for the area; either an underpriced asset or a hidden risk that comps aren't pricing in. Stress-test before assuming the spread holds.
Location & tenants
- Location reads 79/100 on livability (#12 in GA, #1,990 nationally) — a middle-class / working-renter tenant base. Strengths: employment A+, housing A+, crime A; Watch: commute F, cost of living F.
- Fulton County (suburban): math 49% / reading 53% proficiency, ranked #12 of 174 in GA (top 7%) — acceptable for families but not a draw, mixed tenant base, ~2y average lease.
- Zoned schools: Vickery Mill Elementary (math 27% / reading 27%, grade F, #689 of 1,228 statewide, top 58%, 438 students, 74% FRL); Crabapple Middle School (math 54% / reading 73%, grade B+, #31 of 470 statewide, top 6%, 871 students, 13% FRL); Roswell High School (math 54%, 2,119 students, 23% FRL) — zoned schools at 37% FRL track the district average.
- Market conditions: Rents rising fast (+4.7%/yr); 391 active listings in the ZIP; 28 comparable units currently listed for rent nearby; rentals at typical pace (median 22d on market — plan ~3-4 weeks tenant-placement turnaround); high-income renter base; 11,565 units permitted in Fulton County in 2024 (8,159 in 5+ unit buildings).
Forward outlook
- Local home prices are declining (-3.0%/yr); year-one equity from $2k of loan paydown is wiped out by about $8k of value loss. Plan a longer hold.
- Fulton County population projected at +38% by 2050 — long-run rental-demand tailwind backs the buy-and-hold thesis.
Negotiation context
- It's been on market 17 days — a 2% lower offer ($271k) is reasonable based on typical stale-listing flexibility.
- 5 sale attempts since 9y ago with the ask held roughly flat each time — persistent listings suggest the price (not the market) is what's stuck; bring a comps-based counter.
- Current owner paid $169k; list at $275k implies a 63% gain — meaningful room to come down on a strong offer.
Risks & watch-outs
- Watch-outs: flood insurance adds $66/mo.
- Climate carrying-cost: major flood risk; extreme-heat days projected 7→18/yr by 2055 (HVAC capex compounding) — expect insurance premiums to compound above CPI over the hold.
Questions for the listing agent
- What do current leases actually rent for vs. the listed asking? Can we see a recent rent roll and the last 12 months of T-12 income?
- What's the actual annual flood-insurance premium (NFIP or private), and is the property in a SFHA with mandatory coverage?
- What does the HOA fee cover, when was the last increase, and are there any pending special assessments or reserve-fund shortfalls?
- Is there a deadline driving the sale (1031 exchange, divorce, estate, relocation)? That informs how much negotiation room exists.
- Schools are B-rated — typically a magnet for longer-tenancy family renters. What's the average tenant stay here, and is there a school-zone premium baked into asking?
- The area grade is low — what's the realistic commute time and amenity access for the typical tenant pool here? Any planned neighborhood developments (good or bad) we should know about?
- What's the average days-on-market for RENTAL listings here right now (not sales)? A rising rental-DOM trend means longer vacancies and softer asking-rent achievability than the comps imply.
- What's the recent tenant-quality profile in this submarket — average credit score on applications, eviction rate, late-payment / NSF rate, and stable-employment percentage? A property-management company in the area should have these aggregated.
- How much new for-sale + rental construction is in the pipeline within 1–3 miles? Heavy new supply typically softens prices + rents 12–24 months out; constrained supply supports both.
Investment metrics
- 1% rule
- 0.89% ✗
- Cap rate
- 6.19%
- Cash-on-cash
- -0.37%
- DSCR
- 0.98
- GRM
- 9.4
CMA / ARV
- ARV (on-the-fly)
- $290,928
- Comps found
- 12
Show comp detail 12 sales within ~0.75 mi
| Address | Dist | Beds/Ba | Sqft | Sold | Price | $/sf | Match |
|---|---|---|---|---|---|---|---|
| 512 Creek View Ln | 0.41mi | 2/2.0 (-1) | 1,293 (+3%) | 8mo | $520,000 | $402 | 64 |
| 812 Creek View Ln | 0.44mi | 2/2.0 (-1) | 1,293 (+3%) | 8mo | $489,000 | $378 | 62 |
| 810 River Mill Cir | 0.70mi | 2/2.0 (-1) | 1,306 (+4%) | 1mo | $295,000 | $226 | 55 |
| 405 River Mill Cir | 0.70mi | 2/2.0 (-1) | 1,306 (+4%) | 2mo | $290,000 | $222 | 54 |
| 710 Creek View Ln #701 | 0.43mi | 2/2.0 (-1) | 1,293 (+3%) | 23mo | $467,000 | $361 | 51 |
| 812 River Mill Cir | 0.70mi | 2/2.0 (-1) | 1,306 (+4%) | 9mo | $325,000 | $249 | 48 |
| 801 River Mill Cir | 0.70mi | 2/2.0 (-1) | 1,306 (+4%) | 13mo | $269,000 | $206 | 45 |
| 803 River Mill Cir | 0.70mi | 2/2.0 (-1) | 1,306 (+4%) | 23mo | $280,000 | $214 | 36 |
| 211 River Mill Cir | 0.70mi | 2/2.0 (-1) | 1,158 (-8%) | 22mo | $263,000 | $227 | 31 |
| 703 Roswell Landing Dr #703 | 0.62mi | 3/2.5 | 1,398 (+12%) | 23mo | $325,000 | $232 | 31 |
| 703 Roswell Landings Dr | 0.62mi | 3/2.5 | 1,398 (+12%) | 23mo | $325,000 | $232 | 31 |
| 206 River Mill Cir | 0.70mi | 2/2.0 (-1) | 1,158 (-8%) | 23mo | $255,000 | $220 | 31 |
Match score weights: distance 35% · size 25% · config 20% · recency 20%. Top-matched comps best support the ARV.
Projected returns pro-forma
-3.0% appreciation · 4.72% rent growth · sell at horizon
- IRR
- -16.5%
- Equity multiple
- 0.40×
- Total profit
- $-45,888
- Equity at exit
- $41,003
- IRR
- -5.3%
- Equity multiple
- 0.63×
- Total profit
- $-28,590
- Equity at exit
- $23,777
Cash invested: $77,000 (down + closing). Projections, not guarantees.
Landlord ↔ Tenant lean methodology
- Overall (STATE)
- 90 Strongly Landlord-Friendly
- State Georgia
- 90 Strongly Landlord-Friendly · R+3
- County
- — inherits STATE
- City
- — inherits STATE
ZIP-level market 30075
- Rents YoY
- 4.7%
- Active inventory
- 391
- Price-to-rent
- 9.4×
Monthly cashflow live
- Estimated rent
- $2,447 high interval (Pro) →
- Mortgage (P&I)
- −$1,442
- Tax from tax record
- −$126 /mo · $1,506/yr
- Insurance
- −$115
- Flood insurance flood zone
- −$66 /mo · $798/yr
- HOA
- −$275
- Vacancy / Maint / Mgmt
- −$514
- Net cashflow
- $-90
Break-even live
Sensitivity live
| Price | -10% $65 | -5% $-12 | +0% $-90 | +5% $-168 | +10% $-246 |
|---|---|---|---|---|---|
| Rent | -10% $-284 | -5% $-187 | +0% $-90 | +5% $6 | +10% $103 |
| Rate | -1.0pp $48 | -0.5pp $-20 | base $-90 | +0.5pp $-161 | +1.0pp $-234 |
UW: 25.0% down · 7.5% · 30yr · 1.5% tax · 5.0% vac · 8.0% maint · 8.0% mgmt
Financing live
Cash to close
- Down payment
- $68,750
- Closing costs
- $8,250
- Reserves months
- —
- Total cash needed
- —
Loan-product check · same deal, 3 products live
Conventional
25% down · 7.5% · 30yr
- Down + closing
- —
- Monthly P&I
- —
- Monthly cashflow
- —
- DSCR
- —
- Eligible?
- —
Personal DTI + credit; lowest rate.
DSCR
20% down · 8.5% · 30yr
- Down + closing
- —
- Monthly P&I
- —
- Monthly cashflow
- —
- DSCR
- —
- Eligible?
- —
No personal income docs; deal must DSCR.
Hard money
10% down · 12.0% · 12mo
- Down + closing
- —
- Monthly P&I
- —
- Monthly cashflow
- —
- DSCR
- —
- Eligible?
- —
Short-term bridge; refi at stabilization.
Rent comps 28 comps
| Address | Beds | Baths | Sqft | Rent | $/sqft | DOM | Units | Dist |
|---|---|---|---|---|---|---|---|---|
| 528 Barrington Dr Roswell, GA | 4.0 | 2.0 | 1469 | $3,100 | $2.11 | 7d | 1 | 0.56mi |
| 3000 Forrest Walk Roswell, GA | 1.0–2.0 | 1.0–2.0 | 1020 | $2,747 | $2.69 | 0d | 31 | 0.62mi |
| 1055 Alpharetta St Roswell, GA | 1.0–3.0 | 1.0–2.5 | 1209 | $4,985 | $4.12 | 0d | 14 | 0.64mi |
| 100 Chattahoochee Cir Roswell, GA | 2.0–3.0 | 2.0–2.5 | 1333 | $2,050 | $1.54 | 14d | 5 | 0.76mi |
| 129 Warm Springs Cir Roswell, GA | 2.0 | 1.0 | 1000 | $1,595 | $1.59 | 45d | 1 | 0.80mi |
| 529 Warm Springs Cir Roswell, GA | 2.0 | 2.0 | 1000 | $1,850 | $1.85 | 45d | 1 | 0.82mi |
| 60 Long Cir Roswell, GA | 2.0 | 1.0 | 1100 | $1,950 | $1.77 | 45d | 1 | 0.89mi |
| 1180 Canton St Roswell, GA | 2.0–3.0 | 2.0–2.5 | 1518 | $5,080 | $3.35 | 0d | 9 | 0.93mi |
| 180 Moonshadow Ct Roswell, GA | 3.0 | 2.0 | 1823 | $2,350 | $1.29 | 45d | 1 | 0.94mi |
| 1252 Minhinette Dr Unit 1252 Roswell, GA | 2.0 | 2.0 | 1371 | $2,250 | $1.64 | 20d | 1 | 1.04mi |
| 303 Canton Way Roswell, GA | 2.0 | 2.0 | 1625 | $3,250 | $2.00 | 45d | 1 | 1.05mi |
| 10160 N Coleman Rd Roswell, GA | 3.0 | 2.0 | 1373 | $3,000 | $2.18 | 20d | 1 | 1.07mi |
| 1500 Huntcliff Village Ct Atlanta, GA | 1.0–3.0 | 1.0–2.0 | 1030 | $2,447 | $2.38 | 3d | 25 | 1.30mi |
| 2907 Queen Anne Ct Atlanta, GA | 2.0 | 2.5 | 1160 | $2,000 | $1.72 | 7d | 1 | 1.33mi |
| 335 Winding River Dr Unit H Atlanta, GA | 2.0 | 2.0 | 1408 | $1,600 | $1.14 | 0d | 1 | 1.35mi |
| 335 Winding River Dr Unit H Atlanta, GA | 2.0 | 2.0 | 1408 | $1,600 | $1.14 | 45d | 1 | 1.35mi |
| 360 Winding River Dr Unit J Atlanta, GA | 3.0 | 2.5 | 1564 | $2,950 | $1.89 | 45d | 1 | 1.36mi |
| 1003 Wedgewood Way Atlanta, GA | 2.0 | 2.5 | 1160 | $2,000 | $1.72 | 45d | 1 | 1.36mi |
| 1306 Wedgewood Ct Atlanta, GA | 2.0 | 2.5 | 1088 | $2,200 | $2.02 | 7d | 1 | 1.36mi |
| 100 Hemingway Ln Roswell, GA | 1.0–3.0 | 1.0–2.5 | 1221 | $2,053 | $1.68 | 0d | 40 | 1.36mi |
| 330 Winding River Dr Unit C Atlanta, GA | 2.0 | 2.5 | 1392 | $2,150 | $1.54 | 45d | 1 | 1.40mi |
| 295 Winding River Dr Unit H Atlanta, GA | 3.0 | 2.0 | 1568 | $2,250 | $1.43 | 45d | 1 | 1.45mi |
| 1045 Holcomb Bridge Rd Roswell, GA | 1.0–3.0 | 1.0–2.0 | 1075 | $1,723 | $1.60 | 0d | 24 | 1.47mi |
| 275 Winding River Dr Unit C Atlanta, GA | 2.0 | 2.5 | 1408 | $2,100 | $1.49 | 7d | 1 | 1.48mi |
| 265 Winding River Dr Unit A Atlanta, GA | 2.0 | 1.5 | 1090 | $1,800 | $1.65 | 45d | 1 | 1.50mi |
| 9400 Roberts Dr Sandy Springs, GA | 1.0–2.0 | 1.0–2.0 | 1200 | $1,395 | $1.16 | 26d | 2 | 1.50mi |
| 9400 Roberts Dr Sandy Springs, GA | 1.0–2.0 | 1.0–2.0 | 1200 | $1,395 | $1.16 | 21d | 2 | 1.50mi |
| 9400 Roberts Dr Unit 3D Atlanta, GA | 2.0 | 2.0 | 1200 | $1,395 | $1.16 | 22d | 1 | 1.50mi |
HOA detail
- Monthly dues
- $275 · $3,300/yr
Listing history 30 events
-
2026-06-21days on market $275,000 Active 17 DOM
-
2026-06-18days on market $275,000 Active 14 DOM
-
2026-06-17days on market $275,000 Active 13 DOM
-
2026-06-16days on market $275,000 Active 12 DOM
-
2026-06-15days on market $275,000 Active 11 DOM
-
2026-06-13days on market $275,000 Active 9 DOM
-
2026-06-09days on market $275,000 Active 5 DOM
-
2026-06-08days on market $275,000 Active 4 DOM
-
2026-06-07days on market $275,000 Active 3 DOM
-
2026-06-04days on market $275,000 Active 1 DOM
-
2026-06-03days on market $275,000 Active 13 DOM
-
2026-06-01days on market $275,000 Active 11 DOM
-
2026-05-31days on market $275,000 Active 10 DOM
-
2026-03-13status Pending
-
2026-03-04$275,000 Active
-
2026-03-04historical
-
2025-10-15$285,000 New
-
2025-06-30historical
-
2025-03-07price $299,000
-
2025-02-15$335,000 Active
-
2018-04-02soldstatus $169,000
-
2018-03-29soldstatus $169,000 Sold
-
2018-03-29soldstatus $169,000 Sold
-
2018-02-07status Under Contract
-
2018-02-07status Pending
-
2017-10-19price $169,000
-
2017-10-19price $169,000
-
2017-10-04$175,000 New
-
2017-10-04$175,000 Active
-
2003-05-29soldstatus $71,442
ⓘ Source: listings_history table (triggers on properties + properties_extension) + one-shot
backfill from property_details.listing_events for pre-trigger history.
Tax reassessment forecast GA · Resets to sale price
- Current annual tax
- $1,506 · $126/mo
- Projected year-2 tax
- $2,530 · $211/mo
- Expected delta
- +$1,024/yr (+$85/mo · 68.0%)
ⓘ Screening estimate from a state-policy table — verify with the county assessor before closing.
Climate risk First Street
- Flood 7/10 Severe FEMA zone X (unshaded) · 78% chance over 30 yrs
- Wildfire 1/10 Low
- Heat 5/10 Major 7 d/yr ≥102°F today · 18 d/yr by 30 yrs out
- Wind 4/10 Moderate 19% chance of damaging wind over 30 yrs
- Air quality 5/10 Major 7 unhealthy d/yr today · 8 by 30 yrs out
Nearby sold comps map
Loading sold comps map…
Walkable amenities ~0.75 mi
Loading nearby amenities…
Taxation est. · year 1
- Rental income
- $29,369
- − Mortgage interest
- −$15,404
- − Property taxes
- −$1,506
- − Insurance
- −$2,172
- − Repairs & maintenance
- −$2,350
- − Management
- −$2,350
- − HOA
- −$3,300
- − Depreciation
- −$8,000
- Taxable loss
- −$5,713
- Est. tax savings @ 24.0%
- +$1,371
- After-tax cash flow
- $288/yr
For passive investors: Depreciation is non-cash, so a rental often shows a tax loss while cash-flowing — sheltering income. Rental losses are passive: they offset passive income freely, and up to $25,000/yr can offset ordinary (W-2) income if you actively participate and your MAGI is under $100k (phasing out to $0 by $150k); unused losses carry forward. On sale, claimed depreciation is recaptured at up to 25%, and gains may owe capital-gains tax (a 1031 exchange can defer both). Figures are a year-1 estimate at your 24.0% rate — not tax advice; consult a CPA.
Schools (NCES district)
- District
- Fulton County
- NCES district ID
- 1302280
- Math proficiency
- 49% ▼ -2.00%
- Reading proficiency
- 53% ▬ 0.00%
- Median HH income
- $68,035
- Composite
- 45.33/100
- National rank
- #2640
- State rank
- #12 of 174 in GA
Livability — Roswell
- Score
- 79/100
- State rank
- #12
- US rank
- #1990
Category grades
Schools grade is shown separately in the Schools card above.
Census & demographics
- Census place
- Roswell, GA
- County
- Fulton County · 1,094,430 people
- City population
- 102,317
- Metro
- Atlanta-Sandy Springs-Alpharetta, GA
- Population (ZIP)
- 56,263
- Household income
- $157,335
- Rent vs Own
- Severe rent burden
- 1111.0
Population outlook (Fulton County) Hauer SSP2
- Today (2025)
- 1,203,707 people
- By 2030
- 1,299,706 · +8.0%
- By 2040
- 1,488,256 · +23.6%
- By 2050
- 1,664,580 · +38.3%
- By 2075
- 2,036,072 · +69.2%
- By 2100
- 2,222,402 · +84.6%
Race, ethnicity, and origin ACS 2023
- Neighborhood character
- Predominantly White (73%)
- Race & ethnicity
- White 73% Two or more races 10% Hispanic / Latino 8% Black 7% Asian 5%
- Hispanic origin (detail)
- Mexican 2% Puerto Rican 1% Cuban 1%
- Common ancestry
- Lithuanian 3% Italian 3% Slovak 3%
- Foreign-born
- 14% · Canada, South Korea, Vietnam
- Languages at home
- 86% English-only · Other Indo-European 4% Spanish 4% Other Asian/Pacific 1%
Political lean MEDSL · Fulton
- 2024 margin
- Solid D (+44.9) · D 71.9% · R 27.0% · Other 1.1%
- 2008→2024 swing
- +9.8pp toward D · 2008: 35.0pp · 2024: 44.9pp
- All cycles
- 2024: D+44.9 2020: D+46.4 2016: D+42.1 2012: D+29.6 2008: D+35.0
Not yet ingested
- Civics
- —
Market trends
- HPI YoY
- ▼ -314.20%
- Current HPI
- 284.642
- Rent YoY
- ▲ 4.72%
- Metro
- Atlanta-Sandy Springs-Alpharetta, GA
- State GDP YoY
- ▲ 2.66%
- F500 in state
- 28
Industry mix (Fortune 500 HQ in GA)
| Industry | F500 HQs | Revenue |
|---|---|---|
| Paper / Packaging | 2 | $29B |
|
||
| Retail | 1 | $160B |
|
||
| Transportation / Logistics | 1 | $91B |
|
||
| Airlines | 1 | $62B |
|
||
| Consumer Goods | 1 | $47B |
|
||
| Utilities | 1 | $25B |
|
||
Price history
+284.9% since first listed17 events — show timeline
- 2026-03-13 Pending — FMLS
- 2026-03-04 Listing Removed — GAMLS
- 2026-03-04 Listed $275,000 FMLS
- 2025-10-15 Listed $285,000 GAMLS
- 2025-06-30 Listing Removed — FMLS
- 2025-03-07 Price Changed $299,000 FMLS
- 2025-02-15 Listed $335,000 FMLS
- 2018-04-02 Sold (Public Records) $169,000 Public Records
- 2018-03-29 Sold (MLS) $169,000 GAMLS
- 2018-03-29 Sold (MLS) $169,000 FMLS
- 2018-02-07 Pending — GAMLS
- 2018-02-07 Pending — FMLS
- 2017-10-19 Price Changed $169,000 GAMLS
- 2017-10-19 Price Changed $169,000 FMLS
- 2017-10-04 Listed $175,000 GAMLS
- 2017-10-04 Listed $175,000 FMLS
- 2003-05-29 Sold (Public Records) $71,442 Public Records
Property tax history
+2.2%/yrLatest (2025): $1,506 · +3.2% YoY. Source: county tax records.
Cash-flow waterfall
monthlySold comps — $/sqft
last 12 mo · ≤1 miLoading sold comps…