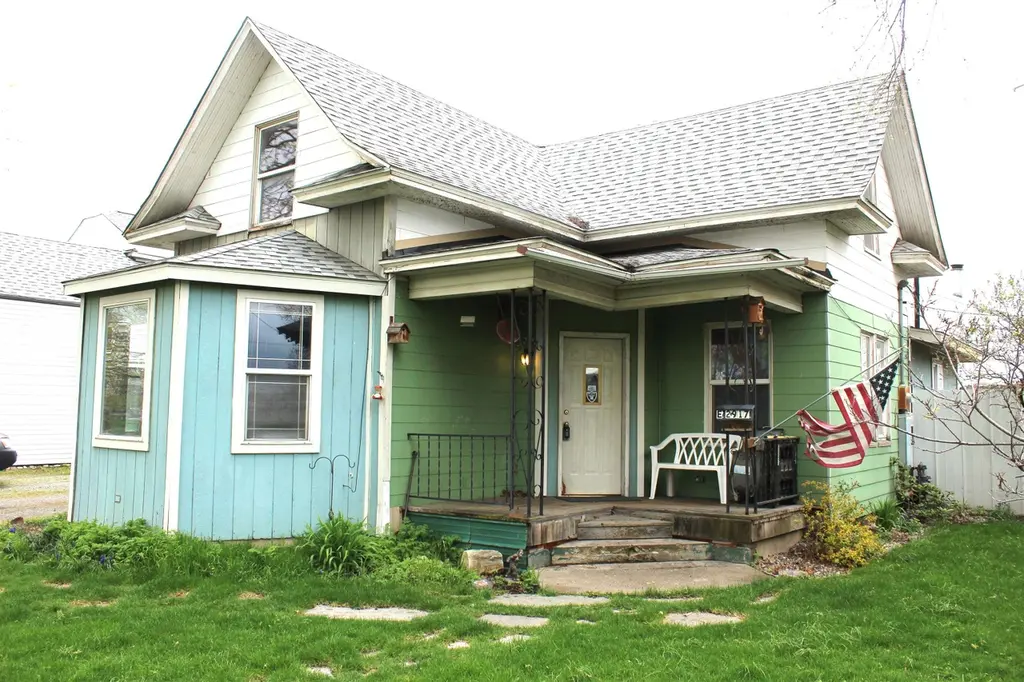
2917 E Bridgeport Ave · Spokane, WA
Flood risk 1/10 · Minimal
- FEMA flood zone
- X (unshaded)
- Chance of flooding over 30 yrs
- 0.0%
- Est. flood insurance / yr
- $507 – $1,088
Fire risk 6/10 · Moderate
- Est. fire insurance / yr
- $604 – $1,122
Heat risk 3/10 · Minor
- Hot days now (above 94°F)
- 7 days/yr
- Hot days in 30 yrs
- 15 days/yr
Wind risk 1/10 · Minimal
- Chance of severe wind over 30 yrs
- —
Air-quality risk 10/10 · Severe
- Unhealthy air days now
- 19 days/yr
- Unhealthy air days in 30 yrs
- 21 days/yr
Risk factors via First Street. Map © Google.
Why this score? — see what drove the C grade
The composite is a weighted blend of 9 inputs, each scored 0–100. Each bar is that input's sub-score; the figure is the points it added to the 100-point composite (weight × sub-score).
- ARV discount +15.0/15.0
- Cash flow +14.5/30.0
- Appreciation +5.0/10.0
- Schools +4.6/10.0
- DSCR +4.4/10.0
- 1% rule +4.0/10.0
- Livability +4.0/5.0
- Rent growth +2.5/5.0
- Condition / age +2.5/5.0
$210,000
🖨 Deal sheet 📄 Offer letter ✓ Due diligence
Listing remarks
1908 Craftsman Estate sale. Ready for remodeling, Roof in 2017, furnace in 2018, on demand water heater. Vinyl Windows. Upside potential. Shop built in 1996. Conventional cash sales only.
Key facts
- Vinyl windows
- Roof in 2017
- Furnace in 2018
Tags
Neighborhood map
What this means for you Summary
Snapshot
- This is a 3-bed/1.0-bath single-family listed at $210k.
Deal economics
- At list price, monthly cash flow is $44 ($532/yr) — positive.
- The deal already cash-flows at list — no discount required.
- To meet the 1% rule (rent ≥ 1% of price), the offer needs to be $189k (9.8% below list).
- Recommended offer: $189k (9.8% below list) — sets the bar for 1% rule.
- Cap rate 6.5% vs local median 3.2% in Spokane — top-decile yield for the area; either an underpriced asset or a hidden risk that comps aren't pricing in. Stress-test before assuming the spread holds.
Location & tenants
- Location reads 80/100 on livability (#93 in WA, #1,822 nationally) — a professional / high-income tenant draw. Strengths: amenities A+, commute A+, housing A+; Watch: crime F.
- Spokane School District (urban): math 47% / reading 58% proficiency, ranked #136 of 291 in WA (top 47%) — acceptable for families but not a draw, mixed tenant base, ~2y average lease.
- Market conditions: 1 active listings in the ZIP; 14 comparable units currently listed for rent nearby; rentals at typical pace (median 24d on market — plan ~3-4 weeks tenant-placement turnaround); 3,608 units permitted in Spokane County in 2024 (1,792 in 5+ unit buildings).
Forward outlook
- In year one you build about $8k of equity ($1k loan paydown + $6k appreciation (3.0% local appreciation)).
- Spokane County population projected at +13% by 2050 — modest demand growth; plan on rents tracking national, not racing it.
- At projected returns (3.0% appreciation + 3.0% rent growth), your $59k cash investment doubles in ~6 years — after that, you're playing with house money.
- By year 5, paydown + projected appreciation supports a ~$34k cash-out refi (75% LTV) — recoverable capital for the next deal without selling this one.
Negotiation context
- Only 9 days on market — expect competitive offers; lowballing is unlikely to land.
- Current owner paid $30k; list at $210k implies a 600% gain — meaningful room to come down on a strong offer.
Risks & watch-outs
- Watch-outs: built in 1908 — expect roof / HVAC / electrical / plumbing capex.
- Climate carrying-cost: major wildfire risk — expect insurance premiums to compound above CPI over the hold.
Questions for the listing agent
- Built in 1908 — when were the roof, HVAC, electrical panel, plumbing, and water heater last replaced?
- Is there a deadline driving the sale (1031 exchange, divorce, estate, relocation)? That informs how much negotiation room exists.
- Schools are B-rated — typically a magnet for longer-tenancy family renters. What's the average tenant stay here, and is there a school-zone premium baked into asking?
- Crime grade is F in this area — have there been break-ins, vandalism, or insurance claims at this property in the last 3 years? What carrier currently insures it and at what premium?
- What's the average days-on-market for RENTAL listings here right now (not sales)? A rising rental-DOM trend means longer vacancies and softer asking-rent achievability than the comps imply.
- What's the recent tenant-quality profile in this submarket — average credit score on applications, eviction rate, late-payment / NSF rate, and stable-employment percentage? A property-management company in the area should have these aggregated.
- How much new for-sale + rental construction is in the pipeline within 1–3 miles? Heavy new supply typically softens prices + rents 12–24 months out; constrained supply supports both.
Investment metrics
- 1% rule
- 0.90% ✗
- Cap rate
- 6.55%
- Cash-on-cash
- 0.90%
- DSCR
- 1.04
- GRM
- 9.2
CMA / ARV
- ARV (on-the-fly)
- $319,696
- Comps found
- 12
Show comp detail 12 sales within ~0.75 mi
| Address | Dist | Beds/Ba | Sqft | Sold | Price | $/sf | Match |
|---|---|---|---|---|---|---|---|
| 2615 E Liberty Ave | 0.21mi | 3/2.0 | 1,578 (+5%) | 5mo | $330,000 | $209 | 74 |
| 2927 N Smith St | 0.32mi | 4/2.0 (+1) | 1,536 (+2%) | 2mo | $326,000 | $212 | 71 |
| 2224 E Empire Ave | 0.54mi | 2/1.0 (-1) | 1,436 (-5%) | 5mo | $167,000 | $116 | 57 |
| 3904 E Frederick Ave | 0.70mi | 3/1.0 | 1,575 (+4%) | 4mo | $340,000 | $216 | 56 |
| 2823 N Nelson St | 0.31mi | 2/2.0 (-1) | 1,679 (+11%) | 6mo | $375,000 | $223 | 52 |
| 3421 E Grace Ave | 0.50mi | 3/2.0 | 1,686 (+12%) | 1mo | $310,000 | $184 | 52 |
| 2927 E Marshall Ave | 0.73mi | 4/2.0 (+1) | 1,536 (+2%) | 3mo | $330,000 | $215 | 51 |
| 1914 E Gordon Ave | 0.68mi | 4/1.0 (+1) | 1,589 (+5%) | 7mo | $280,000 | $176 | 49 |
| 3423 E Fairview Ave | 0.42mi | 4/2.0 (+1) | 1,723 (+14%) | 6mo | $369,000 | $214 | 42 |
| 3927 E Euclid Ave | 0.73mi | 3/2.0 | 1,687 (+12%) | 1mo | $395,000 | $234 | 41 |
| 2607 N Crestline St | 0.72mi | 3/2.0 | 1,712 (+14%) | 3mo | $285,000 | $166 | 37 |
| 2323 E Rich Ave | 0.72mi | 2/1.0 (-1) | 1,308 (-13%) | 3mo | $236,200 | $181 | 36 |
Match score weights: distance 35% · size 25% · config 20% · recency 20%. Top-matched comps best support the ARV.
Projected returns pro-forma
3.0% appreciation · 3.0% rent growth · sell at horizon
- IRR
- 8.4%
- Equity multiple
- 1.48×
- Total profit
- $28,149
- Equity at exit
- $94,425
- IRR
- 10.9%
- Equity multiple
- 2.64×
- Total profit
- $96,324
- Equity at exit
- $145,520
Cash invested: $58,800 (down + closing). Projections, not guarantees.
Landlord ↔ Tenant lean methodology
- Overall (STATE)
- 28 Tenant-Leaning
- State Washington
- 28 Tenant-Leaning · D+8
- County
- — inherits STATE
- City
- — inherits STATE
ZIP-level market 99207-5707
- Active inventory
- 1
- Price-to-rent
- 9.2×
Monthly cashflow live
- Estimated rent
- $1,893 high interval (Pro) →
- Mortgage (P&I)
- −$1,101
- Tax est. 1.5%
- −$262 /mo · $3,150/yr
- Insurance
- −$88
- HOA
- −$0
- Vacancy / Maint / Mgmt
- −$398
- Net cashflow
- $44
Break-even live
UW: 25.0% down · 7.5% · 30yr · 1.5% tax · 5.0% vac · 8.0% maint · 8.0% mgmt
Financing live
Cash to close
- Down payment
- $52,500
- Closing costs
- $6,300
- Reserves months
- —
- Total cash needed
- —
Loan-product check · same deal, 3 products live
Conventional
25% down · 7.5% · 30yr
- Down + closing
- —
- Monthly P&I
- —
- Monthly cashflow
- —
- DSCR
- —
- Eligible?
- —
Personal DTI + credit; lowest rate.
DSCR
20% down · 8.5% · 30yr
- Down + closing
- —
- Monthly P&I
- —
- Monthly cashflow
- —
- DSCR
- —
- Eligible?
- —
No personal income docs; deal must DSCR.
Hard money
10% down · 12.0% · 12mo
- Down + closing
- —
- Monthly P&I
- —
- Monthly cashflow
- —
- DSCR
- —
- Eligible?
- —
Short-term bridge; refi at stabilization.
Rent comps 14 comps
| Address | Beds | Baths | Sqft | Rent | $/sqft | DOM | Units | Dist |
|---|---|---|---|---|---|---|---|---|
| 1928 E Bridgeport Ave Spokane, WA | 4.0 | 2.0 | 2200 | $2,045 | $0.93 | 23d | 1 | 0.64mi |
| 3431 E Montgomery Ave #3433 Spokane, WA | 3.0 | 2.0 | 1056 | $1,795 | $1.70 | 23d | 1 | 0.73mi |
| 2704 N Miami Ct Spokane, WA | 3.0 | 2.0 | 1728 | $2,350 | $1.36 | 23d | 1 | 0.99mi |
| 4730 N Freya St Spokane, WA | 3.0 | 1.0 | 1304 | $1,900 | $1.46 | 13d | 1 | 1.03mi |
| 3717 N Perry St Unit 3717 Spokane, WA | 4.0 | 2.0 | 1450 | $2,050 | $1.41 | 23d | 1 | 1.11mi |
| 3717 N Perry St Unit 3719 Spokane, WA | 4.0 | 2.0 | 1450 | $1,950 | $1.34 | 23d | 1 | 1.11mi |
| 4216 E Princeton Ave Spokane, WA | 2.0 | 1.0 | 1944 | $1,695 | $0.87 | 21d | 1 | 1.15mi |
| 1842 E South Riverton Ave Spokane, WA | 1.0–3.0 | 1.0–2.0 | 915 | $1,710 | $1.87 | 23d | 1 | 1.17mi |
| 3316 N Nevada St Spokane, WA | 2.0 | 1.0 | 1250 | $1,395 | $1.12 | 23d | 1 | 1.31mi |
| 4726 E Buckeye Ave Spokane, WA | 1.0–3.0 | 1.0–2.0 | 965 | $1,685 | $1.75 | 13d | 1 | 1.31mi |
| 1107 E Walton Ave Spokane, WA | 3.0 | 1.0 | 1600 | $1,975 | $1.23 | 23d | 1 | 1.32mi |
| 1608 E South Riverton Ave Spokane, WA | 3.0 | 2.0 | 1215 | $1,995 | $1.64 | 14d | 2 | 1.36mi |
| 2523 E Desmet Ave Spokane, WA | 3.0 | 2.5 | 1500 | $1,700 | $1.13 | 14d | 1 | 1.42mi |
| 1007 E Carlisle Ave Spokane, WA | 2.0 | 1.5 | 1680 | $1,895 | $1.13 | 23d | 1 | 1.42mi |
Listing history 3 events
-
2026-04-23status Pending
-
2026-04-10$210,000 Active
-
1992-06-02soldstatus $30,000
ⓘ Source: listings_history table (triggers on properties + properties_extension) + one-shot
backfill from property_details.listing_events for pre-trigger history.
Climate risk First Street
- Flood 1/10 Low FEMA zone X (unshaded) · 0% chance over 30 yrs
- Wildfire 6/10 Major
- Heat 3/10 Moderate 7 d/yr ≥94°F today · 15 d/yr by 30 yrs out
- Wind 1/10 Low
- Air quality 10/10 Extreme 19 unhealthy d/yr today · 21 by 30 yrs out
Nearby sold comps map
Loading sold comps map…
Walkable amenities ~0.75 mi
Loading nearby amenities…
Taxation est. · year 1
- Rental income
- $22,718
- − Mortgage interest
- −$11,763
- − Property taxes
- −$3,150
- − Insurance
- −$1,050
- − Repairs & maintenance
- −$1,817
- − Management
- −$1,817
- − Depreciation
- −$6,109
- Taxable loss
- −$2,989
- Est. tax savings @ 24.0%
- +$717
- After-tax cash flow
- $1,249/yr
For passive investors: Depreciation is non-cash, so a rental often shows a tax loss while cash-flowing — sheltering income. Rental losses are passive: they offset passive income freely, and up to $25,000/yr can offset ordinary (W-2) income if you actively participate and your MAGI is under $100k (phasing out to $0 by $150k); unused losses carry forward. On sale, claimed depreciation is recaptured at up to 25%, and gains may owe capital-gains tax (a 1031 exchange can defer both). Figures are a year-1 estimate at your 24.0% rate — not tax advice; consult a CPA.
Schools (NCES district)
- District
- Spokane School District
- NCES district ID
- 5308250
- Math proficiency
- 47% ▲ 1.00%
- Reading proficiency
- 58% ▲ 1.00%
- Median HH income
- $43,187
- Composite
- 46.1/100
- National rank
- #5477
- State rank
- #136 of 291 in WA
Livability — Spokane
- Score
- 80/100
- State rank
- #93
- US rank
- #1822
Category grades
Schools grade is shown separately in the Schools card above.
Census & demographics
- Census place
- Spokane, WA
Population outlook (Spokane County) Hauer SSP2
- Today (2025)
- 531,314 people
- By 2030
- 549,278 · +3.4%
- By 2040
- 577,822 · +8.8%
- By 2050
- 598,188 · +12.6%
- By 2075
- 630,744 · +18.7%
- By 2100
- 622,360 · +17.1%
Not yet ingested
- Political lean
- —
- Race & ethnicity
- —
- Common origin
- —
- Civics
- —
Market trends
- HPI YoY
- —
- Current HPI
- —
- Rent YoY
- —
- Metro
- —
- State GDP YoY
- ▲ 4.65%
- F500 in state
- 22
Industry mix (Fortune 500 HQ in WA)
| Industry | F500 HQs | Revenue |
|---|---|---|
| Retail | 2 | $269B |
|
||
| Technology / Retail | 1 | $638B |
|
||
| Technology | 1 | $245B |
|
||
| Telecommunications | 1 | $38B |
|
||
| Food / Beverage | 1 | $36B |
|
||
| Automotive / Trucks | 1 | $34B |
|
||
Price history
+600.0% since first listed3 events — show timeline
- 2026-04-23 Pending — SPOKANEMLS as Distributed by MLS Grid
- 2026-04-10 Listed $210,000 SPOKANEMLS as Distributed by MLS Grid
- 1992-06-02 Sold (Public Records) $30,000 Public Records
Property tax history
-11.7%/yrLatest (2026): $290 · +16.0% YoY. Source: county tax records.
Cash-flow waterfall
monthlySold comps — $/sqft
last 12 mo · ≤1 miLoading sold comps…