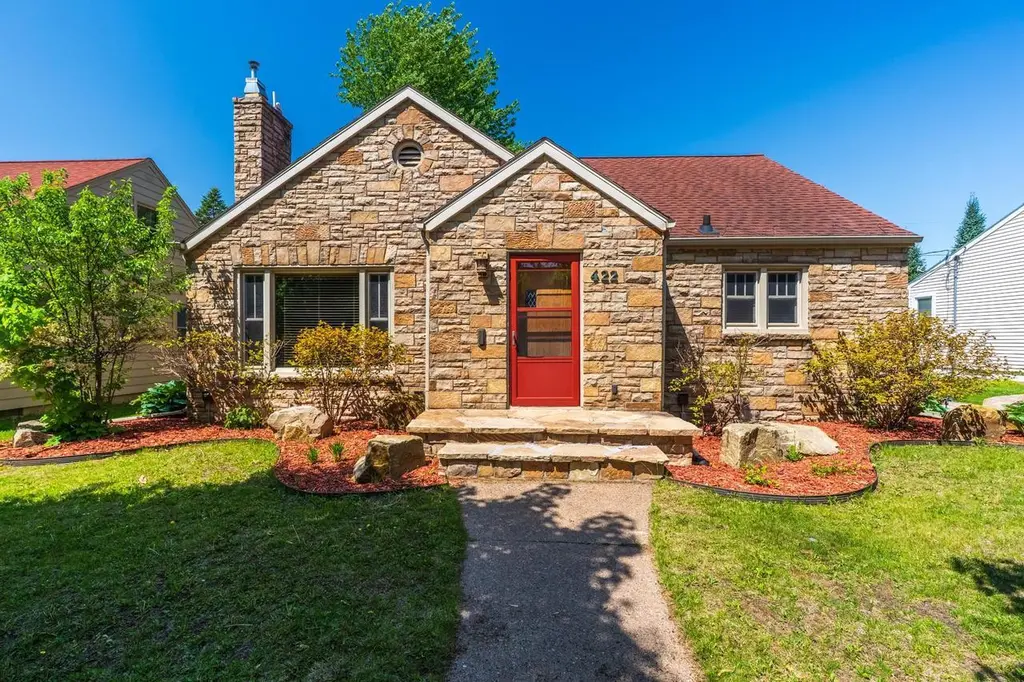
422 N 7th Ave · Wausau, WI
Flood risk 1/10 · Minimal
- FEMA flood zone
- X (unshaded)
- Chance of flooding over 30 yrs
- 0.0%
- Est. flood insurance / yr
- $473 – $860
Fire risk 1/10 · Minimal
- Est. fire insurance / yr
- $636 – $1,182
Heat risk 1/10 · Minimal
- Hot days now (above 95°F)
- 7 days/yr
- Hot days in 30 yrs
- 12 days/yr
Wind risk 1/10 · Minimal
- Chance of severe wind over 30 yrs
- —
Air-quality risk 1/10 · Minimal
- Unhealthy air days now
- 0 days/yr
- Unhealthy air days in 30 yrs
- 0 days/yr
Risk factors via First Street. Map © Google.
Why this score? — see what drove the D grade
The composite is a weighted blend of 9 inputs, each scored 0–100. Each bar is that input's sub-score; the figure is the points it added to the 100-point composite (weight × sub-score).
- Cash flow +11.7/30.0
- ARV discount +8.5/15.0
- Rent growth +5.0/5.0
- Livability +4.5/5.0
- 1% rule +3.6/10.0
- DSCR +3.4/10.0
- Schools +3.0/10.0
- Condition / age +2.5/5.0
- Appreciation +0.0/10.0
$269,900
🖨 Deal sheet 📄 Offer letter ✓ Due diligence
Listing remarks
Welcome to this beautifully maintained 4-bedroom, 2-bathroom home offering a functional layout, stylish updates, and exceptional spaces for both everyday living and entertaining. Step inside to an inviting living room that flows seamlessly into the updated kitchen, featuring modern countertops and an open-concept design that creates a warm and welcoming atmosphere. The kitchen connects directly to the dining room, where French doors lead to a fully fenced backyard designed for relaxation and hosting guests. The outdoor space is already set up for entertaining with stationary coolers in place and a grill connected directly to the gas line for effortless outdoor cooking. The spacious primary
Key facts
- Extra-large bedroom
- Soaking tub
- Updated kitchen
Tags
Property features AI
Finance
- Other: Lot size approximately 0.14 acres
Exterior
- Parking: Detached 2-car garage
- Utilities: Municipal water; Municipal sewer; Natural gas
- Home design: 1.5-story single-family home; Residential zoning
- Construction: Shingle roof; Finished basement (full); Finished below-grade living space
- Exterior features: Irrigation system; Patio; Fenced yard; Stone exterior
Interior
- Kitchen: Refrigerator; Range/oven; Dishwasher; Microwave
- Bedrooms: Primary bedroom on the main level (14 x 12); Second bedroom on the upper level (24 x 17); Two additional bedrooms on the lower level (each 10 x 13)
- Flooring: Carpet; Tile floors; Wood floors
- Bathrooms: Two full bathrooms
- Heating & cooling: Forced air heating (natural gas); Central air conditioning
- Interior features: Water softener; Smoke detectors; Cable/satellite available; Skylights
Neighborhood map
What this means for you Summary
Snapshot
- This is a 4-bed/5.0-bath single-family listed at $270k.
Deal economics
- At list price, monthly cash flow is $-79 ($-949/yr) — negative.
- To cash-flow at today's rent, offer at most $256k (5.2% below list).
- To meet the 1% rule (rent ≥ 1% of price), the offer needs to be $231k (14.2% below list).
- Recommended offer: $231k (14.2% below list) — sets the bar for 1% rule.
- Cap rate 5.9% vs local median 3.3% in Wausau — top-decile yield for the area; either an underpriced asset or a hidden risk that comps aren't pricing in. Stress-test before assuming the spread holds.
Location & tenants
- Location reads 91/100 on livability (#4 in WI, #55 nationally) — a professional / high-income tenant draw. Strengths: amenities A+, commute A+, cost of living A+; Watch: schools C-, employment D.
- Wausau School District (urban): math 33% / reading 36% proficiency, ranked #235 of 342 in WI (top 69%) — families likely to look elsewhere, expect single-tenant / working-renter base with shorter leases.
- Market conditions: Rents rising fast (+10.2%/yr); 66 active listings in the ZIP; 3 comparable units currently listed for rent nearby; rentals lingering (median 44d on market — plan ~5-8 weeks vacancy on turnover, expect pricing pressure); 100% of comp listings sitting > 30 days — soft ceiling on asking rent; 298 units permitted in Marathon County in 2024 (81 in 5+ unit buildings).
- This rent runs 39% of the median local income ($72k/yr) — at the standard rent-burdened threshold; future hikes will face affordability resistance.
Forward outlook
- Local home prices are declining (-3.0%/yr); year-one equity from $2k of loan paydown is wiped out by about $8k of value loss. Plan a longer hold.
- Marathon County population projected to shrink 6% by 2050 — rents likely to lag national; underwrite the cash flow, not the appreciation.
Negotiation context
- Only 2 days on market — expect competitive offers; lowballing is unlikely to land.
- Current owner paid $172k; list at $270k implies a 57% gain — meaningful room to come down on a strong offer.
Risks & watch-outs
- Watch-outs: built in 1947 — expect roof / HVAC / electrical / plumbing capex.
Questions for the listing agent
- What do current leases actually rent for vs. the listed asking? Can we see a recent rent roll and the last 12 months of T-12 income?
- Built in 1947 — when were the roof, HVAC, electrical panel, plumbing, and water heater last replaced?
- Is there a deadline driving the sale (1031 exchange, divorce, estate, relocation)? That informs how much negotiation room exists.
- The area grade is low — what's the realistic commute time and amenity access for the typical tenant pool here? Any planned neighborhood developments (good or bad) we should know about?
- What's the average days-on-market for RENTAL listings here right now (not sales)? A rising rental-DOM trend means longer vacancies and softer asking-rent achievability than the comps imply.
- What's the recent tenant-quality profile in this submarket — average credit score on applications, eviction rate, late-payment / NSF rate, and stable-employment percentage? A property-management company in the area should have these aggregated.
- How much new for-sale + rental construction is in the pipeline within 1–3 miles? Heavy new supply typically softens prices + rents 12–24 months out; constrained supply supports both.
Investment metrics
- 1% rule
- 0.86% ✗
- Cap rate
- 5.94%
- Cash-on-cash
- -1.26%
- DSCR
- 0.94
- GRM
- 9.7
CMA / ARV
- ARV (on-the-fly)
- $275,988
- Comps found
- 12
Show comp detail 12 sales within ~0.75 mi
| Address | Dist | Beds/Ba | Sqft | Sold | Price | $/sf | Match |
|---|---|---|---|---|---|---|---|
| 330 N 5th Ave | 0.14mi | 5/3.0 (+1) | 2,286 (-10%) | 9mo | $249,900 | $109 | 57 |
| 1225 Sunset Dr | 0.47mi | 5/2.5 (+1) | 2,344 (-7%) | 1mo | $311,750 | $133 | 50 |
| 409 S 12th Ave | 0.66mi | 4/3.0 | 2,404 (-5%) | 8mo | $192,000 | $80 | 46 |
| 1212 Cedar St | 0.36mi | 3/2.5 (-1) | 2,724 (+8%) | 16mo | $310,000 | $114 | 42 |
| 1402 W Wausau Ave | 0.61mi | 3/3.0 (-1) | 2,576 (+2%) | 18mo | $345,000 | $134 | 40 |
| 1211 Cedar St | 0.36mi | 3/2.5 (-1) | 2,294 (-9%) | 16mo | $225,650 | $98 | 40 |
| 1402 W Knox St | 0.69mi | 3/2.5 (-1) | 2,590 (+2%) | 14mo | $325,604 | $126 | 38 |
| 1302 Quaw St | 0.48mi | 3/3.0 (-1) | 2,372 (-6%) | 20mo | $300,000 | $126 | 37 |
| 1122 Cedar St | 0.27mi | 4/2.0 | 2,184 (-14%) | 19mo | $185,000 | $85 | 37 |
| 113 N 11th Ave | 0.38mi | 5/2.0 (+1) | 2,156 (-15%) | 9mo | $230,000 | $107 | 33 |
| 916 N 6th Ave | 0.43mi | 5/2.0 (+1) | 2,320 (-8%) | 20mo | $234,900 | $101 | 32 |
| 213 S 13th Ave | 0.60mi | 3/2.5 (-1) | 2,156 (-15%) | 20mo | $225,000 | $104 | 15 |
Match score weights: distance 35% · size 25% · config 20% · recency 20%. Top-matched comps best support the ARV.
Projected returns pro-forma
-3.0% appreciation · 8.0% rent growth · sell at horizon
- IRR
- -12.8%
- Equity multiple
- 0.52×
- Total profit
- $-36,477
- Equity at exit
- $40,243
- IRR
- 2.7%
- Equity multiple
- 1.23×
- Total profit
- $17,676
- Equity at exit
- $23,336
Cash invested: $75,572 (down + closing). Projections, not guarantees.
Landlord ↔ Tenant lean methodology
- Overall (STATE)
- 73 Landlord-Friendly
- State Wisconsin
- 73 Landlord-Friendly · R+2
- County
- — inherits STATE
- City
- — inherits STATE
ZIP-level market 54401
- Home prices YoY
- -32.2%
- Rents YoY
- 10.2%
- Active inventory
- 66
- Price-to-rent
- 9.7×
Monthly cashflow live
- Estimated rent
- $2,315 medium interval (Pro) →
- Mortgage (P&I)
- −$1,415
- Tax from tax record
- −$380 /mo · $4,558/yr
- Insurance
- −$112
- HOA
- −$0
- Vacancy / Maint / Mgmt
- −$486
- Net cashflow
- $-79
Break-even live
UW: 25.0% down · 7.5% · 30yr · 1.5% tax · 5.0% vac · 8.0% maint · 8.0% mgmt
Financing live
Cash to close
- Down payment
- $67,475
- Closing costs
- $8,097
- Reserves months
- —
- Total cash needed
- —
Loan-product check · same deal, 3 products live
Conventional
25% down · 7.5% · 30yr
- Down + closing
- —
- Monthly P&I
- —
- Monthly cashflow
- —
- DSCR
- —
- Eligible?
- —
Personal DTI + credit; lowest rate.
DSCR
20% down · 8.5% · 30yr
- Down + closing
- —
- Monthly P&I
- —
- Monthly cashflow
- —
- DSCR
- —
- Eligible?
- —
No personal income docs; deal must DSCR.
Hard money
10% down · 12.0% · 12mo
- Down + closing
- —
- Monthly P&I
- —
- Monthly cashflow
- —
- DSCR
- —
- Eligible?
- —
Short-term bridge; refi at stabilization.
Rent comps 3 comps
| Address | Beds | Baths | Sqft | Rent | $/sqft | DOM | Units | Dist |
|---|---|---|---|---|---|---|---|---|
| 1520 Elm St Wausau, WI | 3.0 | 1.0–2.0 | 1250 | $3,399 | $2.72 | 43d | 3 | 0.57mi |
| 1202 N 16th Ave Wausau, WI | 3.0 | 2.5 | 1900 | $2,170 | $1.14 | 43d | 1 | 0.82mi |
| 1214 N 16th Ave Wausau, WI | 3.0 | 2.5 | 2000 | $2,360 | $1.18 | 43d | 1 | 0.86mi |
Listing history 5 events
-
2026-05-31status $269,900 Pending 2 DOM
-
2026-05-30days on market $269,900 Active 2 DOM
-
2026-05-28$269,900 Active
-
2020-09-17soldstatus $171,800
-
2005-06-29soldstatus $119,000
ⓘ Source: listings_history table (triggers on properties + properties_extension) + one-shot
backfill from property_details.listing_events for pre-trigger history.
Tax reassessment forecast WI · Partial reset (capped growth)
- Current annual tax
- $4,558 · $380/mo
- Projected year-2 tax
- $4,776 · $398/mo
- Expected delta
- +$218/yr (+$18/mo · 4.8%)
ⓘ Screening estimate from a state-policy table — verify with the county assessor before closing.
Climate risk First Street
- Flood 1/10 Low FEMA zone X (unshaded) · 0% chance over 30 yrs
- Wildfire 1/10 Low
- Heat 1/10 Low 7 d/yr ≥95°F today · 12 d/yr by 30 yrs out
- Wind 1/10 Low
- Air quality 1/10 Low 0 unhealthy d/yr today · 0 by 30 yrs out
Nearby sold comps map
Loading sold comps map…
Walkable amenities ~0.75 mi
Loading nearby amenities…
Taxation est. · year 1
- Rental income
- $27,777
- − Mortgage interest
- −$15,119
- − Property taxes
- −$4,558
- − Insurance
- −$1,350
- − Repairs & maintenance
- −$2,222
- − Management
- −$2,222
- − Depreciation
- −$7,852
- Taxable loss
- −$5,546
- Est. tax savings @ 24.0%
- +$1,331
- After-tax cash flow
- $382/yr
For passive investors: Depreciation is non-cash, so a rental often shows a tax loss while cash-flowing — sheltering income. Rental losses are passive: they offset passive income freely, and up to $25,000/yr can offset ordinary (W-2) income if you actively participate and your MAGI is under $100k (phasing out to $0 by $150k); unused losses carry forward. On sale, claimed depreciation is recaptured at up to 25%, and gains may owe capital-gains tax (a 1031 exchange can defer both). Figures are a year-1 estimate at your 24.0% rate — not tax advice; consult a CPA.
Schools (NCES district)
- District
- Wausau School District
- NCES district ID
- 5515900
- Math proficiency
- 33% ▼ -9.00%
- Reading proficiency
- 36% ▼ -7.00%
- Median HH income
- $47,238
- Composite
- 29.66/100
- National rank
- #6466
- State rank
- #235 of 342 in WI
Livability — Wausau
- Score
- 91/100
- State rank
- #4
- US rank
- #55
Category grades
Schools grade is shown separately in the Schools card above.
Census & demographics
- Census place
- Wausau, WI
- County
- Marathon County · 76,019 people
- City population
- 56,642
- Metro
- Wausau-Weston, WI
- Population (ZIP)
- 31,692
- Household income
- $71,586
- Rent vs Own
- Severe rent burden
- 665.0
Population outlook (Marathon County) Hauer SSP2
- Today (2025)
- 138,030 people
- By 2030
- 138,087 · +0.0%
- By 2040
- 135,688 · -1.7%
- By 2050
- 129,390 · -6.3%
- By 2075
- 110,912 · -19.6%
- By 2100
- 85,136 · -38.3%
Race, ethnicity, and origin ACS 2023
- Neighborhood character
- Predominantly White (78%)
- Race & ethnicity
- White 78% Asian 12% Two or more races 5% Hispanic / Latino 5%
- Common ancestry
- Romanian 12% Lithuanian 4% Portuguese 4%
- Foreign-born
- 7% · Canada
- Languages at home
- 86% English-only · Other Asian/Pacific 9% Spanish 3% Other Indo-European 1%
Political lean MEDSL · Marathon
- 2024 margin
- R (+18.7) · D 40.1% · R 58.7% · Other 1.2%
- 2008→2024 swing
- -27.5pp toward R · 2008: 8.9pp · 2024: -18.7pp
- All cycles
- 2024: R+18.7 2020: R+18.0 2016: R+18.2 2012: R+6.1 2008: D+8.9
Not yet ingested
- Civics
- —
Market trends
- HPI YoY
- ▼ -99.85%
- Current HPI
- 210.5242
- Rent YoY
- ▲ 10.15%
- Metro
- Wausau-Weston, WI
- State GDP YoY
- ▲ 2.10%
- F500 in state
- 20
Industry mix (Fortune 500 HQ in WI)
| Industry | F500 HQs | Revenue |
|---|---|---|
| Industrial Machinery | 4 | $23B |
|
||
| Industrial Technology | 2 | $36B |
|
||
| Insurance | 1 | $36B |
|
||
| Professional Services | 1 | $19B |
|
||
| Utilities | 1 | $9B |
|
||
| Consumer Goods | 1 | $3B |
|
||
Price history
+126.8% since first listed3 events — show timeline
- 2026-05-28 Listed $269,900 CWMLS
- 2020-09-17 Sold (Public Records) $171,800 Public Records
- 2005-06-29 Sold (Public Records) $119,000 Public Records
Property tax history
+3.7%/yrLatest (2025): $4,558 · -1.3% YoY. Source: county tax records.
Cash-flow waterfall
monthlySold comps — $/sqft
last 12 mo · ≤1 miLoading sold comps…