 Multi-family
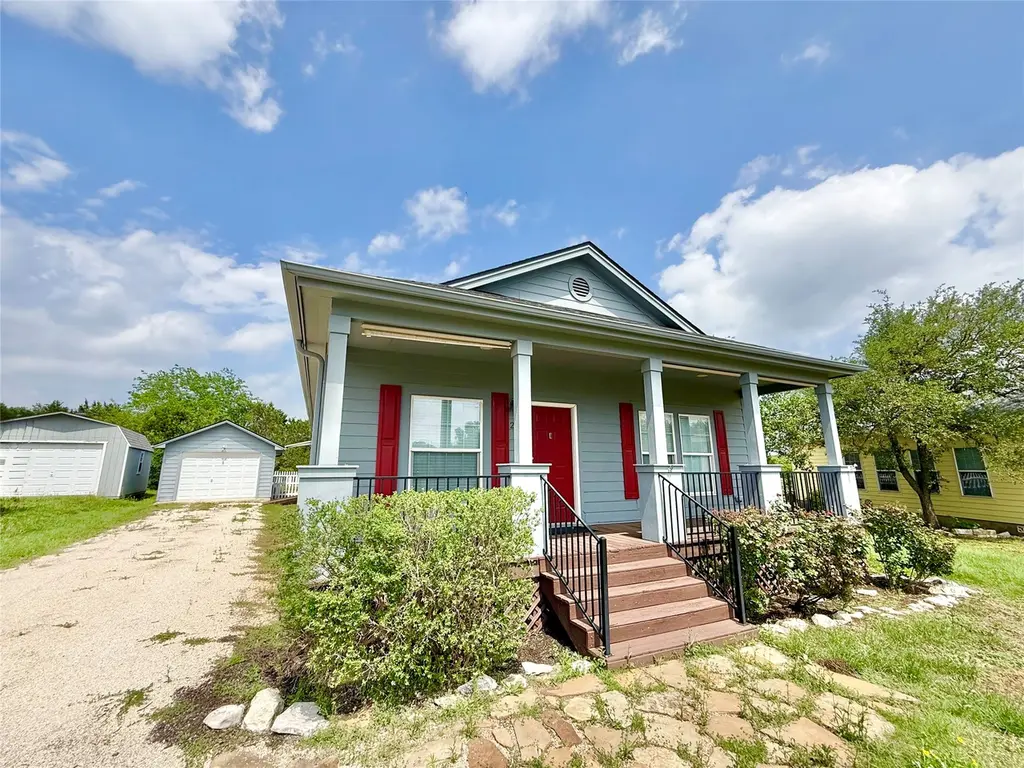
289 Heatherwood Dr · Dripping Springs, TX
Flood risk 1/10 · Minimal
- FEMA flood zone
- X (unshaded)
- Chance of flooding over 30 yrs
- 0.0%
- Est. flood insurance / yr
- $507 – $1,088
Fire risk 6/10 · Moderate
- Est. fire insurance / yr
- $1,222 – $2,270
Heat risk 8/10 · Major
- Hot days now (above 107°F)
- 7 days/yr
- Hot days in 30 yrs
- 23 days/yr
Wind risk 7/10 · Major
- Chance of severe wind over 30 yrs
- 78.0%
Air-quality risk 2/10 · Minimal
- Unhealthy air days now
- 0 days/yr
- Unhealthy air days in 30 yrs
- 1 days/yr
Risk factors via First Street. Map © Google.
Why this score? — see what drove the D grade
The composite is a weighted blend of 9 inputs, each scored 0–100. Each bar is that input's sub-score; the figure is the points it added to the 100-point composite (weight × sub-score).
- ARV discount +15.0/15.0
- Cash flow +7.0/30.0
- Schools +5.5/10.0
- Condition / age +4.0/5.0
- Livability +3.8/5.0
- Rent growth +2.5/5.0
- 1% rule +2.3/10.0
- DSCR +1.2/10.0
- Appreciation +0.0/10.0
$369,900
🖨 Deal sheet (PDF) 📄 Offer letter ✓ Due diligence
Multi-family units
County records classify this as Multi-Family (5+ Unit). Listing-text estimate: 1 unit. estimate disagrees with records
5+ unit building — per-unit beds/baths from public records are typically unavailable; the breakdown below (if shown) is an estimate from the listing text.
Listing remarks
Enjoy life from both the spacious front and back porches of this charming home, nestled in the quaint Heatherwood Cottage community. With just 16 homes and a private park for residents, this neighborhood offers a peaceful, country-like atmosphere—complete with a picturesque windmill greeting you at the entrance. Inside, the gourmet kitchen features an abundance of cabinetry, perfect for storage and entertaining. The open living and dining areas provide plenty of space to gather, while the absence of carpet throughout the home adds a clean, modern touch. The primary suite boasts a generously sized bathroom with dual closets for added convenience. The monthly HOA fee of $120 includes wa
Key facts
- Garage
- Built 2006
- Listed 46 days
Property features AI
Finance
- HOA & community: Heatherwood COA with monthly fee; HOA fee includes grounds maintenance, water and sewer; Community common grounds, playground, and sport court(s)
Exterior
- Parking: Detached parking; 1 covered space; 2 total parking spaces; 1-car garage
- Security: Smoke detector(s); Carbon monoxide detector(s)
- Utilities: Electricity connected; Water connected (private); Sewer connected (private)
- Home design: Single-story; Resale property; Faces southwest; Has a view; Pillar/post/pier foundation
- Construction: Masonry construction; Composition roof; Built by Papalote Homes
- Exterior features: Rear covered porch; Front porch; Exterior steps; Rain gutters; Shed(s); Medium-size trees; Back yard fencing (wood, fenced)
Interior
- Kitchen: Dishwasher; Free-standing electric range; Microwave; Refrigerator; Disposal; Exhaust fan; Stainless steel appliances; Breakfast bar
- Bedrooms: 3 main-level bedrooms; Main level primary bedroom
- Flooring: Tile; Vinyl
- Bathrooms: 2 full bathrooms; Double vanity
- Heating & cooling: Central heating (electric); Central air conditioning (electric)
- Interior features: Breakfast bar; Ceiling fan(s); Crown molding; Double vanity; High ceilings; Open floorplan; Recessed lighting; Walk-in closet(s); Blinds
- Laundry & utility: Main level laundry room; Washer hookup; Electric water heater; Water softener
Neighborhood map
What this means for you Summary
Snapshot
- This is a 3-bed/2.0-bath multifamily listed at $370k. Condition is rated good.
Deal economics
- At list price, monthly cash flow is $-548 ($-7k/yr) — negative.
- To cash-flow at today's rent, offer at most $291k (21.4% below list).
- To meet the 1% rule (rent ≥ 1% of price), the offer needs to be $269k (27.2% below list).
- Recommended offer: $269k (27.2% below list) — sets the bar for 1% rule.
- Cap rate 4.5% vs local median 2.1% in Dripping Springs — top-decile yield for the area; either an underpriced asset or a hidden risk that comps aren't pricing in. Stress-test before assuming the spread holds.
Location & tenants
- Location reads 75/100 on livability (#149 in TX, #4,158 nationally) — a middle-class / working-renter tenant base. Strengths: crime A+, employment A+, housing A+; Watch: cost of living D, amenities F, commute F.
- Dripping Springs ISD (rural): math 55% / reading 61% proficiency, ranked #41 of 826 in TX (top 5%) — acceptable for families but not a draw, mixed tenant base, ~2y average lease; only 16% free/reduced lunch — higher-income household profile.
- Zoned schools: Walnut Springs El (math 51% / reading 58%, grade C, #621 of 4,322 statewide, top 15%, 887 students, 13% FRL); Dripping Springs Middle (math 52% / reading 53%, grade C+, #293 of 1,662 statewide, top 18%, 882 students, 0% FRL); Dripping Springs H S (math 45% / reading 76%, grade C+, #268 of 1,632 statewide, top 17%, 2,433 students, 0% FRL).
- Market conditions: 141 active listings in the ZIP; 5,270 units permitted in Hays County in 2024 (1,464 in 5+ unit buildings).
Forward outlook
- Local home prices are declining (-3.0%/yr); year-one equity from $3k of loan paydown is wiped out by about $11k of value loss. Plan a longer hold.
- Hays County population projected at +93% by 2050 — long-run rental-demand tailwind backs the buy-and-hold thesis.
Negotiation context
- It's been on market 46 days — a 3% lower offer ($359k) is reasonable based on typical stale-listing flexibility.
- 2 sale attempts; this cycle's ask is 14726% above the opening price — seller raised mid-cycle; expect resistance to lowballs.
Risks & watch-outs
- Climate carrying-cost: major wind risk, 78% chance of damaging wind over 30y; major wildfire risk; extreme-heat days projected 7→23/yr by 2055 (HVAC capex compounding) — expect insurance premiums to compound above CPI over the hold.
Questions for the listing agent
- What do current leases actually rent for vs. the listed asking? Can we see a recent rent roll and the last 12 months of T-12 income?
- It's been on market 46 days. Have you received any prior offers? Is the seller open to a 27% concession, seller financing, or rate buy-down credit?
- What does the HOA fee cover, when was the last increase, and are there any pending special assessments or reserve-fund shortfalls?
- Is there a deadline driving the sale (1031 exchange, divorce, estate, relocation)? That informs how much negotiation room exists.
- The area grade is low — what's the realistic commute time and amenity access for the typical tenant pool here? Any planned neighborhood developments (good or bad) we should know about?
- What's the average days-on-market for RENTAL listings here right now (not sales)? A rising rental-DOM trend means longer vacancies and softer asking-rent achievability than the comps imply.
- What's the recent tenant-quality profile in this submarket — average credit score on applications, eviction rate, late-payment / NSF rate, and stable-employment percentage? A property-management company in the area should have these aggregated.
- How much new apartment / multifamily construction is in the pipeline within 1–3 miles? Heavy new supply (>2% of stock underway) typically softens rents 12–24 months out; light construction supports rent growth.
Investment metrics
- 1% rule
- 0.73% ✗
- Cap rate
- 4.52%
- Cash-on-cash
- -6.35%
- DSCR
- 0.72
- GRM
- 11.4
CMA / ARV
- ARV (median comp)
- $688,530
- List price
- $369,900
- Delta
- -46.28%
- Verdict
- UNDERPRICED
- Comps
- 4 within 1.0 mi
Projected returns pro-forma
-3.0% appreciation · 3.0% rent growth · sell at horizon
- IRR
- -27.2%
- Equity multiple
- 0.09×
- Total profit
- $-94,721
- Equity at exit
- $55,153
- IRR
- -25.0%
- Equity multiple
- -0.23×
- Total profit
- $-126,950
- Equity at exit
- $31,982
Cash invested: $103,572 (down + closing). Projections, not guarantees.
Landlord ↔ Tenant lean methodology
- Overall (STATE)
- 87 Strongly Landlord-Friendly
- State Texas
- 87 Strongly Landlord-Friendly · R+5
- County
- — inherits STATE
- City
- — inherits STATE
ZIP-level market 78619
- Home prices YoY
- -20.0%
- Active inventory
- 141
- Price-to-rent
- 11.4×
Monthly cashflow live
- Estimated rent
- $2,694 medium interval (Pro) →
- Mortgage (P&I)
- −$1,940
- Tax est. 1.5%
- −$462 /mo · $5,548/yr
- Insurance
- −$154
- HOA
- −$120
- Vacancy / Maint / Mgmt
- −$566
- Net cashflow
- $-548
Break-even live
Sensitivity live
| Price | -10% $-292 | -5% $-420 | +0% $-548 | +5% $-676 | +10% $-804 |
|---|---|---|---|---|---|
| Rent | -10% $-761 | -5% $-654 | +0% $-548 | +5% $-441 | +10% $-335 |
| Rate | -1.0pp $-362 | -0.5pp $-454 | base $-548 | +0.5pp $-644 | +1.0pp $-741 |
UW: 25.0% down · 7.5% · 30yr · 1.5% tax · 5.0% vac · 8.0% maint · 8.0% mgmt
Financing live
Cash to close
- Down payment
- $92,475
- Closing costs
- $11,097
- Reserves months
- —
- Total cash needed
- —
Loan-product check · same deal, 3 products live
Conventional
25% down · 7.5% · 30yr
- Down + closing
- —
- Monthly P&I
- —
- Monthly cashflow
- —
- DSCR
- —
- Eligible?
- —
Personal DTI + credit; lowest rate.
DSCR
20% down · 8.5% · 30yr
- Down + closing
- —
- Monthly P&I
- —
- Monthly cashflow
- —
- DSCR
- —
- Eligible?
- —
No personal income docs; deal must DSCR.
Hard money
10% down · 12.0% · 12mo
- Down + closing
- —
- Monthly P&I
- —
- Monthly cashflow
- —
- DSCR
- —
- Eligible?
- —
Short-term bridge; refi at stabilization.
HOA detail
- Monthly dues
- $120 · $1,440/yr
Listing history 20 events
-
2026-06-21days on market $369,900 Active 46 DOM
-
2026-06-18days on market $369,900 Active 43 DOM
-
2026-06-17days on market $369,900 Active 42 DOM
-
2026-06-16days on market $369,900 Active 41 DOM
-
2026-06-15days on market $369,900 Active 40 DOM
-
2026-06-13days on market $369,900 Active 38 DOM
-
2026-06-13days on market $369,900 Active 37 DOM
-
2026-06-09days on market $369,900 Active 34 DOM
-
2026-06-08days on market $369,900 Active 33 DOM
-
2026-06-07days on market $369,900 Active 32 DOM
-
2026-06-04days on market $369,900 Active 29 DOM
-
2026-06-03pricedays on market $369,900 Active 28 DOM
-
2026-06-02days on market $379,900 Active 27 DOM
-
2026-06-01days on market $379,900 Active 26 DOM
-
2026-05-31days on market $379,900 Active 25 DOM
-
2025-12-17historical $2,295
-
2025-11-18price
-
2025-10-23Active
-
2025-09-13price $2,295
-
2025-09-02$2,495
ⓘ Source: listings_history table (triggers on properties + properties_extension) + one-shot
backfill from property_details.listing_events for pre-trigger history.
Climate risk First Street
- Flood 1/10 Low FEMA zone X (unshaded) · 0% chance over 30 yrs
- Wildfire 6/10 Major
- Heat 8/10 Severe 7 d/yr ≥107°F today · 23 d/yr by 30 yrs out
- Wind 7/10 Severe 78% chance of damaging wind over 30 yrs
- Air quality 2/10 Low 0 unhealthy d/yr today · 1 by 30 yrs out
Nearby sold comps map
Loading sold comps map…
Walkable amenities ~0.75 mi
Loading nearby amenities…
Taxation est. · year 1
- Rental income
- $32,330
- − Mortgage interest
- −$20,720
- − Property taxes
- −$5,548
- − Insurance
- −$1,850
- − Repairs & maintenance
- −$2,586
- − Management
- −$2,586
- − HOA
- −$1,440
- − Depreciation
- −$10,761
- Taxable loss
- −$13,162
- Est. tax savings @ 24.0%
- +$3,159
- After-tax cash flow
- $-3,416/yr
For passive investors: Depreciation is non-cash, so a rental often shows a tax loss while cash-flowing — sheltering income. Rental losses are passive: they offset passive income freely, and up to $25,000/yr can offset ordinary (W-2) income if you actively participate and your MAGI is under $100k (phasing out to $0 by $150k); unused losses carry forward. On sale, claimed depreciation is recaptured at up to 25%, and gains may owe capital-gains tax (a 1031 exchange can defer both). Figures are a year-1 estimate at your 24.0% rate — not tax advice; consult a CPA.
Condition & rehab AI · 12 photos
This charming home in Heatherwood Cottage is in good condition with modern updates and a good curb appeal. It's move-in ready with minor maintenance needed.
Value-add opportunities
- Both landscaping — enhances curb appeal and adds value
- Both interior paint — fresh paint improves aesthetics and value
- Both landscaping and curb appeal — enhances curb appeal and adds value
Renovation cost estimate screening
Value-add ROI direction
- Both landscaping — enhances curb appeal and adds value ↑
- Both interior paint — fresh paint improves aesthetics and value ↑
- Both landscaping and curb appeal — enhances curb appeal and adds value ↑
ⓘ Cost ranges are severity-bucket heuristics (US national rule-of-thumb). Get contractor quotes + a written scope before underwriting a rehab budget.
Schools (NCES district)
- District
- Dripping Springs ISD
- NCES district ID
- 4800008
- Math proficiency
- 55% ▼ -8.00%
- Reading proficiency
- 61% ▼ -6.00%
- Median HH income
- $103,367
- Composite
- 54.5/100
- National rank
- #1347
- State rank
- #41 of 826 in TX
Livability — Dripping Springs
- Score
- 75/100
- State rank
- #149
- US rank
- #4158
Category grades
Schools grade is shown separately in the Schools card above.
Census & demographics
- City population
- 22,860
- Population (ZIP)
- 6,896
Population outlook (Hays County) Hauer SSP2
- Today (2025)
- 286,948 people
- By 2030
- 336,923 · +17.4%
- By 2040
- 441,894 · +54.0%
- By 2050
- 553,462 · +92.9%
- By 2075
- 838,261 · +192.1%
- By 2100
- 1,063,658 · +270.7%
Race, ethnicity, and origin ACS 2023
- Neighborhood character
- Predominantly White (87%)
- Race & ethnicity
- White 87% Hispanic / Latino 11% Two or more races 6% Native American 1%
- Hispanic origin (detail)
- Mexican 7%
- Common ancestry
- Portuguese 5% Serbian 3% Italian 2%
- Foreign-born
- 6% · Canada, Jamaica
- Languages at home
- 90% English-only · Spanish 9% Russian/Polish/Slavic 1%
Political lean MEDSL · Hays
- 2024 margin
- Lean D (+5.7) · D 52.1% · R 46.5% · Other 1.4%
- 2008→2024 swing
- +7.7pp toward D · 2008: -2.0pp · 2024: 5.7pp
- All cycles
- 2024: D+5.7 2020: D+10.8 2016: R+0.9 2012: R+10.4 2008: R+2.0
Not yet ingested
- Civics
- —
Market trends
- HPI YoY
- ▼ -61.79%
- Current HPI
- 246.6679
- Rent YoY
- —
- Metro
- —
- State GDP YoY
- ▲ 3.95%
- F500 in state
- 110
Industry mix (Fortune 500 HQ in TX)
| Industry | F500 HQs | Revenue |
|---|---|---|
| Energy | 16 | $1,198B |
|
||
| Technology | 5 | $198B |
|
||
| Engineering / Construction | 4 | $72B |
|
||
| Energy Services | 3 | $60B |
|
||
| Utilities | 3 | $41B |
|
||
| Healthcare | 2 | $330B |
|
||
Price history
+14725.7% since first listed6 events — show timeline
- 2026-06-02 Price Changed $369,900 Unlock MLS
- 2025-12-17 Rental Removed $2,295 ACTRIS
- 2025-11-18 Price Changed — Unlock MLS
- 2025-10-23 Listed — Unlock MLS
- 2025-09-13 Price Changed $2,295 ACTRIS
- 2025-09-02 Listed for Rent $2,495 ACTRIS
Cash-flow waterfall
monthlySold comps — $/sqft
last 12 mo · ≤1 miLoading sold comps…