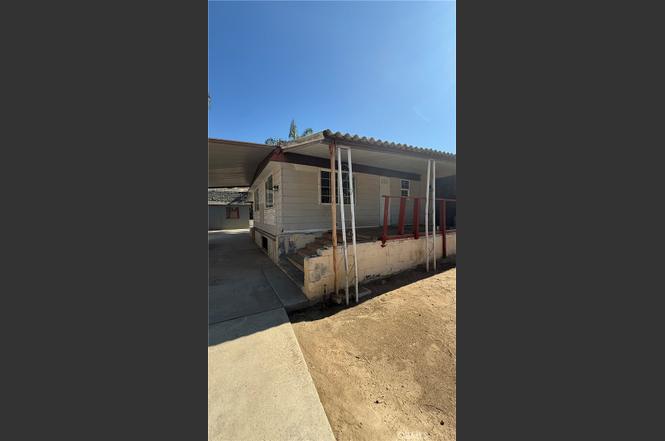
32118 Ranch · Homeland, CA
Flood risk 1/10 · Minimal
- FEMA flood zone
- X (unshaded)
- Chance of flooding over 30 yrs
- 0.0%
- Est. flood insurance / yr
- $507 – $1,088
Fire risk 8/10 · Major
- Est. fire insurance / yr
- $659 – $1,223
Heat risk 7/10 · Major
- Hot days now (above 103°F)
- 7 days/yr
- Hot days in 30 yrs
- 20 days/yr
Wind risk 1/10 · Minimal
- Chance of severe wind over 30 yrs
- —
Air-quality risk 6/10 · Moderate
- Unhealthy air days now
- 10 days/yr
- Unhealthy air days in 30 yrs
- 14 days/yr
Risk factors via First Street. Map © Google.
Why this score? — see what drove the C+ grade
The composite is a weighted blend of 9 inputs, each scored 0–100. Each bar is that input's sub-score; the figure is the points it added to the 100-point composite (weight × sub-score).
- Cash flow +21.0/30.0
- Appreciation +10.0/10.0
- ARV discount +8.4/15.0
- DSCR +6.7/10.0
- 1% rule +5.5/10.0
- Schools +3.7/10.0
- Rent growth +2.5/5.0
- Condition / age +2.5/5.0
- Livability +2.2/5.0
$220,000
🖨 Deal sheet 📄 Offer letter ✓ Due diligence
Listing remarks MLS
Nice manufactured home on a permanent foundation. This home features 3 bedrooms 2 baths and family room. Upgraded kitchen with nice cabinets and granite countertops. Updated bathrooms and dual pane windows throughout. Crown Molding, new carpet, and new AC unit. Property is on a large 10,019 Sq Ft. lot. with RV Parking and electrical hookups. This property is a must see. , Owner is very motivated to sell.
Key facts
- Adu potential
- Dutch barn
- Rental ready
Tags
Property features AI
Finance
- Financial info: Assessments: unknown
Exterior
- Parking: 2 garage spaces; 2 total parking spaces
- Utilities: Public/District water; Septic system (type unknown)
- Home design: Single-story; Entry on main level
- Construction: Year built: see remarks; No ADU
- Exterior features: Manufactured house; No pool; Lot appears to be 0–1 unit/acre; Mountainous community setting
Interior
- Bedrooms: Three bedrooms on the main level
- Bathrooms: Two full bathrooms
- Heating & cooling: Central furnace heating; Cooling available (see remarks)
- Interior features: One-level home; Main level entry; No common walls; Living area per assessor's data
- Laundry & utility: Laundry available (see remarks)
Neighborhood map
What this means for you Summary
Snapshot
- This is a 2-bed/2.0-bath manufactured listed at $220k.
Deal economics
- At list price, monthly cash flow is $309 ($4k/yr) — positive.
- The deal already cash-flows at list — no discount required.
- Meets the 1% rule at list price ($2k rent vs $220k).
- Cap rate 8.0% vs local median 5.9% in Homeland — top-decile yield for the area; either an underpriced asset or a hidden risk that comps aren't pricing in. Stress-test before assuming the spread holds.
Location & tenants
- Location reads 45/100 on livability (#1,297 in CA) — a working-class tenant base; expect higher turnover. Strengths: housing A+; Watch: cost of living C-, health & safety C-, employment D.
- Romoland Elementary (suburban): math 35% / reading 44% proficiency, ranked #699 of 1,400 in CA (top 50%) — families likely to look elsewhere, expect single-tenant / working-renter base with shorter leases.
- Market conditions: 53 active listings in the ZIP; 1 comparable units currently listed for rent nearby; 9,195 units permitted in Riverside County in 2024 (1,512 in 5+ unit buildings).
Forward outlook
- In year one you build about $24k of equity ($2k loan paydown + $22k appreciation (10.0% local appreciation)).
- Riverside County population projected at +22% by 2050 — long-run rental-demand tailwind backs the buy-and-hold thesis.
- At projected returns (10.0% appreciation + 3.0% rent growth), your $62k cash investment doubles in ~3 years — after that, you're playing with house money.
- By year 2, paydown + projected appreciation supports a ~$38k cash-out refi (75% LTV) — recoverable capital for the next deal without selling this one.
Negotiation context
- Only 3 days on market — expect competitive offers; lowballing is unlikely to land.
- 7 sale attempts since 20y ago with the ask held roughly flat each time — persistent listings suggest the price (not the market) is what's stuck; bring a comps-based counter.
Risks & watch-outs
- Climate carrying-cost: severe wildfire risk; extreme-heat days projected 7→20/yr by 2055 (HVAC capex compounding) — expect insurance premiums to compound above CPI over the hold.
Questions for the listing agent
- Built in 1973 — when were the roof, HVAC, electrical panel, plumbing, and water heater last replaced?
- Is there a deadline driving the sale (1031 exchange, divorce, estate, relocation)? That informs how much negotiation room exists.
- Schools are F-rated, which usually means shorter tenancies and higher turnover. Who's the typical renter profile here, and what's been the actual vacancy rate?
- Crime grade is F in this area — have there been break-ins, vandalism, or insurance claims at this property in the last 3 years? What carrier currently insures it and at what premium?
- What's the average days-on-market for RENTAL listings here right now (not sales)? A rising rental-DOM trend means longer vacancies and softer asking-rent achievability than the comps imply.
- What's the recent tenant-quality profile in this submarket — average credit score on applications, eviction rate, late-payment / NSF rate, and stable-employment percentage? A property-management company in the area should have these aggregated.
- How much new for-sale + rental construction is in the pipeline within 1–3 miles? Heavy new supply typically softens prices + rents 12–24 months out; constrained supply supports both.
Investment metrics
- 1% rule
- 1.05% ✓
- Cap rate
- 7.98%
- Cash-on-cash
- 6.02%
- DSCR
- 1.27
- GRM
- 8.0
CMA / ARV
- ARV (on-the-fly)
- $224,640
- Comps found
- 10
Show comp detail 10 sales within ~0.75 mi
| Address | Dist | Beds/Ba | Sqft | Sold | Price | $/sf | Match |
|---|---|---|---|---|---|---|---|
| 25490 Granite Valley Trl | 0.27mi | 3/2.0 (+1) | 1,344 (-7%) | 10mo | $465,000 | $346 | 63 |
| 25952 Homeland Ave | 0.72mi | 2/2.0 | 1,440 (0%) | 9mo | $225,000 | $156 | 58 |
| 26157 Olson Ave | 0.49mi | 2/2.0 | 1,344 (-7%) | 10mo | $400,000 | $298 | 58 |
| 25778 Creag Ave | 0.37mi | 3/2.0 (+1) | 1,248 (-13%) | 2mo | $415,000 | $333 | 54 |
| 26189 Olson Ave | 0.51mi | 2/2.0 | 1,248 (-13%) | 10mo | $275,000 | $220 | 46 |
| 32600 State Highway 74 #42 | 0.65mi | 2/2.0 | 1,400 (-3%) | 24mo | $48,000 | $34 | 46 |
| 32600 Highway 74 #93 | 0.65mi | 3/2.0 (+1) | 1,333 (-7%) | 9mo | $118,500 | $89 | 45 |
| 32600 State Highway 74 #35 | 0.67mi | 2/2.0 | 1,246 (-14%) | 4mo | $62,000 | $50 | 43 |
| 32600 State Highway 74 #122 | 0.67mi | 3/2.0 (+1) | 1,344 (-7%) | 14mo | $149,900 | $112 | 41 |
| 31510 Wakefield Ave | 0.68mi | 2/2.0 | 1,640 (+14%) | 21mo | $250,000 | $152 | 28 |
Match score weights: distance 35% · size 25% · config 20% · recency 20%. Top-matched comps best support the ARV.
Projected returns pro-forma
10.0% appreciation · 3.0% rent growth · sell at horizon
- IRR
- 28.7%
- Equity multiple
- 3.27×
- Total profit
- $139,536
- Equity at exit
- $198,193
- IRR
- 24.9%
- Equity multiple
- 7.42×
- Total profit
- $395,478
- Equity at exit
- $427,412
Cash invested: $61,600 (down + closing). Projections, not guarantees.
Landlord ↔ Tenant lean methodology
- Overall (STATE)
- 18 Strongly Tenant-Friendly
- State California
- 18 Strongly Tenant-Friendly · D+13
- County
- — inherits STATE
- City
- — inherits STATE
ZIP-level market 92548
- Home prices YoY
- 16.7%
- Active inventory
- 53
- Price-to-rent
- 8.0×
Monthly cashflow live
- Estimated rent
- $2,300 medium interval (Pro) →
- Mortgage (P&I)
- −$1,154
- Tax from tax record
- −$262 /mo · $3,150/yr
- Insurance
- −$92
- HOA
- −$0
- Vacancy / Maint / Mgmt
- −$483
- Net cashflow
- $309
Break-even live
UW: 25.0% down · 7.5% · 30yr · 1.5% tax · 5.0% vac · 8.0% maint · 8.0% mgmt
Financing live
Cash to close
- Down payment
- $55,000
- Closing costs
- $6,600
- Reserves months
- —
- Total cash needed
- —
Loan-product check · same deal, 3 products live
Conventional
25% down · 7.5% · 30yr
- Down + closing
- —
- Monthly P&I
- —
- Monthly cashflow
- —
- DSCR
- —
- Eligible?
- —
Personal DTI + credit; lowest rate.
DSCR
20% down · 8.5% · 30yr
- Down + closing
- —
- Monthly P&I
- —
- Monthly cashflow
- —
- DSCR
- —
- Eligible?
- —
No personal income docs; deal must DSCR.
Hard money
10% down · 12.0% · 12mo
- Down + closing
- —
- Monthly P&I
- —
- Monthly cashflow
- —
- DSCR
- —
- Eligible?
- —
Short-term bridge; refi at stabilization.
Rent comps 1 comps
| Address | Beds | Baths | Sqft | Rent | $/sqft | DOM | Units | Dist |
|---|---|---|---|---|---|---|---|---|
| 33099 Old State Hwy Hemet, CA | 3.0 | 2.0 | 1440 | $2,300 | $1.60 | 1d | 1 | 1.13mi |
Listing history 4 events
-
2026-06-18days on market $220,000 Active 3 DOM
-
2026-06-17days on market $220,000 Active 2 DOM
-
2026-06-15remarks 699-char remark
-
2026-06-15$220,000 Active 1 DOM
ⓘ Source: listings_history table (triggers on properties + properties_extension) + one-shot
backfill from property_details.listing_events for pre-trigger history.
Tax reassessment forecast CA · Resets to sale price
- Current annual tax
- $3,150 · $262/mo
- Projected year-2 tax
- $3,150 · $262/mo
- Expected delta
- $0/yr ($0/mo · 0.0%)
ⓘ Screening estimate from a state-policy table — verify with the county assessor before closing.
Climate risk First Street
- Flood 1/10 Low FEMA zone X (unshaded) · 0% chance over 30 yrs
- Wildfire 8/10 Severe
- Heat 7/10 Severe 7 d/yr ≥103°F today · 20 d/yr by 30 yrs out
- Wind 1/10 Low
- Air quality 6/10 Major 10 unhealthy d/yr today · 14 by 30 yrs out
Nearby sold comps map
Loading sold comps map…
Walkable amenities ~0.75 mi
Loading nearby amenities…
Taxation est. · year 1
- Rental income
- $27,600
- − Mortgage interest
- −$12,323
- − Property taxes
- −$3,150
- − Insurance
- −$1,100
- − Repairs & maintenance
- −$2,208
- − Management
- −$2,208
- − Depreciation
- −$6,400
- Taxable income
- $211
- Est. tax owed @ 24.0%
- −$51
- After-tax cash flow
- $3,659/yr
For passive investors: Depreciation is non-cash, so a rental often shows a tax loss while cash-flowing — sheltering income. Rental losses are passive: they offset passive income freely, and up to $25,000/yr can offset ordinary (W-2) income if you actively participate and your MAGI is under $100k (phasing out to $0 by $150k); unused losses carry forward. On sale, claimed depreciation is recaptured at up to 25%, and gains may owe capital-gains tax (a 1031 exchange can defer both). Figures are a year-1 estimate at your 24.0% rate — not tax advice; consult a CPA.
Schools (NCES district)
- District
- Romoland Elementary
- NCES district ID
- 0633390
- Math proficiency
- 35% ▲ 2.00%
- Reading proficiency
- 44% ▲ 1.00%
- Median HH income
- $58,935
- Composite
- 37.36/100
- National rank
- #8931
- State rank
- #699 of 1400 in CA
Livability — Homeland
- Score
- 45/100
- State rank
- #1297
- US rank
- #26584
Category grades
Schools grade is shown separately in the Schools card above.
Census & demographics
- Census place
- Homeland, CA
- Population (ZIP)
- 6,435
Population outlook (Riverside County) Hauer SSP2
- Today (2025)
- 2,664,475 people
- By 2030
- 2,802,692 · +5.2%
- By 2040
- 3,050,904 · +14.5%
- By 2050
- 3,256,783 · +22.2%
- By 2075
- 3,655,058 · +37.2%
- By 2100
- 3,766,594 · +41.4%
Race, ethnicity, and origin ACS 2023
- Neighborhood character
- Predominantly Hispanic (65%)
- Race & ethnicity
- Hispanic / Latino 65% White 30% Two or more races 9% Native American 3% Asian 3%
- Hispanic origin (detail)
- Mexican 59% Puerto Rican 2%
- Common ancestry
- Italian 2% Lithuanian 1% Serbian 1%
- Foreign-born
- 20% · Canada, South Korea
- Languages at home
- 54% English-only · Spanish 44% Korean 1% Vietnamese 1%
Political lean MEDSL · Riverside
- 2024 margin
- Toss-up / Even · D 48.0% · R 49.3% · Other 2.6%
- 2008→2024 swing
- -3.6pp toward R · 2008: 2.3pp · 2024: -1.3pp
- All cycles
- 2024: R+1.3 2020: D+8.0 2016: D+4.3 2012: R+0.4 2008: D+2.3
Not yet ingested
- Civics
- —
Market trends
- HPI YoY
- ▲ 62.36%
- Current HPI
- 435.0222
- Rent YoY
- —
- Metro
- —
- State GDP YoY
- ▲ 3.21%
- F500 in state
- 116
Industry mix (Fortune 500 HQ in CA)
| Industry | F500 HQs | Revenue |
|---|---|---|
| Technology | 27 | $1,492B |
|
||
| Financial Services | 3 | $174B |
|
||
| Retail | 3 | $44B |
|
||
| Insurance | 3 | $26B |
|
||
| Media / Entertainment | 2 | $115B |
|
||
| Pharmaceuticals / Biotech | 2 | $62B |
|
||
Price history
+780.0% since first listed17 events — show timeline
- 2026-06-15 Listed $220,000 CRMLS
- 2019-07-23 Sold (Public Records) $205,000 Public Records
- 2019-07-23 Sold (MLS) $205,000 CRMLS
- 2019-07-10 Pending — CRMLS
- 2019-06-27 Listed $205,000 CRMLS
- 2016-10-01 Listing Removed — CRMLS
- 2016-09-19 Relisted — CRMLS
- 2016-06-06 Pending — CRMLS
- 2016-05-19 Listed $200,000 CRMLS
- 2007-10-04 Listing Removed — CRMLS
- 2007-09-06 Listed $199,900 CRMLS
- 2007-08-28 Listing Removed — CRMLS
- 2007-07-08 Listed $199,900 CRMLS
- 2006-09-12 Listing Removed — CRMLS
- 2006-08-01 Listed $175,000 CRMLS
- 2005-03-31 Sold (Public Records) $132,000 Public Records
- 1988-05-16 Sold (Public Records) $25,000 Public Records
Property tax history
+5.4%/yrLatest (2025): $3,150 · +2.7% YoY. Source: county tax records.
Cash-flow waterfall
monthlySold comps — $/sqft
last 12 mo · ≤1 miLoading sold comps…