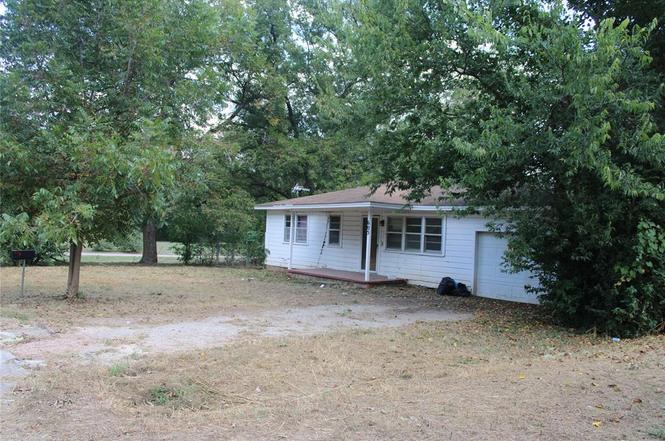
605 E Jennings St · Wynnewood, OK
Flood risk 1/10 · Minimal
- FEMA flood zone
- X (unshaded)
- Chance of flooding over 30 yrs
- 0.0%
- Est. flood insurance / yr
- $507 – $1,088
Fire risk 5/10 · Moderate
- Est. fire insurance / yr
- $2,463 – $4,575
Heat risk 6/10 · Moderate
- Hot days now (above 109°F)
- 7 days/yr
- Hot days in 30 yrs
- 19 days/yr
Wind risk 4/10 · Minor
- Chance of severe wind over 30 yrs
- 9.0%
Air-quality risk 2/10 · Minimal
- Unhealthy air days now
- 0 days/yr
- Unhealthy air days in 30 yrs
- 1 days/yr
Risk factors via First Street. Map © Google.
Why this score? — see what drove the B grade
The composite is a weighted blend of 9 inputs, each scored 0–100. Each bar is that input's sub-score; the figure is the points it added to the 100-point composite (weight × sub-score).
- Cash flow +30.0/30.0
- 1% rule +10.0/10.0
- DSCR +10.0/10.0
- Appreciation +8.9/10.0
- ARV discount +3.4/15.0
- Livability +3.1/5.0
- Rent growth +2.5/5.0
- Condition / age +2.5/5.0
- Schools +1.5/10.0
$47,000
🖨 Deal sheet 📄 Offer letter ✓ Due diligence
Listing remarks MLS
ATTENTION INVESTORS!! GREAT FOR RENTAL OR FLIP! You'll love the yard!! Huge pecan trees, large lot that includes the barn/shop in back & all the way to Howell St. on east. Fenced backyard PLUS neat 3 bedroom 1 bath home with hardwood floors, tiled kitchen counter, smooth top cook stove, separate oven, 1 car attached garage which has washer/dryer hook up in it. Central AC unit is newer gas central heat, walking distance to schools/stores, Corner LOT. Just needs some TLC to make it a nice home!!
Key facts
- 0.36 acre lot
- Garage
- Built 1960
Property features AI
Finance
- Other: Vacant and not occupied; Located in Wynnewood City addition; Living area recorded at 936 (assessor source); No home warranty indicated; Price was reduced previously
- Financial info: Sold as-is; cash offers accepted; Not assumable
- HOA & community: No mandatory association dues
Exterior
- Parking: 1-car garage
- Home design: Single family residence; One story; Property faces north; Existing property
- Construction: Frame construction; Composition roof; Combination foundation; Built previously (existing property)
- Exterior features: Outbuildings; Corner lot; Flood insurance required
Interior
- Bedrooms: 3 bedrooms
- Bathrooms: 1 full bathroom
- Interior features: No fireplace; No in-law plan indicated; One living area; One dining area
Neighborhood map
What this means for you Summary
Snapshot
- This is a 2-bed/1.0-bath single-family listed at $47k.
Deal economics
- At list price, monthly cash flow is $371 ($4k/yr) — positive.
- The deal already cash-flows at list — no discount required.
- Meets the 1% rule at list price ($870 rent vs $47k).
- Recommended offer: $41k (12.0% below list) — sets the bar for market timing.
- Cap rate 15.8% vs local median 5.9% in Wynnewood — top-decile yield for the area; either an underpriced asset or a hidden risk that comps aren't pricing in. Stress-test before assuming the spread holds.
Location & tenants
- Location reads 62/100 on livability (#253 in OK) — a middle-class / working-renter tenant base. Strengths: cost of living A+, housing A+; Watch: employment D, amenities F, commute F.
- Wynnewood (rural): math 13% / reading 22% proficiency, ranked #198 of 270 in OK (top 73%) — low school quality limits family demand, transient renter base, plan for 1-2y turnover.
- Zoned schools: Central Es (math 17% / reading 27%, grade F, #413 of 845 statewide, top 54%, 277 students, 0% FRL); Wynnewood Hs (math 5% / reading 24%, grade F, #332 of 447 statewide, top 78%, 210 students, 0% FRL) — zoned schools average 0% FRL vs 51% district-wide (51 pts lower); this property's tenant base skews higher-income than the district average.
- Market conditions: 55 active listings in the ZIP; 1 units permitted in Garvin County in 2024 (0 in 5+ unit buildings).
Forward outlook
- In year one you build about $4k of equity ($325 loan paydown + $4k appreciation (7.9% local appreciation)).
- Garvin County population projected at +8% by 2050 — modest demand growth; plan on rents tracking national, not racing it.
- At projected returns (7.9% appreciation + 3.0% rent growth), your $13k cash investment doubles in ~2 years — after that, you're playing with house money.
- By year 8, paydown + projected appreciation supports a ~$33k cash-out refi (75% LTV) — recoverable capital for the next deal without selling this one.
Negotiation context
- It's been on market 222 days — a 12% lower offer ($41k) is reasonable based on typical stale-listing flexibility.
- 2 sale attempts since 5y ago; this cycle's ask has dropped $11k (19%) from the opening price — seller is motivated, your offer sets the floor, not the list.
Risks & watch-outs
- Climate carrying-cost: moderate wildfire risk; extreme-heat days projected 7→19/yr by 2055 (HVAC capex compounding) — expect insurance premiums to compound above CPI over the hold.
Questions for the listing agent
- It's been on market 222 days. Have you received any prior offers? Is the seller open to a 12% concession, seller financing, or rate buy-down credit?
- Built in 1960 — when were the roof, HVAC, electrical panel, plumbing, and water heater last replaced?
- Why hasn't it sold? Are there any deal-killer items the seller is aware of (foundation, flood, title, zoning, code violations)?
- Is there a deadline driving the sale (1031 exchange, divorce, estate, relocation)? That informs how much negotiation room exists.
- Schools are F-rated, which usually means shorter tenancies and higher turnover. Who's the typical renter profile here, and what's been the actual vacancy rate?
- What's the average days-on-market for RENTAL listings here right now (not sales)? A rising rental-DOM trend means longer vacancies and softer asking-rent achievability than the comps imply.
- What's the recent tenant-quality profile in this submarket — average credit score on applications, eviction rate, late-payment / NSF rate, and stable-employment percentage? A property-management company in the area should have these aggregated.
- How much new for-sale + rental construction is in the pipeline within 1–3 miles? Heavy new supply typically softens prices + rents 12–24 months out; constrained supply supports both.
Investment metrics
- 1% rule
- 1.85% ✓
- Cap rate
- 15.76%
- Cash-on-cash
- 33.80%
- DSCR
- 2.50
- GRM
- 4.5
CMA / ARV
- ARV (on-the-fly)
- $43,056
- Comps found
- 3
Show comp detail 3 sales within ~0.75 mi
| Address | Dist | Beds/Ba | Sqft | Sold | Price | $/sf | Match |
|---|---|---|---|---|---|---|---|
| 607 E Colbert Dr | 0.05mi | 2/2.0 | 912 (-3%) | 22mo | $130,000 | $143 | 71 |
| 1006 E Chickasaw | 0.39mi | 2/1.0 | 981 (+5%) | 8mo | $43,000 | $44 | 67 |
| 201 E Lawrence St | 0.50mi | 1/1.0 (-1) | 984 (+5%) | 24mo | $45,000 | $46 | 43 |
Match score weights: distance 35% · size 25% · config 20% · recency 20%. Top-matched comps best support the ARV.
Projected returns pro-forma
7.9% appreciation · 3.0% rent growth · sell at horizon
- IRR
- 47.1%
- Equity multiple
- 4.24×
- Total profit
- $42,673
- Equity at exit
- $35,385
- IRR
- 42.4%
- Equity multiple
- 9.08×
- Total profit
- $106,280
- Equity at exit
- $69,933
Cash invested: $13,160 (down + closing). Projections, not guarantees.
Landlord ↔ Tenant lean methodology
- Overall (STATE)
- 83 Strongly Landlord-Friendly
- State Oklahoma
- 83 Strongly Landlord-Friendly · R+20
- County
- — inherits STATE
- City
- — inherits STATE
ZIP-level market 73098
- Home prices YoY
- 2.9%
- Active inventory
- 55
- Price-to-rent
- 4.5×
Monthly cashflow live
- Estimated rent
- $870 medium interval (Pro) →
- Mortgage (P&I)
- −$246
- Tax from tax record
- −$51 /mo · $607/yr
- Insurance
- −$20
- HOA
- −$0
- Vacancy / Maint / Mgmt
- −$183
- Net cashflow
- $371
Break-even live
UW: 25.0% down · 7.5% · 30yr · 1.5% tax · 5.0% vac · 8.0% maint · 8.0% mgmt
Financing live
Cash to close
- Down payment
- $11,750
- Closing costs
- $1,410
- Reserves months
- —
- Total cash needed
- —
Loan-product check · same deal, 3 products live
Conventional
25% down · 7.5% · 30yr
- Down + closing
- —
- Monthly P&I
- —
- Monthly cashflow
- —
- DSCR
- —
- Eligible?
- —
Personal DTI + credit; lowest rate.
DSCR
20% down · 8.5% · 30yr
- Down + closing
- —
- Monthly P&I
- —
- Monthly cashflow
- —
- DSCR
- —
- Eligible?
- —
No personal income docs; deal must DSCR.
Hard money
10% down · 12.0% · 12mo
- Down + closing
- —
- Monthly P&I
- —
- Monthly cashflow
- —
- DSCR
- —
- Eligible?
- —
Short-term bridge; refi at stabilization.
Listing history 8 events
-
2026-03-25price $47,000
-
2026-02-25price $57,000
-
2025-10-16$58,000 Active
-
2022-10-20soldstatus $55,000 Closed 504-char remark
Show marketing remark (504 chars)
ATTENTION INVESTORS!! GREAT FOR RENTAL OR FLIP! You'll love the yard!! Huge pecan trees, large lot that includes the barn/shop in back & all the way to Howell St. on east. Fenced backyard PLUS neat 3 bedroom 1 bath home with hardwood floors, tiled kitchen counter, smooth top cook stove, separate oven, 1 car attached garage which has washer/dryer hook up in it. Central AC unit is newer gas central heat, walking distance to schools/stores, Corner LOT. Just needs some TLC to make it a nice home!!
-
2022-10-20soldstatus $55,000
Show marketing remark (504 chars)
ATTENTION INVESTORS!! GREAT FOR RENTAL OR FLIP! You'll love the yard!! Huge pecan trees, large lot that includes the barn/shop in back & all the way to Howell St. on east. Fenced backyard PLUS neat 3 bedroom 1 bath home with hardwood floors, tiled kitchen counter, smooth top cook stove, separate oven, 1 car attached garage which has washer/dryer hook up in it. Central AC unit is newer gas central heat, walking distance to schools/stores, Corner LOT. Just needs some TLC to make it a nice home!!
-
2022-10-03status Pending 504-char remark
Show marketing remark (504 chars)
ATTENTION INVESTORS!! GREAT FOR RENTAL OR FLIP! You'll love the yard!! Huge pecan trees, large lot that includes the barn/shop in back & all the way to Howell St. on east. Fenced backyard PLUS neat 3 bedroom 1 bath home with hardwood floors, tiled kitchen counter, smooth top cook stove, separate oven, 1 car attached garage which has washer/dryer hook up in it. Central AC unit is newer gas central heat, walking distance to schools/stores, Corner LOT. Just needs some TLC to make it a nice home!!
-
2022-06-17price $59,500 504-char remark
Show marketing remark (504 chars)
ATTENTION INVESTORS!! GREAT FOR RENTAL OR FLIP! You'll love the yard!! Huge pecan trees, large lot that includes the barn/shop in back & all the way to Howell St. on east. Fenced backyard PLUS neat 3 bedroom 1 bath home with hardwood floors, tiled kitchen counter, smooth top cook stove, separate oven, 1 car attached garage which has washer/dryer hook up in it. Central AC unit is newer gas central heat, walking distance to schools/stores, Corner LOT. Just needs some TLC to make it a nice home!!
-
2021-09-03$62,500 Active 504-char remark
Show marketing remark (504 chars)
ATTENTION INVESTORS!! GREAT FOR RENTAL OR FLIP! You'll love the yard!! Huge pecan trees, large lot that includes the barn/shop in back & all the way to Howell St. on east. Fenced backyard PLUS neat 3 bedroom 1 bath home with hardwood floors, tiled kitchen counter, smooth top cook stove, separate oven, 1 car attached garage which has washer/dryer hook up in it. Central AC unit is newer gas central heat, walking distance to schools/stores, Corner LOT. Just needs some TLC to make it a nice home!!
ⓘ Source: listings_history table (triggers on properties + properties_extension) + one-shot
backfill from property_details.listing_events for pre-trigger history.
Tax reassessment forecast OK · Resets to sale price
- Current annual tax
- $607 · $51/mo
- Projected year-2 tax
- $607 · $51/mo
- Expected delta
- $0/yr ($0/mo · 0.0%)
ⓘ Screening estimate from a state-policy table — verify with the county assessor before closing.
Climate risk First Street
- Flood 1/10 Low FEMA zone X (unshaded) · 0% chance over 30 yrs
- Wildfire 5/10 Major
- Heat 6/10 Major 7 d/yr ≥109°F today · 19 d/yr by 30 yrs out
- Wind 4/10 Moderate 9% chance of damaging wind over 30 yrs
- Air quality 2/10 Low 0 unhealthy d/yr today · 1 by 30 yrs out
Nearby sold comps map
Loading sold comps map…
Walkable amenities ~0.75 mi
Loading nearby amenities…
Taxation est. · year 1
- Rental income
- $10,440
- − Mortgage interest
- −$2,633
- − Property taxes
- −$607
- − Insurance
- −$235
- − Repairs & maintenance
- −$835
- − Management
- −$835
- − Depreciation
- −$1,367
- Taxable income
- $3,927
- Est. tax owed @ 24.0%
- −$943
- After-tax cash flow
- $3,505/yr
For passive investors: Depreciation is non-cash, so a rental often shows a tax loss while cash-flowing — sheltering income. Rental losses are passive: they offset passive income freely, and up to $25,000/yr can offset ordinary (W-2) income if you actively participate and your MAGI is under $100k (phasing out to $0 by $150k); unused losses carry forward. On sale, claimed depreciation is recaptured at up to 25%, and gains may owe capital-gains tax (a 1031 exchange can defer both). Figures are a year-1 estimate at your 24.0% rate — not tax advice; consult a CPA.
Schools (NCES district)
- District
- Wynnewood
- NCES district ID
- 4033300
- Math proficiency
- 13% ▼ -7.00%
- Reading proficiency
- 22% ▼ -2.00%
- Median HH income
- $42,075
- Composite
- 15.05/100
- National rank
- #9352
- State rank
- #198 of 270 in OK
Livability — Wynnewood
- Score
- 62/100
- State rank
- #253
- US rank
- #16754
Category grades
Schools grade is shown separately in the Schools card above.
Census & demographics
- Census place
- Wynnewood, OK
- Population (ZIP)
- 3,382
Population outlook (Garvin County) Hauer SSP2
- Today (2025)
- 28,277 people
- By 2030
- 28,619 · +1.2%
- By 2040
- 29,478 · +4.2%
- By 2050
- 30,384 · +7.5%
- By 2075
- 34,074 · +20.5%
- By 2100
- 36,099 · +27.7%
Race, ethnicity, and origin ACS 2023
- Neighborhood character
- Predominantly White (74%)
- Race & ethnicity
- White 74% Two or more races 14% Hispanic / Latino 9% Native American 3% Black 2%
- Hispanic origin (detail)
- Mexican 8%
- Common ancestry
- Slovak 3% European 3% Serbian 2%
- Foreign-born
- 4% · Canada
- Languages at home
- 96% English-only · Spanish 3% German/W. Germanic 1%
Political lean MEDSL · Garvin
- 2024 margin
- Solid R (+66.1) · D 16.4% · R 82.5% · Other 1.1%
- 2008→2024 swing
- -22.5pp toward R · 2008: -43.6pp · 2024: -66.1pp
- All cycles
- 2024: R+66.1 2020: R+64.2 2016: R+60.7 2012: R+46.1 2008: R+43.6
Not yet ingested
- Civics
- —
Market trends
- HPI YoY
- ▲ 7.90%
- Current HPI
- 280.5166
- Rent YoY
- —
- Metro
- —
- State GDP YoY
- ▲ 1.55%
- F500 in state
- 6
Industry mix (Fortune 500 HQ in OK)
| Industry | F500 HQs | Revenue |
|---|---|---|
| Energy | 3 | $48B |
|
||
Price history
-24.8% since first listed8 events — show timeline
- 2026-03-25 Price Changed $47,000 MLSOK
- 2026-02-25 Price Changed $57,000 MLSOK
- 2025-10-16 Listed $58,000 MLSOK
- 2022-10-20 Sold (Public Records) $55,000 Public Records
- 2022-10-20 Sold (MLS) $55,000 MLSOK
- 2022-10-03 Pending — MLSOK
- 2022-06-17 Price Changed $59,500 MLSOK
- 2021-09-03 Listed $62,500 MLSOK
Property tax history
+12.0%/yrLatest (2025): $607 · +13.0% YoY. Source: county tax records.
Cash-flow waterfall
monthlySold comps — $/sqft
last 12 mo · ≤1 miLoading sold comps…