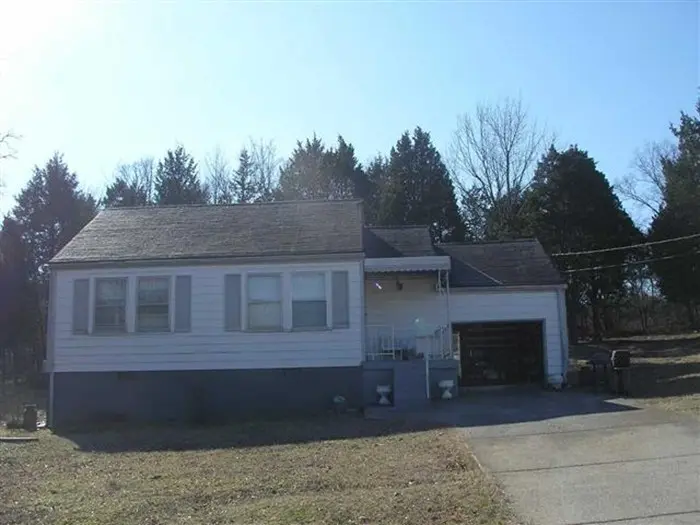
150 Fisk Dr · La Vergne, TN
Flood risk 1/10 · Minimal
- FEMA flood zone
- X (unshaded)
- Chance of flooding over 30 yrs
- 0.0%
- Est. flood insurance / yr
- $507 – $1,088
Fire risk 1/10 · Minimal
- Est. fire insurance / yr
- $949 – $1,763
Heat risk 5/10 · Moderate
- Hot days now (above 106°F)
- 7 days/yr
- Hot days in 30 yrs
- 19 days/yr
Wind risk 4/10 · Minor
- Chance of severe wind over 30 yrs
- 9.0%
Air-quality risk 2/10 · Minimal
- Unhealthy air days now
- 0 days/yr
- Unhealthy air days in 30 yrs
- 1 days/yr
Risk factors via First Street. Map © Google.
Why this score? — see what drove the D grade
The composite is a weighted blend of 9 inputs, each scored 0–100. Each bar is that input's sub-score; the figure is the points it added to the 100-point composite (weight × sub-score).
- ARV discount +14.7/15.0
- Cash flow +11.9/30.0
- DSCR +3.5/10.0
- Schools +3.2/10.0
- Livability +3.2/5.0
- Condition / age +2.5/5.0
- 1% rule +2.4/10.0
- Rent growth +2.2/5.0
- Appreciation +0.0/10.0
$238,000
🖨 Deal sheet (PDF) 📄 Offer letter ✓ Due diligence
Listing remarks
AMAZING INVESTOR OPPORTUNITY: Unlock the potential of this rare package deal featuring two homes and two additional land parcels, totaling approximately 2.8 acres in the heart of La Vergne. The offering includes 150 Fisk Dr, a 2-bedroom, 1-bath residence, along with 136 Fisk Dr, also a 3-bedroom, 1-bath home. In addition, two adjoining parcels located directly behind the properties on Mill Drive (Parcel IDs: 018F A 022.0 & 018F A 023.00) are included. This combined acreage presents a unique opportunity for redevelopment, expansion, or long-term investment. All properties must be sold together as a package, creating a true blank canvas ready for your vision.
Key facts
- Two homes
- Unique opportunity
- 0.7 acre lot
Tags
Property features AI
Exterior
- Parking: Attached garage (1 car); Garage faces front; 1 covered parking space
- Utilities: Public water; Public sewer; Electricity available; Water available
- Home design: Single-family residence; One story; Residential property
- Construction: Frame construction
- Exterior features: Lot approximately 0.7 acres; Lot dimensions about 325 x 107 (calculated from plat)
Interior
- Kitchen: Electric oven
- Bedrooms: 2 bedrooms (both on main level)
- Flooring: Other flooring
- Bathrooms: 1 full bathroom
- Heating & cooling: Electric heating; Electric cooling
- Interior features: Electric oven; Basement (other)
Neighborhood map
What this means for you Summary
Snapshot
- This is a 2-bed/1.0-bath single-family listed at $238k.
Deal economics
- At list price, monthly cash flow is $-59 ($-707/yr) — negative.
- To cash-flow at today's rent, offer at most $228k (4.4% below list).
- To meet the 1% rule (rent ≥ 1% of price), the offer needs to be $177k (25.6% below list).
- Recommended offer: $177k (25.6% below list) — sets the bar for 1% rule.
- Cap rate 6.0% vs local median 3.6% in La Vergne — top-decile yield for the area; either an underpriced asset or a hidden risk that comps aren't pricing in. Stress-test before assuming the spread holds.
Location & tenants
- Location reads 64/100 on livability (#171 in TN) — a middle-class / working-renter tenant base. Strengths: cost of living A+, housing A+, employment B; Watch: crime D-, amenities F, commute F.
- Rutherford County (suburban): math 34% / reading 37% proficiency, ranked #22 of 139 in TN (top 16%) — families likely to look elsewhere, expect single-tenant / working-renter base with shorter leases.
- Zoned schools: John Colemon Elementary (math 33% / reading 27%, grade F, #415 of 952 statewide, top 44%, 767 students, 0% FRL); Lavergne Middle School (math 21% / reading 17%, grade F, #204 of 333 statewide, top 62%, 1,091 students, 0% FRL); Lavergne High School (math 8% / reading 30%, grade F, #202 of 332 statewide, top 62%, 2,100 students, 0% FRL) — zoned schools average 0% FRL vs 36% district-wide (36 pts lower); this property's tenant base skews higher-income than the district average.
- Zoned-school proficiency averages 23% at this address vs 36% district-wide (-13 pts) — the specific schools serving this property underperform the Rutherford County average; the district grade overstates school quality for this exact location.
- Market conditions: Rents soft (-1.0%/yr); 271 active listings in the ZIP; 8 comparable units currently listed for rent nearby; rentals leasing fast (median 6d on market — plan ~1-2 weeks tenant-placement turnaround); solid renter incomes; 3,421 units permitted in Rutherford County in 2024 (400 in 5+ unit buildings).
Forward outlook
- Local home prices are declining (-3.0%/yr); year-one equity from $2k of loan paydown is wiped out by about $7k of value loss. Plan a longer hold.
- Rutherford County population projected at +60% by 2050 — long-run rental-demand tailwind backs the buy-and-hold thesis.
Negotiation context
- Only 6 days on market — expect competitive offers; lowballing is unlikely to land.
Risks & watch-outs
- Watch-outs: built in 1958 — expect roof / HVAC / electrical / plumbing capex.
- Climate carrying-cost: extreme-heat days projected 7→19/yr by 2055 (HVAC capex compounding) — expect insurance premiums to compound above CPI over the hold.
Questions for the listing agent
- What do current leases actually rent for vs. the listed asking? Can we see a recent rent roll and the last 12 months of T-12 income?
- Built in 1958 — when were the roof, HVAC, electrical panel, plumbing, and water heater last replaced?
- Is there a deadline driving the sale (1031 exchange, divorce, estate, relocation)? That informs how much negotiation room exists.
- Schools are D-rated, which usually means shorter tenancies and higher turnover. Who's the typical renter profile here, and what's been the actual vacancy rate?
- Crime grade is D in this area — have there been break-ins, vandalism, or insurance claims at this property in the last 3 years? What carrier currently insures it and at what premium?
- The area grade is low — what's the realistic commute time and amenity access for the typical tenant pool here? Any planned neighborhood developments (good or bad) we should know about?
- What's the average days-on-market for RENTAL listings here right now (not sales)? A rising rental-DOM trend means longer vacancies and softer asking-rent achievability than the comps imply.
- What's the recent tenant-quality profile in this submarket — average credit score on applications, eviction rate, late-payment / NSF rate, and stable-employment percentage? A property-management company in the area should have these aggregated.
- How much new for-sale + rental construction is in the pipeline within 1–3 miles? Heavy new supply typically softens prices + rents 12–24 months out; constrained supply supports both.
Investment metrics
- 1% rule
- 0.74% ✗
- Cap rate
- 6.00%
- Cash-on-cash
- -1.06%
- DSCR
- 0.95
- GRM
- 11.2
CMA / ARV
- ARV (median comp)
- $283,194
- List price
- $238,000
- Delta
- -15.96%
- Verdict
- UNDERPRICED
- Comps
- 3 within 1.0 mi
Show comp detail 1 sale within ~0.75 mi
| Address | Dist | Beds/Ba | Sqft | Sold | Price | $/sf | Match |
|---|---|---|---|---|---|---|---|
| 150 Fisk Dr | 0.00mi | 2/1.0 | 783 (0%) | 1mo | $250,000 | $319 | 99 |
Match score weights: distance 35% · size 25% · config 20% · recency 20%. Top-matched comps best support the ARV.
Projected returns pro-forma
-3.0% appreciation · 0.0% rent growth · sell at horizon
- IRR
- -21.1%
- Equity multiple
- 0.29×
- Total profit
- $-47,600
- Equity at exit
- $35,487
- IRR
- -22.3%
- Equity multiple
- -0.00×
- Total profit
- $-66,703
- Equity at exit
- $20,578
Cash invested: $66,640 (down + closing). Projections, not guarantees.
Landlord ↔ Tenant lean methodology
- Overall (STATE)
- 87 Strongly Landlord-Friendly
- State Tennessee
- 87 Strongly Landlord-Friendly · R+13
- County
- — inherits STATE
- City
- — inherits STATE
ZIP-level market 37086
- Home prices YoY
- -21.3%
- Rents YoY
- -1.0%
- Active inventory
- 271
- Price-to-rent
- 11.2×
Monthly cashflow live
- Estimated rent
- $1,772 high interval (Pro) →
- Mortgage (P&I)
- −$1,248
- Tax from tax record
- −$111 /mo · $1,334/yr
- Insurance
- −$99
- HOA
- −$0
- Vacancy / Maint / Mgmt
- −$372
- Net cashflow
- $-59
Break-even live
Sensitivity live
| Price | -10% $76 | -5% $8 | +0% $-59 | +5% $-126 | +10% $-194 |
|---|---|---|---|---|---|
| Rent | -10% $-199 | -5% $-129 | +0% $-59 | +5% $11 | +10% $81 |
| Rate | -1.0pp $61 | -0.5pp $2 | base $-59 | +0.5pp $-121 | +1.0pp $-183 |
UW: 25.0% down · 7.5% · 30yr · 1.5% tax · 5.0% vac · 8.0% maint · 8.0% mgmt
Financing live
Cash to close
- Down payment
- $59,500
- Closing costs
- $7,140
- Reserves months
- —
- Total cash needed
- —
Loan-product check · same deal, 3 products live
Conventional
25% down · 7.5% · 30yr
- Down + closing
- —
- Monthly P&I
- —
- Monthly cashflow
- —
- DSCR
- —
- Eligible?
- —
Personal DTI + credit; lowest rate.
DSCR
20% down · 8.5% · 30yr
- Down + closing
- —
- Monthly P&I
- —
- Monthly cashflow
- —
- DSCR
- —
- Eligible?
- —
No personal income docs; deal must DSCR.
Hard money
10% down · 12.0% · 12mo
- Down + closing
- —
- Monthly P&I
- —
- Monthly cashflow
- —
- DSCR
- —
- Eligible?
- —
Short-term bridge; refi at stabilization.
Rent comps 8 comps
| Address | Beds | Baths | Sqft | Rent | $/sqft | DOM | Units | Dist |
|---|---|---|---|---|---|---|---|---|
| 200 Carriage House Dr Smyrna, TN | 1.0–3.0 | 1.0–2.0 | 1008 | $2,007 | $1.99 | 5d | 42 | 1.12mi |
| 1435 Tuffnell Dr La Vergne, TN | 3.0 | 2.0 | 1112 | $1,910 | $1.72 | 6d | 1 | 1.25mi |
| 1075 Arlene Dr La Vergne, TN | 2.0 | 2.5 | 1096 | $1,525 | $1.39 | 14d | 1 | 1.36mi |
| 1077 Arlene Dr La Vergne, TN | 2.0 | 2.5 | 1096 | $1,500 | $1.37 | 6d | 1 | 1.36mi |
| 4019 Cody Dr La Vergne, TN | 2.0 | 2.5 | 1058 | $1,675 | $1.58 | 6d | 1 | 1.36mi |
| 1059 Arlene Dr La Vergne, TN | 2.0 | 2.5 | 1092 | $1,555 | $1.42 | 14d | 1 | 1.37mi |
| 1076 Arlene Dr La Vergne, TN | 2.0 | 2.5 | 1096 | $1,550 | $1.41 | 6d | 1 | 1.38mi |
| 1001 Mason Tucker Dr Smyrna, TN | 1.0–2.0 | 1.0–2.0 | 837 | $1,499 | $1.79 | 4d | 6 | 1.44mi |
Listing history 2 events
-
2026-05-11status Pending 671-char remark
-
2026-05-05$238,000 Active 671-char remark
ⓘ Source: listings_history table (triggers on properties + properties_extension) + one-shot
backfill from property_details.listing_events for pre-trigger history.
Tax reassessment forecast TN · Resets to sale price
- Current annual tax
- $1,334 · $111/mo
- Projected year-2 tax
- $1,690 · $141/mo
- Expected delta
- +$356/yr (+$30/mo · 26.7%)
ⓘ Screening estimate from a state-policy table — verify with the county assessor before closing.
Climate risk First Street
- Flood 1/10 Low FEMA zone X (unshaded) · 0% chance over 30 yrs
- Wildfire 1/10 Low
- Heat 5/10 Major 7 d/yr ≥106°F today · 19 d/yr by 30 yrs out
- Wind 4/10 Moderate 9% chance of damaging wind over 30 yrs
- Air quality 2/10 Low 0 unhealthy d/yr today · 1 by 30 yrs out
Nearby sold comps map
Loading sold comps map…
Walkable amenities ~0.75 mi
Loading nearby amenities…
Taxation est. · year 1
- Rental income
- $21,258
- − Mortgage interest
- −$13,332
- − Property taxes
- −$1,334
- − Insurance
- −$1,190
- − Repairs & maintenance
- −$1,701
- − Management
- −$1,701
- − Depreciation
- −$6,924
- Taxable loss
- −$4,923
- Est. tax savings @ 24.0%
- +$1,181
- After-tax cash flow
- $474/yr
For passive investors: Depreciation is non-cash, so a rental often shows a tax loss while cash-flowing — sheltering income. Rental losses are passive: they offset passive income freely, and up to $25,000/yr can offset ordinary (W-2) income if you actively participate and your MAGI is under $100k (phasing out to $0 by $150k); unused losses carry forward. On sale, claimed depreciation is recaptured at up to 25%, and gains may owe capital-gains tax (a 1031 exchange can defer both). Figures are a year-1 estimate at your 24.0% rate — not tax advice; consult a CPA.
Schools (NCES district)
- District
- Rutherford County
- NCES district ID
- 4703690
- Math proficiency
- 34% ▼ -11.00%
- Reading proficiency
- 37% ▼ -4.00%
- Median HH income
- $59,872
- Composite
- 31.7/100
- National rank
- #5917
- State rank
- #22 of 139 in TN
Livability — La Vergne
- Score
- 64/100
- State rank
- #171
- US rank
- #14524
Category grades
Schools grade is shown separately in the Schools card above.
Census & demographics
- Census place
- La Vergne, TN
- County
- Rutherford County · 327,859 people
- City population
- 38,872
- Metro
- Nashville-Davidson--Murfreesboro--Franklin, TN
- Population (ZIP)
- 38,872
- Household income
- $78,857
- Rent vs Own
- Severe rent burden
- 739.0
Population outlook (Rutherford County) Hauer SSP2
- Today (2025)
- 385,165 people
- By 2030
- 430,283 · +11.7%
- By 2040
- 523,241 · +35.8%
- By 2050
- 616,830 · +60.1%
- By 2075
- 848,777 · +120.4%
- By 2100
- 1,028,900 · +167.1%
Race, ethnicity, and origin ACS 2023
- Neighborhood character
- Diverse neighborhood (Simpson 0.68)
- Race & ethnicity
- White 43% Black 28% Hispanic / Latino 24% Two or more races 13% Asian 2%
- Hispanic origin (detail)
- Mexican 12% Puerto Rican 2%
- Common ancestry
- Italian 1% Iranian 1% Lithuanian 1%
- Foreign-born
- 18% · Canada
- Languages at home
- 72% English-only · Spanish 21% Arabic 3% Other Asian/Pacific 1%
Political lean MEDSL · Rutherford
- 2024 margin
- Strong R (+21.8) · D 38.4% · R 60.1% · Other 1.5%
- 2008→2024 swing
- -2.7pp toward R · 2008: -19.1pp · 2024: -21.8pp
- All cycles
- 2024: R+21.8 2020: R+15.4 2016: R+26.1 2012: R+24.7 2008: R+19.1
Not yet ingested
- Civics
- —
Market trends
- HPI YoY
- ▼ -76.52%
- Current HPI
- 282.9844
- Rent YoY
- ▼ -1.04%
- Metro
- Nashville-Davidson--Murfreesboro--Franklin, TN
- State GDP YoY
- ▲ 2.78%
- F500 in state
- 22
Industry mix (Fortune 500 HQ in TN)
| Industry | F500 HQs | Revenue |
|---|---|---|
| Healthcare | 3 | $91B |
|
||
| Retail | 3 | $72B |
|
||
| Transportation / Logistics | 1 | $88B |
|
||
| Paper / Packaging | 1 | $19B |
|
||
| Insurance | 1 | $13B |
|
||
| Energy | 1 | $12B |
|
||
Price history
+5.0% since first listed3 events — show timeline
- 2026-05-22 Sold (MLS) $250,000 REALTRACS as Distributed by MLS Grid
- 2026-05-11 Pending — REALTRACS as Distributed by MLS Grid
- 2026-05-05 Listed $238,000 REALTRACS as Distributed by MLS Grid
Property tax history
+7.6%/yrLatest (2025): $1,334 · +0.0% YoY. Source: county tax records.
Cash-flow waterfall
monthlySold comps — $/sqft
last 12 mo · ≤1 miLoading sold comps…