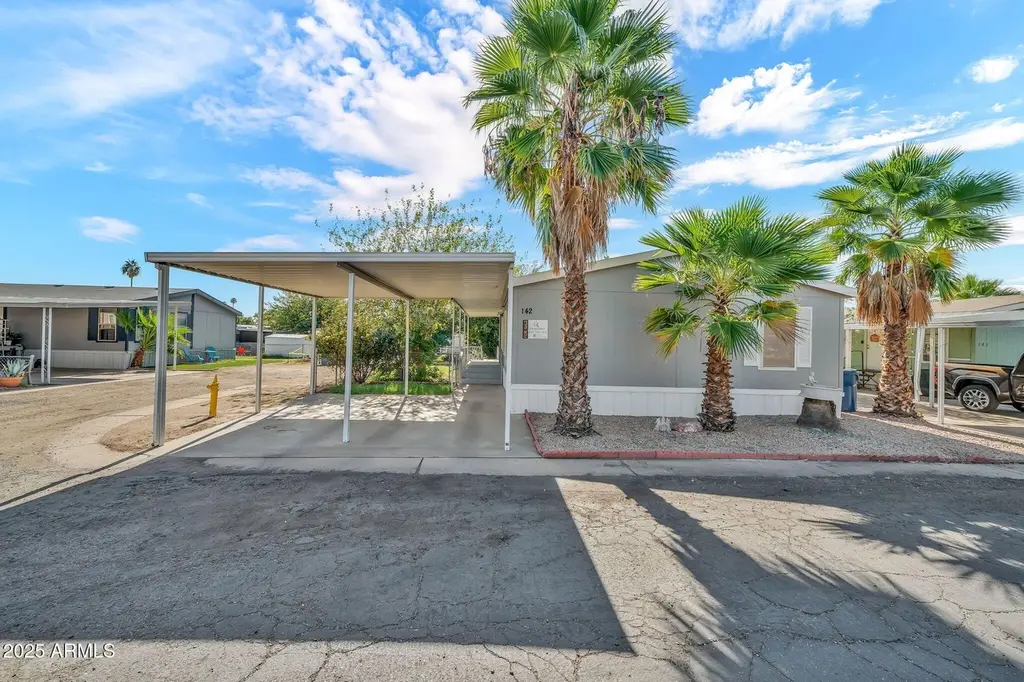
19401 N 7th St #142 · Phoenix, AZ
Flood risk 1/10 · Minimal
- FEMA flood zone
- X (shaded)
- Chance of flooding over 30 yrs
- 0.0%
- Est. flood insurance / yr
- $507 – $1,088
Fire risk 4/10 · Minor
- Est. fire insurance / yr
- $610 – $1,132
Heat risk 8/10 · Major
- Hot days now (above 111°F)
- 6 days/yr
- Hot days in 30 yrs
- 16 days/yr
Wind risk 1/10 · Minimal
- Chance of severe wind over 30 yrs
- —
Air-quality risk 3/10 · Minor
- Unhealthy air days now
- 2 days/yr
- Unhealthy air days in 30 yrs
- 3 days/yr
Risk factors via First Street. Map © Google.
Why this score? — see what drove the B grade
The composite is a weighted blend of 9 inputs, each scored 0–100. Each bar is that input's sub-score; the figure is the points it added to the 100-point composite (weight × sub-score).
- Cash flow +30.0/30.0
- 1% rule +10.0/10.0
- DSCR +10.0/10.0
- ARV discount +7.5/15.0
- Schools +3.8/10.0
- Livability +3.8/5.0
- Condition / age +3.8/5.0
- Rent growth +2.9/5.0
- Appreciation +0.0/10.0
$76,000
🖨 Deal sheet 📄 Offer letter ✓ Due diligence
Listing remarks MLS
Amazing manufactured home in Bonaventure now available! All ages are welcome. This beauty is move in ready! Features include 3 bedrooms, and 2 baths. Large kitchen with plenty of cabinetry! Modern vinyl flooring throughout common areas. Exterior features an adorable front porch as well as covered carport for 2 vehicles. This community offers wonderful amenities such as a dog park, swimming pool, community room, play area, and ! Excellent N. Phoenix location close to schools, shopping, Hwy 101, and restaurants. Welcome Home!
Key facts
- 4 parking spots
- Community pool
- Built 1999
Neighborhood map
What this means for you Summary
Snapshot
- This is a 3-bed/2.0-bath manufactured listed at $76k. Condition is rated good.
Deal economics
- At list price, monthly cash flow is $1k ($14k/yr) — positive.
- The deal already cash-flows at list — no discount required.
- Meets the 1% rule at list price ($2k rent vs $76k).
- Recommended offer: $67k (12.0% below list) — sets the bar for market timing.
- Cap rate 24.9% vs local median 3.3% in Phoenix — top-decile yield for the area; either an underpriced asset or a hidden risk that comps aren't pricing in. Stress-test before assuming the spread holds.
Location & tenants
- Location reads 75/100 on livability (#16 in AZ, #3,924 nationally) — a middle-class / working-renter tenant base. Strengths: amenities A+, commute A+, housing A+; Watch: health & safety C-, crime F.
- Paradise Valley Unified District (4241) (urban): math 39% / reading 46% proficiency, ranked #56 of 249 in AZ (top 22%) — families likely to look elsewhere, expect single-tenant / working-renter base with shorter leases.
- Market conditions: Rents rising (+1.4%/yr); 201 active listings in the ZIP; 40 comparable units currently listed for rent nearby; rentals leasing fast (median 8d on market — plan ~1-2 weeks tenant-placement turnaround); solid renter incomes; 36,011 units permitted in Maricopa County in 2024 (12,801 in 5+ unit buildings).
Forward outlook
- Local home prices are declining (-3.0%/yr); year-one equity from $525 of loan paydown is wiped out by about $2k of value loss. Plan a longer hold.
- Maricopa County population projected at +38% by 2050 — long-run rental-demand tailwind backs the buy-and-hold thesis.
- At projected returns (-3.0% appreciation + 1.4% rent growth), your $21k cash investment doubles in ~2 years — after that, you're playing with house money.
Negotiation context
- It's been on market 218 days — a 12% lower offer ($67k) is reasonable based on typical stale-listing flexibility.
Risks & watch-outs
- Climate carrying-cost: extreme-heat days projected 6→16/yr by 2055 (HVAC capex compounding) — expect insurance premiums to compound above CPI over the hold.
Questions for the listing agent
- It's been on market 218 days. Have you received any prior offers? Is the seller open to a 12% concession, seller financing, or rate buy-down credit?
- Why hasn't it sold? Are there any deal-killer items the seller is aware of (foundation, flood, title, zoning, code violations)?
- Is there a deadline driving the sale (1031 exchange, divorce, estate, relocation)? That informs how much negotiation room exists.
- Crime grade is F in this area — have there been break-ins, vandalism, or insurance claims at this property in the last 3 years? What carrier currently insures it and at what premium?
- What's the average days-on-market for RENTAL listings here right now (not sales)? A rising rental-DOM trend means longer vacancies and softer asking-rent achievability than the comps imply.
- What's the recent tenant-quality profile in this submarket — average credit score on applications, eviction rate, late-payment / NSF rate, and stable-employment percentage? A property-management company in the area should have these aggregated.
- How much new for-sale + rental construction is in the pipeline within 1–3 miles? Heavy new supply typically softens prices + rents 12–24 months out; constrained supply supports both.
Investment metrics
- 1% rule
- 2.83% ✓
- Cap rate
- 24.86%
- Cash-on-cash
- 66.29%
- DSCR
- 3.95
- GRM
- 2.9
CMA / ARV
- ARV (median comp)
- $238,154
- List price
- $76,000
- Delta
- -68.09%
- Verdict
- UNDERPRICED
- Comps
- 16 within 1.0 mi
Show comp detail 8 sales within ~0.75 mi
| Address | Dist | Beds/Ba | Sqft | Sold | Price | $/sf | Match |
|---|---|---|---|---|---|---|---|
| 19401 N 7st Lot 94 St #94 | 0.10mi | 3/2.0 | 1,200 (0%) | 2mo | $84,500 | $70 | 94 |
| 19401 N 7th St #25 | 0.08mi | 3/2.0 | 1,200 (0%) | 4mo | $70,000 | $58 | 93 |
| 311 E Wagoner Rd | 0.71mi | 2/2.0 (-1) | 1,162 (-3%) | 1mo | $250,000 | $215 | 56 |
| 112 E Villa Theresa Dr | 0.68mi | 4/2.0 (+1) | 1,300 (+8%) | 2mo | $340,000 | $262 | 48 |
| 417 E Michigan Ave | 0.65mi | 2/2.0 (-1) | 1,249 (+4%) | 14mo | $307,000 | $246 | 46 |
| 18442 N 2nd Pl | 0.63mi | 3/2.0 | 1,153 (-4%) | 23mo | $295,000 | $256 | 45 |
| 314 E Villa Maria Dr | 0.72mi | 2/2.0 (-1) | 1,100 (-8%) | 5mo | $215,000 | $195 | 44 |
| 440 E Michigan Ave | 0.70mi | 2/2.0 (-1) | 1,153 (-4%) | 18mo | $285,000 | $247 | 41 |
Match score weights: distance 35% · size 25% · config 20% · recency 20%. Top-matched comps best support the ARV.
Projected returns pro-forma
-3.0% appreciation · 1.44% rent growth · sell at horizon
- IRR
- 63.8%
- Equity multiple
- 3.78×
- Total profit
- $59,265
- Equity at exit
- $11,332
- IRR
- 67.7%
- Equity multiple
- 7.34×
- Total profit
- $134,919
- Equity at exit
- $6,571
Cash invested: $21,280 (down + closing). Projections, not guarantees.
Landlord ↔ Tenant lean methodology
- Overall (STATE)
- 87 Strongly Landlord-Friendly
- State Arizona
- 87 Strongly Landlord-Friendly · R+3
- County
- — inherits STATE
- City
- — inherits STATE
ZIP-level market 85024
- Home prices YoY
- -21.0%
- Rents YoY
- 1.4%
- Active inventory
- 201
- Price-to-rent
- 2.9×
Monthly cashflow live
- Estimated rent
- $2,153 high interval (Pro) →
- Mortgage (P&I)
- −$399
- Tax est. 1.5%
- −$95 /mo · $1,140/yr
- Insurance
- −$32
- HOA
- −$0
- Vacancy / Maint / Mgmt
- −$452
- Net cashflow
- $1,176
Break-even live
UW: 25.0% down · 7.5% · 30yr · 1.5% tax · 5.0% vac · 8.0% maint · 8.0% mgmt
Financing live
Cash to close
- Down payment
- $19,000
- Closing costs
- $2,280
- Reserves months
- —
- Total cash needed
- —
Loan-product check · same deal, 3 products live
Conventional
25% down · 7.5% · 30yr
- Down + closing
- —
- Monthly P&I
- —
- Monthly cashflow
- —
- DSCR
- —
- Eligible?
- —
Personal DTI + credit; lowest rate.
DSCR
20% down · 8.5% · 30yr
- Down + closing
- —
- Monthly P&I
- —
- Monthly cashflow
- —
- DSCR
- —
- Eligible?
- —
No personal income docs; deal must DSCR.
Hard money
10% down · 12.0% · 12mo
- Down + closing
- —
- Monthly P&I
- —
- Monthly cashflow
- —
- DSCR
- —
- Eligible?
- —
Short-term bridge; refi at stabilization.
Rent comps 40 comps
| Address | Beds | Baths | Sqft | Rent | $/sqft | DOM | Units | Dist |
|---|---|---|---|---|---|---|---|---|
| 19601 N 7th St Phoenix, AZ | 2.0–3.0 | 2.0–2.5 | 1000 | $1,695 | $1.69 | 5d | 3 | 0.26mi |
| 19835 N 8th Pl Phoenix, AZ | 3.0 | 3.0 | 1320 | $2,300 | $1.74 | 7d | 1 | 0.41mi |
| 18437 N 8th Pl Phoenix, AZ | 3.0 | 2.0 | 1355 | $1,980 | $1.46 | 5d | 1 | 0.45mi |
| 425 E Marco Polo Rd Phoenix, AZ | 3.0 | 2.0 | 1168 | $2,395 | $2.05 | 2d | 1 | 0.46mi |
| 1032 E Villa Maria Dr Phoenix, AZ | 2.0 | 2.0 | 1097 | $1,850 | $1.69 | 7d | 1 | 0.67mi |
| 1032 E Villa Maria Dr Phoenix, AZ | 2.0 | 2.0 | 1097 | $1,850 | $1.69 | 20d | 1 | 0.67mi |
| 1420 E Topeka Dr Phoenix, AZ | 3.0 | 2.5 | 1464 | $2,215 | $1.51 | 7d | 1 | 0.67mi |
| 726 E Villa Rita Dr Phoenix, AZ | 2.0 | 2.0 | 1088 | $2,000 | $1.84 | 18d | 1 | 0.69mi |
| 726 E Villa Rita Dr Phoenix, AZ | 2.0 | 2.0 | 1088 | $2,000 | $1.84 | 11d | 1 | 0.69mi |
| 20435 N 7th St Phoenix, AZ | 1.0–3.0 | 1.0–2.0 | 957 | $2,139 | $2.24 | 1d | 20 | 0.71mi |
| 1136 E Villa Rita Dr Phoenix, AZ | 2.0 | 2.0 | 1141 | $1,950 | $1.71 | 24d | 1 | 0.77mi |
| 18217 N 2nd Pl Phoenix, AZ | 2.0 | 1.0 | 833 | $1,300 | $1.56 | 16d | 1 | 0.80mi |
| 1510 E Taro Ln Phoenix, AZ | 3.0 | 2.0 | 1136 | $2,149 | $1.89 | 24d | 1 | 0.80mi |
| 1506 E Wescott Dr Phoenix, AZ | 3.0 | 2.0 | 1136 | $2,045 | $1.80 | 5d | 1 | 0.80mi |
| 1126 E Charleston Ave Phoenix, AZ | 3.0 | 2.0 | 1214 | $2,450 | $2.02 | 3d | 1 | 0.81mi |
| 18633 N 15th St Phoenix, AZ | 3.0 | 2.0 | 1240 | $2,249 | $1.81 | 7d | 1 | 0.83mi |
| 1130 E Grovers Ave Phoenix, AZ | 2.0 | 2.0 | 934 | $1,336 | $1.43 | 2d | 12 | 0.90mi |
| 815 E Grovers Ave Phoenix, AZ | 1.0–2.0 | 1.0–2.5 | 1469 | $2,800 | $1.91 | 5d | 2 | 0.95mi |
| 17625 N 7th St Phoenix, AZ | 1.0–3.0 | 1.0–2.0 | 925 | $1,739 | $1.88 | 3d | 7 | 0.99mi |
| 17617 N 9th St Phoenix, AZ | 1.0–3.0 | 1.0–2.0 | 956 | $2,017 | $2.11 | 1d | 35 | 1.02mi |
| 310 W Pontiac Dr #8 Phoenix, AZ | 2.0 | 2.0 | 994 | $1,700 | $1.71 | 15d | 1 | 1.10mi |
| 409 W Pontiac Dr #3 Phoenix, AZ | 2.0 | 2.0 | 863 | $1,495 | $1.73 | 23d | 1 | 1.12mi |
| 1717 E Union Hills Dr #1052 Phoenix, AZ | 2.0 | 2.0 | 1160 | $4,000 | $3.45 | 43d | 1 | 1.16mi |
| 312 W Yukon Dr #7 Phoenix, AZ | 2.0 | 2.0 | 863 | $1,425 | $1.65 | 21d | 1 | 1.18mi |
| 312 W Yukon Dr #2 Phoenix, AZ | 2.0 | 2.0 | 863 | $1,550 | $1.80 | 24d | 1 | 1.18mi |
| 317 W Hononegh Dr Phoenix, AZ | 2.0 | 2.0 | 994 | $1,495 | $1.50 | 18d | 1 | 1.20mi |
| 1702 E Michelle Dr Phoenix, AZ | 2.0 | 2.0 | 1300 | $2,200 | $1.69 | 5d | 1 | 1.21mi |
| 511 W Blackhawk Dr #4 Phoenix, AZ | 2.0 | 2.0 | 994 | $1,550 | $1.56 | 24d | 1 | 1.23mi |
| 1717 E Union Hills Dr Phoenix, AZ | 2.0–3.0 | 2.0 | 1245 | $4,000 | $3.21 | 21d | 4 | 1.24mi |
| 1717 E Union Hills Dr Phoenix, AZ | 2.0–3.0 | 2.0 | 1169 | $4,000 | $3.42 | 3d | 3 | 1.24mi |
| 17249 N 7th St Phoenix, AZ | 1.0–3.0 | 1.0–2.0 | 956 | $1,933 | $2.02 | 1d | 37 | 1.24mi |
| 501 W Yukon Dr #4 Phoenix, AZ | 2.0 | 2.0 | 994 | $1,695 | $1.71 | 7d | 1 | 1.25mi |
| 601 W Yukon Dr #3 Phoenix, AZ | 2.0 | 2.0 | 863 | $1,563 | $1.81 | 43d | 1 | 1.28mi |
| 314 E Hartford Ave Phoenix, AZ | 2.0 | 2.0 | 1320 | $2,195 | $1.66 | 24d | 1 | 1.30mi |
| 229 E Anderson Ave Phoenix, AZ | 2.0 | 2.0 | 1256 | $2,100 | $1.67 | 7d | 1 | 1.30mi |
| 1100 E Bell Rd Phoenix, AZ | 1.0–3.0 | 1.0–2.0 | 987 | $2,274 | $2.30 | 1d | 26 | 1.34mi |
| 118 E Anderson Ave Phoenix, AZ | 2.0 | 2.0 | 1272 | $1,950 | $1.53 | 24d | 1 | 1.35mi |
| 20350 N 7th Ave Phoenix, AZ | 2.0 | 1.0–2.0 | 844 | $2,038 | $2.41 | 1d | 55 | 1.38mi |
| 17420 N 2nd Ave Phoenix, AZ | 3.0 | 2.0 | 1312 | $2,000 | $1.52 | 21d | 1 | 1.38mi |
| 1450 E Bell Rd Phoenix, AZ | 1.0–3.0 | 1.0–2.0 | 957 | $2,083 | $2.18 | 2d | 93 | 1.40mi |
Listing history 18 events
-
2026-06-18days on market $76,000 Active 218 DOM
-
2026-06-17days on market $76,000 Active 217 DOM
-
2026-06-16days on market $76,000 Active 216 DOM
-
2026-06-15days on market $76,000 Active 215 DOM
-
2026-06-13days on market $76,000 Active 213 DOM
-
2026-06-13days on market $76,000 Active 212 DOM
-
2026-06-09days on market $76,000 Active 209 DOM
-
2026-06-08days on market $76,000 Active 208 DOM
-
2026-06-07days on market $76,000 Active 207 DOM
-
2026-06-04days on market $76,000 Active 204 DOM
-
2026-06-03days on market $76,000 Active 203 DOM
-
2026-06-02days on market $76,000 Active 202 DOM
-
2026-06-01days on market $76,000 Active 201 DOM
-
2026-05-31days on market $76,000 Active 200 DOM
-
2026-04-27price $79,000 529-char remark
Show marketing remark (529 chars)
Amazing manufactured home in Bonaventure now available! All ages are welcome. This beauty is move in ready! Features include 3 bedrooms, and 2 baths. Large kitchen with plenty of cabinetry! Modern vinyl flooring throughout common areas. Exterior features an adorable front porch as well as covered carport for 2 vehicles. This community offers wonderful amenities such as a dog park, swimming pool, community room, play area, and ! Excellent N. Phoenix location close to schools, shopping, Hwy 101, and restaurants. Welcome Home!
-
2026-03-29price $84,000 529-char remark
Show marketing remark (529 chars)
Amazing manufactured home in Bonaventure now available! All ages are welcome. This beauty is move in ready! Features include 3 bedrooms, and 2 baths. Large kitchen with plenty of cabinetry! Modern vinyl flooring throughout common areas. Exterior features an adorable front porch as well as covered carport for 2 vehicles. This community offers wonderful amenities such as a dog park, swimming pool, community room, play area, and ! Excellent N. Phoenix location close to schools, shopping, Hwy 101, and restaurants. Welcome Home!
-
2026-02-12price $89,000 529-char remark
Show marketing remark (529 chars)
Amazing manufactured home in Bonaventure now available! All ages are welcome. This beauty is move in ready! Features include 3 bedrooms, and 2 baths. Large kitchen with plenty of cabinetry! Modern vinyl flooring throughout common areas. Exterior features an adorable front porch as well as covered carport for 2 vehicles. This community offers wonderful amenities such as a dog park, swimming pool, community room, play area, and ! Excellent N. Phoenix location close to schools, shopping, Hwy 101, and restaurants. Welcome Home!
-
2025-11-12$96,000 Active 529-char remark
Show marketing remark (529 chars)
Amazing manufactured home in Bonaventure now available! All ages are welcome. This beauty is move in ready! Features include 3 bedrooms, and 2 baths. Large kitchen with plenty of cabinetry! Modern vinyl flooring throughout common areas. Exterior features an adorable front porch as well as covered carport for 2 vehicles. This community offers wonderful amenities such as a dog park, swimming pool, community room, play area, and ! Excellent N. Phoenix location close to schools, shopping, Hwy 101, and restaurants. Welcome Home!
ⓘ Source: listings_history table (triggers on properties + properties_extension) + one-shot
backfill from property_details.listing_events for pre-trigger history.
Climate risk First Street
- Flood 1/10 Low FEMA zone X (shaded) · 0% chance over 30 yrs
- Wildfire 4/10 Moderate
- Heat 8/10 Severe 6 d/yr ≥111°F today · 16 d/yr by 30 yrs out
- Wind 1/10 Low
- Air quality 3/10 Moderate 2 unhealthy d/yr today · 3 by 30 yrs out
Nearby sold comps map
Loading sold comps map…
Walkable amenities ~0.75 mi
Loading nearby amenities…
Taxation est. · year 1
- Rental income
- $25,835
- − Mortgage interest
- −$4,257
- − Property taxes
- −$1,140
- − Insurance
- −$380
- − Repairs & maintenance
- −$2,067
- − Management
- −$2,067
- − Depreciation
- −$2,211
- Taxable income
- $13,714
- Est. tax owed @ 24.0%
- −$3,291
- After-tax cash flow
- $10,816/yr
For passive investors: Depreciation is non-cash, so a rental often shows a tax loss while cash-flowing — sheltering income. Rental losses are passive: they offset passive income freely, and up to $25,000/yr can offset ordinary (W-2) income if you actively participate and your MAGI is under $100k (phasing out to $0 by $150k); unused losses carry forward. On sale, claimed depreciation is recaptured at up to 25%, and gains may owe capital-gains tax (a 1031 exchange can defer both). Figures are a year-1 estimate at your 24.0% rate — not tax advice; consult a CPA.
Condition & rehab AI · 12 photos
This move-in ready manufactured home in Bonaventure offers a good condition with modern updates and a welcoming exterior. Potential buyers and renters will appreciate the fresh paint, modern kitchen, and well-maintained landscaping.
Value-add opportunities
- Both Paint exterior and interior walls — Fresh paint enhances curb appeal and interior aesthetics.
- Both Replace ceiling fans with modern models — Modern fans improve air circulation and aesthetics.
- Both Install new flooring in bathrooms — New flooring in bathrooms enhances cleanliness and appearance.
- Both Upgrade kitchen cabinets and appliances — Modernizing the kitchen can increase both resale and rental value.
- Both Landscaping improvements — Enhanced landscaping can boost curb appeal and attract more potential buyers/tenants.
Renovation cost estimate screening
Value-add ROI direction
- Both Paint exterior and interior walls — Fresh paint enhances curb appeal and interior aesthetics. ↑
- Both Replace ceiling fans with modern models — Modern fans improve air circulation and aesthetics. ↑
- Both Install new flooring in bathrooms — New flooring in bathrooms enhances cleanliness and appearance. ↑
- Both Upgrade kitchen cabinets and appliances — Modernizing the kitchen can increase both resale and rental value. ↑
- Both Landscaping improvements — Enhanced landscaping can boost curb appeal and attract more potential buyers/tenants. ↑
ⓘ Cost ranges are severity-bucket heuristics (US national rule-of-thumb). Get contractor quotes + a written scope before underwriting a rehab budget.
Schools (NCES district)
- District
- Paradise Valley Unified District (4241)
- NCES district ID
- 0405930
- Math proficiency
- 39% ▼ -11.00%
- Reading proficiency
- 46% ▼ -7.00%
- Median HH income
- $64,106
- Composite
- 37.89/100
- National rank
- #4316
- State rank
- #56 of 249 in AZ
Livability — Phoenix
- Score
- 75/100
- State rank
- #16
- US rank
- #3924
Category grades
Schools grade is shown separately in the Schools card above.
Census & demographics
- Census place
- Phoenix, AZ
- County
- Maricopa County · 4,537,380 people
- City population
- 1,500,198
- Metro
- Phoenix-Mesa-Chandler, AZ
- Population (ZIP)
- 26,199
- Household income
- $106,724
- Rent vs Own
- Severe rent burden
- 547.0
Population outlook (Maricopa County) Hauer SSP2
- Today (2025)
- 4,979,203 people
- By 2030
- 5,378,229 · +8.0%
- By 2040
- 6,156,598 · +23.6%
- By 2050
- 6,872,376 · +38.0%
- By 2075
- 8,401,270 · +68.7%
- By 2100
- 9,247,439 · +85.7%
Race, ethnicity, and origin ACS 2023
- Neighborhood character
- Predominantly White (71%)
- Race & ethnicity
- White 71% Hispanic / Latino 16% Two or more races 12% Asian 6% Black 2%
- Hispanic origin (detail)
- Mexican 13% Puerto Rican 1%
- Common ancestry
- Romanian 3% Italian 3% Portuguese 3%
- Foreign-born
- 12% · Canada, China, South Korea
- Languages at home
- 78% English-only · Spanish 10% Other Indo-European 4% Russian/Polish/Slavic 1%
Political lean MEDSL · Maricopa
- 2024 margin
- Toss-up / Even · D 47.7% · R 51.2% · Other 1.1%
- 2008→2024 swing
- +7.1pp toward D · 2008: -10.6pp · 2024: -3.5pp
- All cycles
- 2024: R+3.5 2020: D+2.2 2016: R+3.5 2012: R+12.0 2008: R+10.6
Not yet ingested
- Civics
- —
Market trends
- HPI YoY
- ▼ -82.95%
- Current HPI
- 312.7238
- Rent YoY
- ▲ 1.44%
- Metro
- Phoenix-Mesa-Chandler, AZ
- State GDP YoY
- ▲ 4.54%
- F500 in state
- 20
Industry mix (Fortune 500 HQ in AZ)
| Industry | F500 HQs | Revenue |
|---|---|---|
| Technology | 2 | $13B |
|
||
| Mining / Metals | 1 | $23B |
|
||
| Environmental Services | 1 | $16B |
|
||
| Metals / Steel | 1 | $14B |
|
||
| Technology Distribution | 1 | $9B |
|
||
| Homebuilding | 1 | $8B |
|
||
Price history
-17.7% since first listed4 events — show timeline
- 2026-04-27 Price Changed $79,000 ARMLS
- 2026-03-29 Price Changed $84,000 ARMLS
- 2026-02-12 Price Changed $89,000 ARMLS
- 2025-11-12 Listed $96,000 ARMLS
Cash-flow waterfall
monthlySold comps — $/sqft
last 12 mo · ≤1 miLoading sold comps…