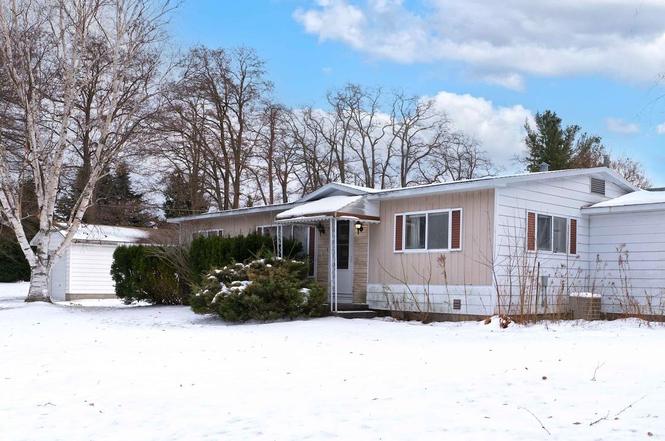
503 Cedar St Lot : 250 · Elk Rapids, MI
Flood risk 1/10 · Minimal
- FEMA flood zone
- —
- Chance of flooding over 30 yrs
- 0.0%
- Est. flood insurance / yr
- —
Fire risk 1/10 · Minimal
- Est. fire insurance / yr
- $784 – $1,456
Heat risk 1/10 · Minimal
- Hot days now (above 94°F)
- 7 days/yr
- Hot days in 30 yrs
- 13 days/yr
Wind risk 1/10 · Minimal
- Chance of severe wind over 30 yrs
- —
Air-quality risk 2/10 · Minimal
- Unhealthy air days now
- 1 days/yr
- Unhealthy air days in 30 yrs
- 1 days/yr
Risk factors via First Street. Map © Google.
Why this score? — see what drove the B+ grade
The composite is a weighted blend of 9 inputs, each scored 0–100. Each bar is that input's sub-score; the figure is the points it added to the 100-point composite (weight × sub-score).
- Cash flow +30.0/30.0
- ARV discount +15.0/15.0
- DSCR +10.0/10.0
- 1% rule +8.8/10.0
- Schools +4.9/10.0
- Livability +3.9/5.0
- Rent growth +2.5/5.0
- Condition / age +2.5/5.0
- Appreciation +0.0/10.0
$265,000
🖨 Deal sheet 📄 Offer letter ✓ Due diligence
Listing remarks
Elk Rapids 3-bedroom/1.5-bath ranch home offering main-floor living is a wonderful opportunity right in the heart of town. Enjoy a home with an attached 2-car garage along with an additional storage garage in the side yard, all situated on a spacious corner lot. The home is filled with natural light and provides an easy, comfortable layout. Whether you're seeking a full-time residence or the perfect getaway for beautiful Michigan summers, this property is in a teriific location. Just a short walk to Elk Rapids Lake & the famous Sandbar, close to the Elk Rapids Golf Club, and surrounded by local shops and small businesses. Plus, you're only 25 minutes from downtown Traverse City.
Key facts
- Spacious corner lot
- Main-floor living
- 9,147 sq ft lot
Tags
Property features AI
Exterior
- Parking: Attached 2-car garage with garage door opener (approx. 23 x 23); Additional detached/secondary garage
- Utilities: Public water; Community sewer; Natural gas service; Cable available
- Home design: Residential single-story home; Built in 1960; Lot/Unit: Lot 250
- Construction: Aluminum siding; Crawl foundation; Built in 1960
- Exterior features: Aluminum exterior; Front porch; Sidewalks; Corner lot in a subdivision; Second garage (outbuilding)
Interior
- Kitchen: Kitchen on main level — ~8 x 9, vinyl flooring; Dining room on main level — ~11 x 9, vinyl flooring; Dining area with vinyl flooring
- Bedrooms: First-floor bedroom (Main level) — ~14 x 11, carpet; Bedroom (Main level) — ~14 x 12, carpet; Bedroom (Main level) — ~11 wide, carpet
- Flooring: Carpet in bedrooms and living areas listed; Vinyl in kitchen, dining room and laundry
- Bathrooms: 2 total bathrooms (includes 1 full, 1 lavatory)
- Heating & cooling: Forced air heating (natural gas); Central air conditioning; Ceiling fans; Exhaust fan; Gas water heater
- Interior features: Window treatments
- Laundry & utility: Laundry room on main level — ~6 x 5, vinyl flooring; Basement: block foundation (crawl type)
Neighborhood map
What this means for you Summary
Snapshot
- This is a 3-bed/1.5-bath single-family listed at $265k.
Deal economics
- At list price, monthly cash flow is $1k ($13k/yr) — positive.
- The deal already cash-flows at list — no discount required.
- Meets the 1% rule at list price ($4k rent vs $265k).
- Recommended offer: $233k (12.0% below list) — sets the bar for market timing.
- Cap rate 11.1% vs local median 0.9% in Elk Rapids — top-decile yield for the area; either an underpriced asset or a hidden risk that comps aren't pricing in. Stress-test before assuming the spread holds.
Location & tenants
- Location reads 77/100 on livability (#132 in MI, #3,250 nationally) — a middle-class / working-renter tenant base. Strengths: crime A+, housing A+, health & safety A+; Watch: amenities F, commute F.
- Elk Rapids Schools (rural): math 47% / reading 65% proficiency, ranked #62 of 540 in MI (top 12%) — acceptable for families but not a draw, mixed tenant base, ~2y average lease.
- Zoned schools: Lakeland Elementary School (math 42% / reading 57%, grade D, #382 of 1,397 statewide, top 30%, 313 students, 42% FRL); Elk Rapids High School (math 52% / reading 72%, grade B-, #58 of 713 statewide, top 9%, 380 students, 28% FRL).
- Market conditions: 30 active listings in the ZIP; 1 comparable units currently listed for rent nearby; 101 units permitted in Antrim County in 2024 (0 in 5+ unit buildings).
Forward outlook
- Local home prices are declining (-3.0%/yr); year-one equity from $2k of loan paydown is wiped out by about $8k of value loss. Plan a longer hold.
- Antrim County population projected at -27% by 2050 — secular population decline; favor cash flow + early exit over multi-decade hold.
- At projected returns (-3.0% appreciation + 3.0% rent growth), your $74k cash investment doubles in ~8 years — after that, you're playing with house money.
Negotiation context
- It's been on market 169 days — a 12% lower offer ($233k) is reasonable based on typical stale-listing flexibility.
- 2 sale attempts with the ask held roughly flat each time — persistent listings suggest the price (not the market) is what's stuck; bring a comps-based counter.
Questions for the listing agent
- It's been on market 169 days. Have you received any prior offers? Is the seller open to a 12% concession, seller financing, or rate buy-down credit?
- Built in 1960 — when were the roof, HVAC, electrical panel, plumbing, and water heater last replaced?
- Why hasn't it sold? Are there any deal-killer items the seller is aware of (foundation, flood, title, zoning, code violations)?
- Is there a deadline driving the sale (1031 exchange, divorce, estate, relocation)? That informs how much negotiation room exists.
- Schools are A-rated — typically a magnet for longer-tenancy family renters. What's the average tenant stay here, and is there a school-zone premium baked into asking?
- What's the average days-on-market for RENTAL listings here right now (not sales)? A rising rental-DOM trend means longer vacancies and softer asking-rent achievability than the comps imply.
- What's the recent tenant-quality profile in this submarket — average credit score on applications, eviction rate, late-payment / NSF rate, and stable-employment percentage? A property-management company in the area should have these aggregated.
- How much new for-sale + rental construction is in the pipeline within 1–3 miles? Heavy new supply typically softens prices + rents 12–24 months out; constrained supply supports both.
Investment metrics
- 1% rule
- 1.38% ✓
- Cap rate
- 11.06%
- Cash-on-cash
- 17.02%
- DSCR
- 1.76
- GRM
- 6.1
CMA / ARV
- ARV (on-the-fly)
- $346,346
- Comps found
- 12
Show comp detail 12 sales within ~0.75 mi
| Address | Dist | Beds/Ba | Sqft | Sold | Price | $/sf | Match |
|---|---|---|---|---|---|---|---|
| 503 Cedar St | 0.00mi | 3/1.5 | 1,211 (0%) | 0mo | $233,900 | $193 | 100 |
| 503 Cedar St Lot : 250 | 0.00mi | 3/1.5 | 1,211 (0%) | 0mo | $233,900 | $193 | 100 |
| 204 1st St | 0.04mi | 3/1.5 | 1,200 (-1%) | 12mo | $343,000 | $286 | 86 |
| 405 Cedar St | 0.06mi | 3/1.5 | 1,288 (+6%) | 8mo | $565,000 | $439 | 80 |
| 509 Spruce St | 0.15mi | 3/1.0 | 1,280 (+6%) | 10mo | $434,000 | $339 | 73 |
| 510 S Bridge St | 0.05mi | 3/2.0 | 1,251 (+3%) | 21mo | $342,500 | $274 | 73 |
| 511 Cedar St | 0.02mi | 3/1.5 | 1,035 (-14%) | 23mo | $300,000 | $290 | 56 |
| 117 Rivershore Dr | 0.64mi | 2/1.0 (-1) | 1,100 (-9%) | 1mo | $289,000 | $263 | 48 |
| 132 Ames St Lot : 35&36 | 0.60mi | 3/2.0 | 1,344 (+11%) | 5mo | $370,000 | $275 | 47 |
| 132 Ames St | 0.60mi | 3/2.0 | 1,344 (+11%) | 5mo | $370,000 | $275 | 47 |
| 612 Ash St | 0.41mi | 3/1.0 | 1,056 (-13%) | 15mo | $348,000 | $330 | 46 |
| 505 E Third | 0.74mi | 2/1.0 (-1) | 1,145 (-6%) | 15mo | $336,000 | $293 | 37 |
Match score weights: distance 35% · size 25% · config 20% · recency 20%. Top-matched comps best support the ARV.
Projected returns pro-forma
-3.0% appreciation · 3.0% rent growth · sell at horizon
- IRR
- 8.3%
- Equity multiple
- 1.33×
- Total profit
- $24,125
- Equity at exit
- $39,512
- IRR
- 17.5%
- Equity multiple
- 2.45×
- Total profit
- $107,520
- Equity at exit
- $22,912
Cash invested: $74,200 (down + closing). Projections, not guarantees.
Landlord ↔ Tenant lean methodology
- Overall (STATE)
- 62 Landlord-Friendly
- State Michigan
- 62 Landlord-Friendly · EVEN
- County
- — inherits STATE
- City
- — inherits STATE
ZIP-level market 49629
- Active inventory
- 30
- Price-to-rent
- 6.1×
Monthly cashflow live
- Estimated rent
- $3,650 medium interval (Pro) →
- Mortgage (P&I)
- −$1,390
- Tax est. 1.5%
- −$331 /mo · $3,975/yr
- Insurance
- −$110
- HOA
- −$0
- Vacancy / Maint / Mgmt
- −$766
- Net cashflow
- $1,052
Break-even live
UW: 25.0% down · 7.5% · 30yr · 1.5% tax · 5.0% vac · 8.0% maint · 8.0% mgmt
Financing live
Cash to close
- Down payment
- $66,250
- Closing costs
- $7,950
- Reserves months
- —
- Total cash needed
- —
Loan-product check · same deal, 3 products live
Conventional
25% down · 7.5% · 30yr
- Down + closing
- —
- Monthly P&I
- —
- Monthly cashflow
- —
- DSCR
- —
- Eligible?
- —
Personal DTI + credit; lowest rate.
DSCR
20% down · 8.5% · 30yr
- Down + closing
- —
- Monthly P&I
- —
- Monthly cashflow
- —
- DSCR
- —
- Eligible?
- —
No personal income docs; deal must DSCR.
Hard money
10% down · 12.0% · 12mo
- Down + closing
- —
- Monthly P&I
- —
- Monthly cashflow
- —
- DSCR
- —
- Eligible?
- —
Short-term bridge; refi at stabilization.
Rent comps 1 comps
| Address | Beds | Baths | Sqft | Rent | $/sqft | DOM | Units | Dist |
|---|---|---|---|---|---|---|---|---|
| 808 Livingston St Elk Rapids, MI | 3.0 | 2.0 | 1200 | $3,650 | $3.04 | 43d | 1 | 0.52mi |
Listing history 5 events
-
2026-04-20historical Accepting Backup Offers
-
2026-03-31status Active
-
2026-03-14historical Accepting Backup Offers
-
2026-01-28price $265,000
-
2025-12-08$270,000 Active
ⓘ Source: listings_history table (triggers on properties + properties_extension) + one-shot
backfill from property_details.listing_events for pre-trigger history.
Climate risk First Street
- Flood 1/10 Low 0% chance over 30 yrs
- Wildfire 1/10 Low
- Heat 1/10 Low 7 d/yr ≥94°F today · 13 d/yr by 30 yrs out
- Wind 1/10 Low
- Air quality 2/10 Low 1 unhealthy d/yr today · 1 by 30 yrs out
Nearby sold comps map
Loading sold comps map…
Walkable amenities ~0.75 mi
Loading nearby amenities…
Taxation est. · year 1
- Rental income
- $43,800
- − Mortgage interest
- −$14,844
- − Property taxes
- −$3,975
- − Insurance
- −$1,325
- − Repairs & maintenance
- −$3,504
- − Management
- −$3,504
- − Depreciation
- −$7,709
- Taxable income
- $8,939
- Est. tax owed @ 24.0%
- −$2,145
- After-tax cash flow
- $10,480/yr
For passive investors: Depreciation is non-cash, so a rental often shows a tax loss while cash-flowing — sheltering income. Rental losses are passive: they offset passive income freely, and up to $25,000/yr can offset ordinary (W-2) income if you actively participate and your MAGI is under $100k (phasing out to $0 by $150k); unused losses carry forward. On sale, claimed depreciation is recaptured at up to 25%, and gains may owe capital-gains tax (a 1031 exchange can defer both). Figures are a year-1 estimate at your 24.0% rate — not tax advice; consult a CPA.
Schools (NCES district)
- District
- Elk Rapids Schools
- NCES district ID
- 2613050
- Math proficiency
- 47% ▼ -6.00%
- Reading proficiency
- 65% ▲ 1.00%
- Median HH income
- $60,185
- Composite
- 48.67/100
- National rank
- #2104
- State rank
- #62 of 540 in MI
Livability — Elk Rapids
- Score
- 77/100
- State rank
- #132
- US rank
- #3250
Category grades
Schools grade is shown separately in the Schools card above.
Census & demographics
- Census place
- Elk Rapids, MI
- Population (ZIP)
- 2,037
Population outlook (Antrim County) Hauer SSP2
- Today (2025)
- 21,804 people
- By 2030
- 20,814 · -4.5%
- By 2040
- 18,394 · -15.6%
- By 2050
- 15,981 · -26.7%
- By 2075
- 11,712 · -46.3%
- By 2100
- 7,651 · -64.9%
Race, ethnicity, and origin ACS 2023
- Neighborhood character
- Predominantly White (92%)
- Race & ethnicity
- White 92% Two or more races 6% Hispanic / Latino 3% Asian 2%
- Common ancestry
- Iranian 8% Romanian 7% Lithuanian 4%
- Foreign-born
- 2% · Canada
- Languages at home
- 98% English-only · Other Indo-European 2% Spanish 1%
Political lean MEDSL · Antrim
- 2024 margin
- Strong R (+23.8) · D 37.5% · R 61.2% · Other 1.2%
- 2008→2024 swing
- -13.4pp toward R · 2008: -10.3pp · 2024: -23.8pp
- All cycles
- 2024: R+23.8 2020: R+23.8 2016: R+29.6 2012: R+21.3 2008: R+10.3
Not yet ingested
- Civics
- —
Market trends
- HPI YoY
- ▼ -344.96%
- Current HPI
- 313.4269
- Rent YoY
- —
- Metro
- —
- State GDP YoY
- ▲ 1.37%
- F500 in state
- 28
Industry mix (Fortune 500 HQ in MI)
| Industry | F500 HQs | Revenue |
|---|---|---|
| Automotive Parts | 3 | $48B |
|
||
| Automotive | 2 | $372B |
|
||
| Chemicals | 1 | $45B |
|
||
| Automotive Retail | 1 | $29B |
|
||
| Healthcare / Medical Devices | 1 | $23B |
|
||
| Automotive Technology | 1 | $20B |
|
||
Price history
-1.9% since first listed5 events — show timeline
- 2026-04-20 Contingent — MiRealSource-MiMLS
- 2026-03-31 Relisted — MiRealSource-MiMLS
- 2026-03-14 Contingent — MiRealSource-MiMLS
- 2026-01-28 Price Changed $265,000 MiRealSource-MiMLS
- 2025-12-08 Listed $270,000 MiRealSource-MiMLS
Cash-flow waterfall
monthlySold comps — $/sqft
last 12 mo · ≤1 miLoading sold comps…