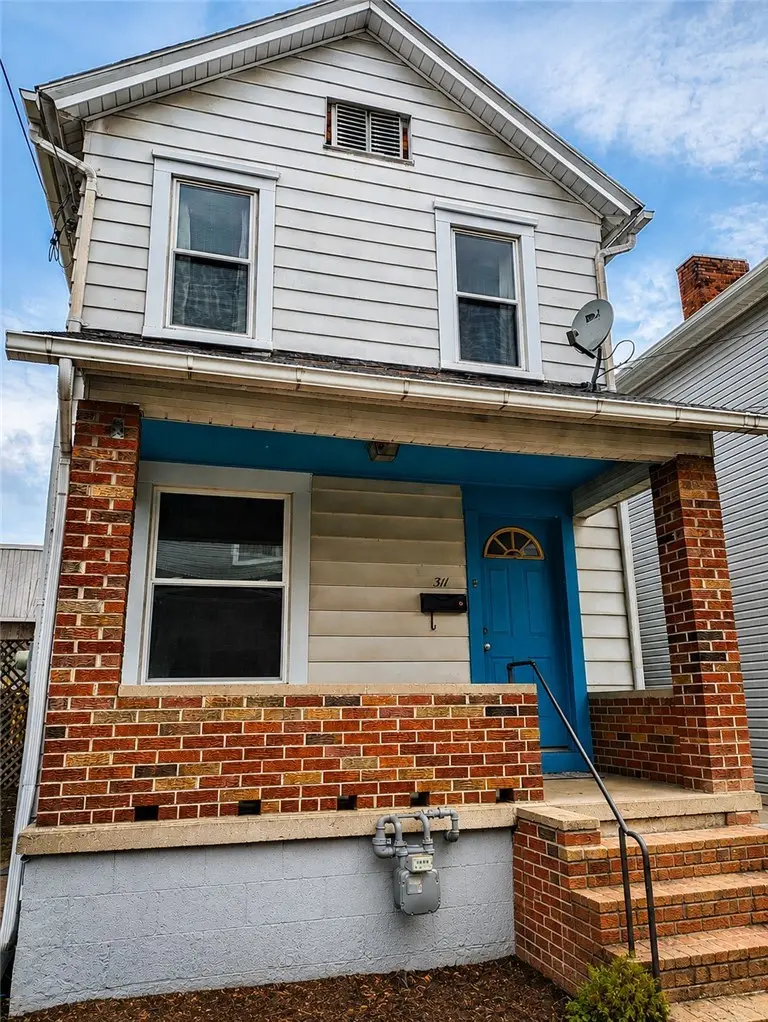
311 Strawberry Aly · New Brighton, PA
Flood risk 5/10 · Moderate
- FEMA flood zone
- X (unshaded)
- Chance of flooding over 30 yrs
- 0.24%
- Est. flood insurance / yr
- $473 – $860
Fire risk 1/10 · Minimal
- Est. fire insurance / yr
- $511 – $949
Heat risk 4/10 · Minor
- Hot days now (above 97°F)
- 8 days/yr
- Hot days in 30 yrs
- 19 days/yr
Wind risk 2/10 · Minimal
- Chance of severe wind over 30 yrs
- —
Air-quality risk 3/10 · Minor
- Unhealthy air days now
- 2 days/yr
- Unhealthy air days in 30 yrs
- 4 days/yr
Risk factors via First Street. Map © Google.
Why this score? — see what drove the B+ grade
The composite is a weighted blend of 9 inputs, each scored 0–100. Each bar is that input's sub-score; the figure is the points it added to the 100-point composite (weight × sub-score).
- Cash flow +30.0/30.0
- ARV discount +15.0/15.0
- 1% rule +10.0/10.0
- DSCR +10.0/10.0
- Livability +4.1/5.0
- Rent growth +2.5/5.0
- Condition / age +2.5/5.0
- Schools +2.3/10.0
- Appreciation +0.0/10.0
$60,000
🖨 Deal sheet 📄 Offer letter ✓ Due diligence
Listing remarks
A 2 bedroom, 2 bath home in the heart of New Brighton with tons of potential! This fixer-upper is the perfect opportunity for investors, flippers, or buyers looking to put their personal touch on a home. This property is ready for some love and TLC to truly shine! Conveniently located new the main street of New Brighton . Don't miss your chance to turn this hidden gem into something special!
Key facts
- 1,742 sq ft lot
- Parking
- Built 1910
Property features AI
Exterior
- Parking: Off-street parking (1 space)
- Utilities: Public water; Public sewer; Public power
- Home design: 2-story home; Vinyl siding; Asphalt roof
- Construction: Vinyl siding construction; Asphalt roof
- Exterior features: Small lot (0.04 acres)
Interior
- Kitchen: Kitchen on main level; Microwave; Refrigerator; Stove; Some gas appliances
- Bedrooms: Upper-level bedrooms (2)
- Flooring: Vinyl flooring; Carpet
- Bathrooms: 2 full bathrooms
- Heating & cooling: Gas heating
- Interior features: 5 total rooms; Basement with interior entry; Resale condition
Neighborhood map
What this means for you Summary
Snapshot
- This is a 2-bed/1.5-bath single-family listed at $60k.
Deal economics
- At list price, monthly cash flow is $276 ($3k/yr) — positive.
- The deal already cash-flows at list — no discount required.
- Meets the 1% rule at list price ($927 rent vs $60k).
Location & tenants
- Location reads 82/100 on livability (#153 in PA, #1,275 nationally) — a professional / high-income tenant draw. Strengths: commute A+, cost of living A+, housing A+; Watch: amenities F, employment D-.
- New Brighton Area SD (suburban): math 17% / reading 37% proficiency, ranked #458 of 539 in PA (top 85%) — low school quality limits family demand, transient renter base, plan for 1-2y turnover.
- Market conditions: 42 active listings in the ZIP; 9 comparable units currently listed for rent nearby; rentals leasing fast (median 2d on market — plan ~1-2 weeks tenant-placement turnaround); 272 units permitted in Beaver County in 2024 (80 in 5+ unit buildings).
- This rent is only 17% of the median local income ($64k/yr) — well below the 30% rent-burden line; pricing power to push rent on renewal without tenant pushback.
Forward outlook
- Local home prices are declining (-3.0%/yr); year-one equity from $415 of loan paydown is wiped out by about $2k of value loss. Plan a longer hold.
- Beaver County population projected at -14% by 2050 — secular population decline; favor cash flow + early exit over multi-decade hold.
- At projected returns (-3.0% appreciation + 3.0% rent growth), your $17k cash investment doubles in ~7 years — after that, you're playing with house money.
Negotiation context
- Only 12 days on market — expect competitive offers; lowballing is unlikely to land.
- Current owner paid $22k; list at $60k implies a 173% gain — meaningful room to come down on a strong offer.
Risks & watch-outs
- Watch-outs: built in 1910 — expect roof / HVAC / electrical / plumbing capex.
- Climate carrying-cost: moderate flood risk — expect insurance premiums to compound above CPI over the hold.
Questions for the listing agent
- Built in 1910 — when were the roof, HVAC, electrical panel, plumbing, and water heater last replaced?
- Is there a deadline driving the sale (1031 exchange, divorce, estate, relocation)? That informs how much negotiation room exists.
- What's the average days-on-market for RENTAL listings here right now (not sales)? A rising rental-DOM trend means longer vacancies and softer asking-rent achievability than the comps imply.
- What's the recent tenant-quality profile in this submarket — average credit score on applications, eviction rate, late-payment / NSF rate, and stable-employment percentage? A property-management company in the area should have these aggregated.
- How much new for-sale + rental construction is in the pipeline within 1–3 miles? Heavy new supply typically softens prices + rents 12–24 months out; constrained supply supports both.
Investment metrics
- 1% rule
- 1.55% ✓
- Cap rate
- 11.80%
- Cash-on-cash
- 19.69%
- DSCR
- 1.88
- GRM
- 5.4
CMA / ARV
- ARV (on-the-fly)
- $114,224
- Comps found
- 12
Show comp detail 12 sales within ~0.75 mi
| Address | Dist | Beds/Ba | Sqft | Sold | Price | $/sf | Match |
|---|---|---|---|---|---|---|---|
| 521 8th Ave | 0.18mi | 2/1.0 | 960 (-1%) | 15mo | $14,000 | $15 | 75 |
| 507 8th St | 0.22mi | 2/1.0 | 1,016 (+5%) | 10mo | $49,500 | $49 | 71 |
| 833 11th Ave | 0.41mi | 2/1.0 | 1,024 (+6%) | 2mo | $87,500 | $85 | 67 |
| 304 14th Ave | 0.45mi | 2/1.0 | 974 (+1%) | 13mo | $115,000 | $118 | 65 |
| 630 10th Ave | 0.27mi | 2/1.5 | 1,092 (+13%) | 7mo | $155,000 | $142 | 61 |
| 716 5th St | 0.71mi | 2/1.5 | 996 (+3%) | 5mo | $179,000 | $180 | 58 |
| 734 Grove Ave | 0.59mi | 2/1.0 | 960 (-1%) | 20mo | $115,000 | $120 | 52 |
| 1112 8th Ave | 0.51mi | 2/1.0 | 1,073 (+11%) | 8mo | $189,000 | $176 | 50 |
| 719 12th Ave | 0.39mi | 2/1.0 | 890 (-8%) | 20mo | $62,750 | $71 | 50 |
| 3009 33rd St | 0.71mi | 2/1.0 | 1,029 (+6%) | 11mo | $99,000 | $96 | 45 |
| 1626 2nd St | 0.64mi | 3/1.5 (+1) | 838 (-13%) | 14mo | $80,000 | $95 | 31 |
| 1630 2nd St | 0.65mi | 2/1.0 | 834 (-14%) | 20mo | $100,000 | $120 | 28 |
Match score weights: distance 35% · size 25% · config 20% · recency 20%. Top-matched comps best support the ARV.
Projected returns pro-forma
-3.0% appreciation · 3.0% rent growth · sell at horizon
- IRR
- 11.8%
- Equity multiple
- 1.47×
- Total profit
- $7,870
- Equity at exit
- $8,946
- IRR
- 20.8%
- Equity multiple
- 2.76×
- Total profit
- $29,617
- Equity at exit
- $5,188
Cash invested: $16,800 (down + closing). Projections, not guarantees.
Landlord ↔ Tenant lean methodology
- Overall (STATE)
- 62 Landlord-Friendly
- State Pennsylvania
- 62 Landlord-Friendly · EVEN
- County
- — inherits STATE
- City
- — inherits STATE
ZIP-level market 15066
- Home prices YoY
- -26.8%
- Active inventory
- 42
- Price-to-rent
- 5.4×
Monthly cashflow live
- Estimated rent
- $927 high interval (Pro) →
- Mortgage (P&I)
- −$315
- Tax from tax record
- −$117 /mo · $1,407/yr
- Insurance
- −$25
- HOA
- −$0
- Vacancy / Maint / Mgmt
- −$195
- Net cashflow
- $276
Break-even live
UW: 25.0% down · 7.5% · 30yr · 1.5% tax · 5.0% vac · 8.0% maint · 8.0% mgmt
Financing live
Cash to close
- Down payment
- $15,000
- Closing costs
- $1,800
- Reserves months
- —
- Total cash needed
- —
Loan-product check · same deal, 3 products live
Conventional
25% down · 7.5% · 30yr
- Down + closing
- —
- Monthly P&I
- —
- Monthly cashflow
- —
- DSCR
- —
- Eligible?
- —
Personal DTI + credit; lowest rate.
DSCR
20% down · 8.5% · 30yr
- Down + closing
- —
- Monthly P&I
- —
- Monthly cashflow
- —
- DSCR
- —
- Eligible?
- —
No personal income docs; deal must DSCR.
Hard money
10% down · 12.0% · 12mo
- Down + closing
- —
- Monthly P&I
- —
- Monthly cashflow
- —
- DSCR
- —
- Eligible?
- —
Short-term bridge; refi at stabilization.
Rent comps 9 comps
| Address | Beds | Baths | Sqft | Rent | $/sqft | DOM | Units | Dist |
|---|---|---|---|---|---|---|---|---|
| 516 3rd Ave New Brighton, PA | 1.0 | 1.0 | 600 | $800 | $1.33 | 1d | 1 | 0.05mi |
| 816 3rd Ave Apt 4 New Brighton, PA | 2.0 | 1.0 | 600 | $745 | $1.24 | 1d | 1 | 0.26mi |
| 1115 6th Ave Unit 302 Beaver Falls, PA | 1.0 | 1.0 | 600 | $699 | $1.17 | 1d | 1 | 1.01mi |
| 911 12th Ave Beaver Falls, PA | 2.0 | 1.0 | 812 | $850 | $1.05 | 1d | 1 | 1.01mi |
| 418 Darlington Rd Beaver Falls, PA | 2.0 | 1.5 | 975 | $1,350 | $1.38 | 12d | 1 | 1.06mi |
| 1320 4th Ave Beaver Falls, PA | 2.0 | 1.0 | 850 | $950 | $1.12 | 1d | 1 | 1.15mi |
| 1909 5th Ave New Brighton, PA | 2.0–3.0 | 1.0–2.0 | 807 | $1,191 | $1.48 | 1d | 3 | 1.22mi |
| 921 15th St Unit 3 Beaver Falls, PA | 2.0 | 1.0 | 800 | $949 | $1.19 | 43d | 1 | 1.29mi |
| 1613 4th Ave Beaver Falls, PA | 2.0 | 1.0 | 1016 | $1,200 | $1.18 | 1d | 1 | 1.34mi |
Listing history 9 events
-
2026-06-07status $60,000 Pending 12 DOM
-
2026-06-03days on market $60,000 Active 12 DOM
-
2026-06-02days on market $60,000 Active 11 DOM
-
2026-06-01days on market $60,000 Active 10 DOM
-
2026-05-31days on market $60,000 Active 9 DOM
-
2026-05-21$60,000 Active
-
2018-11-30soldstatus $22,000
-
1999-05-28soldstatus $23,000
-
1973-04-01soldstatus $7,000
ⓘ Source: listings_history table (triggers on properties + properties_extension) + one-shot
backfill from property_details.listing_events for pre-trigger history.
Tax reassessment forecast PA · Partial reset (capped growth)
- Current annual tax
- $1,407 · $117/mo
- Projected year-2 tax
- $1,407 · $117/mo
- Expected delta
- $0/yr ($0/mo · 0.0%)
ⓘ Screening estimate from a state-policy table — verify with the county assessor before closing.
Climate risk First Street
- Flood 5/10 Major FEMA zone X (unshaded) · 24% chance over 30 yrs
- Wildfire 1/10 Low
- Heat 4/10 Moderate 8 d/yr ≥97°F today · 19 d/yr by 30 yrs out
- Wind 2/10 Low
- Air quality 3/10 Moderate 2 unhealthy d/yr today · 4 by 30 yrs out
Nearby sold comps map
Loading sold comps map…
Walkable amenities ~0.75 mi
Loading nearby amenities…
Taxation est. · year 1
- Rental income
- $11,126
- − Mortgage interest
- −$3,361
- − Property taxes
- −$1,407
- − Insurance
- −$300
- − Repairs & maintenance
- −$890
- − Management
- −$890
- − Depreciation
- −$1,745
- Taxable income
- $2,533
- Est. tax owed @ 24.0%
- −$608
- After-tax cash flow
- $2,699/yr
For passive investors: Depreciation is non-cash, so a rental often shows a tax loss while cash-flowing — sheltering income. Rental losses are passive: they offset passive income freely, and up to $25,000/yr can offset ordinary (W-2) income if you actively participate and your MAGI is under $100k (phasing out to $0 by $150k); unused losses carry forward. On sale, claimed depreciation is recaptured at up to 25%, and gains may owe capital-gains tax (a 1031 exchange can defer both). Figures are a year-1 estimate at your 24.0% rate — not tax advice; consult a CPA.
Schools (NCES district)
- District
- New Brighton Area SD
- NCES district ID
- 4216530
- Math proficiency
- 17% ▼ -17.00%
- Reading proficiency
- 37% ▼ -22.00%
- Median HH income
- $41,579
- Composite
- 22.83/100
- National rank
- #8014
- State rank
- #458 of 539 in PA
Livability — New Brighton
- Score
- 82/100
- State rank
- #153
- US rank
- #1275
Category grades
Schools grade is shown separately in the Schools card above.
Census & demographics
- Census place
- New Brighton, PA
- County
- Beaver County · 116,001 people
- City population
- 12,048
- Metro
- Pittsburgh, PA
- Population (ZIP)
- 12,048
- Household income
- $63,836
- Rent vs Own
- Severe rent burden
- 187.0
Population outlook (Beaver County) Hauer SSP2
- Today (2025)
- 164,976 people
- By 2030
- 161,449 · -2.1%
- By 2040
- 151,752 · -8.0%
- By 2050
- 141,155 · -14.4%
- By 2075
- 118,142 · -28.4%
- By 2100
- 91,740 · -44.4%
Race, ethnicity, and origin ACS 2023
- Neighborhood character
- Predominantly White (87%)
- Race & ethnicity
- White 87% Black 5% Two or more races 4% Hispanic / Latino 3%
- Common ancestry
- Romanian 6% Serbian 2% Lithuanian 2%
- Foreign-born
- 0%
- Languages at home
- 98% English-only · Spanish 2%
Political lean MEDSL · Beaver
- 2024 margin
- Strong R (+20.7) · D 39.2% · R 59.9%
- 2008→2024 swing
- -17.9pp toward R · 2008: -2.8pp · 2024: -20.7pp
- All cycles
- 2024: R+20.7 2020: R+17.7 2016: R+20.1 2012: R+6.6 2008: R+2.8
Not yet ingested
- Civics
- —
Market trends
- HPI YoY
- ▼ -67.49%
- Current HPI
- 184.7104
- Rent YoY
- —
- Metro
- Pittsburgh, PA
- State GDP YoY
- ▲ 1.68%
- F500 in state
- 34
Industry mix (Fortune 500 HQ in PA)
| Industry | F500 HQs | Revenue |
|---|---|---|
| Healthcare | 2 | $309B |
|
||
| Insurance | 2 | $27B |
|
||
| Telecommunications / Media | 1 | $124B |
|
||
| Industrial Distribution | 1 | $22B |
|
||
| Financial Services | 1 | $20B |
|
||
| Chemicals / Materials | 1 | $18B |
|
||
Price history
+757.1% since first listed4 events — show timeline
- 2026-05-21 Listed $60,000 West Penn MLS
- 2018-11-30 Sold (Public Records) $22,000 Public Records
- 1999-05-28 Sold (Public Records) $23,000 Public Records
- 1973-04-01 Sold (Public Records) $7,000 Public Records
Property tax history
+2.0%/yrLatest (2026): $1,407 · +4.7% YoY. Source: county tax records.
Cash-flow waterfall
monthlySold comps — $/sqft
last 12 mo · ≤1 miLoading sold comps…