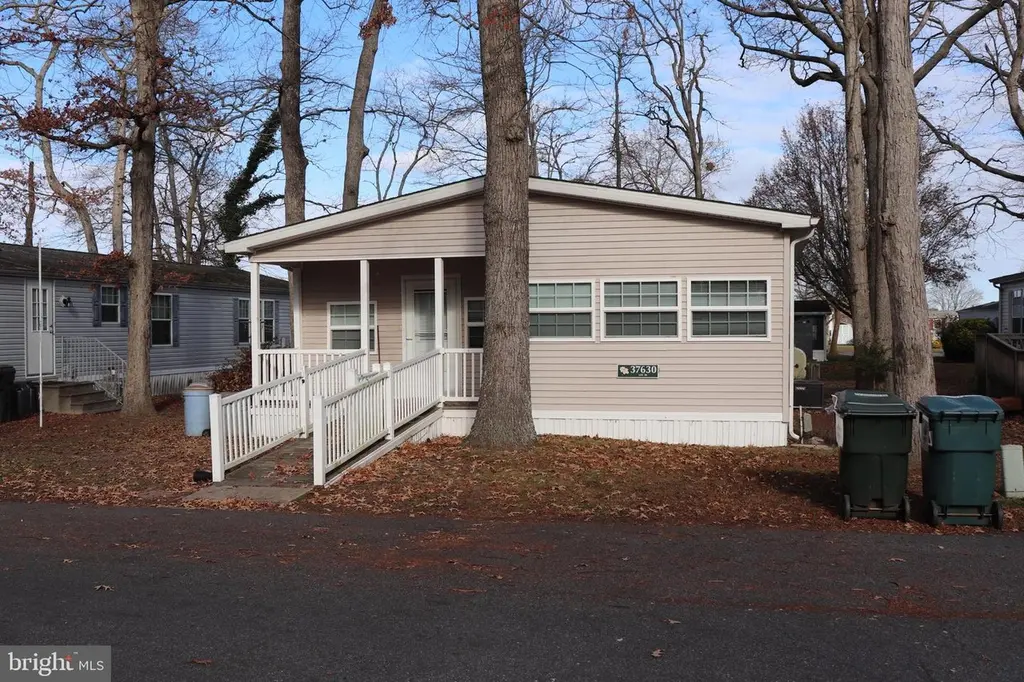
37630 W Shady Dr · Ocean City, MD
Flood risk No data
- FEMA flood zone
- —
- Chance of flooding over 30 yrs
- —
- Est. flood insurance / yr
- —
Fire risk No data
- Est. fire insurance / yr
- —
Heat risk No data
- Hot days now (above threshold)
- —
- Hot days in 30 yrs
- —
Wind risk No data
- Chance of severe wind over 30 yrs
- —
Air-quality risk No data
- Unhealthy air days now
- —
- Unhealthy air days in 30 yrs
- —
Risk factors via First Street. Map © Google.
Why this score? — see what drove the B+ grade
The composite is a weighted blend of 9 inputs, each scored 0–100. Each bar is that input's sub-score; the figure is the points it added to the 100-point composite (weight × sub-score).
- Cash flow +30.0/30.0
- ARV discount +15.0/15.0
- 1% rule +10.0/10.0
- DSCR +10.0/10.0
- Livability +3.7/5.0
- Schools +2.9/10.0
- Rent growth +2.5/5.0
- Condition / age +2.2/5.0
- Appreciation +0.0/10.0
$85,000
🖨 Deal sheet 📄 Offer letter ✓ Due diligence
Listing remarks MLS
Welcome to 37630 W Shady Dr, a good sized 2 bedroom, 2 bath home, with room for a possible 3rd bedroom, in the desirable community of Shady Park, only about 3 miles from the beaches of Fenwick Island, DE and Ocean City, MD. This home has plenty of room for guests including 2 living areas and 1 with a fireplace. The kitchen has plenty of cabinet space, a breakfast bar and a good sized dining area. Both baths have walk-in showers. The community has a waterfront picnic area, playground, dog park and access to a boat ramp for a small annual fee. This home is close to shopping, restaurants, beach, bay, golf courses and Freeman Arts Pavilion, which hosts a Summer Concert Series featuring local and national acts.
Key facts
- Dog park
- Walk-in showers
- Close to shopping
Tags
Neighborhood map
What this means for you Summary
Snapshot
- This is a 2-bed/2.0-bath manufactured listed at $85k. Condition is rated fair.
Deal economics
- At list price, monthly cash flow is $1k ($13k/yr) — positive.
- The deal already cash-flows at list — no discount required.
- Meets the 1% rule at list price ($2k rent vs $85k).
- Recommended offer: $75k (12.0% below list) — sets the bar for market timing.
- Cap rate 22.2% vs local median 1.4% in Ocean City — top-decile yield for the area; either an underpriced asset or a hidden risk that comps aren't pricing in. Stress-test before assuming the spread holds.
Location & tenants
- Location reads 73/100 on livability (#125 in MD) — a middle-class / working-renter tenant base. Strengths: commute A+, health & safety A+, schools B+; Watch: cost of living C-, crime F.
- Indian River School District (rural): math 25% / reading 41% proficiency, ranked #14 of 26 in DE (top 54%) — families likely to look elsewhere, expect single-tenant / working-renter base with shorter leases.
- Market conditions: 2 comparable units currently listed for rent nearby; 4,354 units permitted in Sussex County in 2024 (344 in 5+ unit buildings).
Forward outlook
- Local home prices are declining (-3.0%/yr); year-one equity from $588 of loan paydown is wiped out by about $3k of value loss. Plan a longer hold.
- Sussex County population projected at +25% by 2050 — long-run rental-demand tailwind backs the buy-and-hold thesis.
- At projected returns (-3.0% appreciation + 3.0% rent growth), your $24k cash investment doubles in ~3 years — after that, you're playing with house money.
Negotiation context
- It's been on market 184 days — a 12% lower offer ($75k) is reasonable based on typical stale-listing flexibility.
- 2 sale attempts; this cycle's ask has dropped $5k (6%) from the opening price — seller is motivated, your offer sets the floor, not the list.
Questions for the listing agent
- It's been on market 184 days. Have you received any prior offers? Is the seller open to a 12% concession, seller financing, or rate buy-down credit?
- Have any recent inspections been done? Can we get a copy of the seller's disclosures and any deferred-maintenance estimates?
- Built in 1976 — when were the roof, HVAC, electrical panel, plumbing, and water heater last replaced?
- What does the HOA fee cover, when was the last increase, and are there any pending special assessments or reserve-fund shortfalls?
- Why hasn't it sold? Are there any deal-killer items the seller is aware of (foundation, flood, title, zoning, code violations)?
- Is there a deadline driving the sale (1031 exchange, divorce, estate, relocation)? That informs how much negotiation room exists.
- Schools are B-rated — typically a magnet for longer-tenancy family renters. What's the average tenant stay here, and is there a school-zone premium baked into asking?
- Crime grade is F in this area — have there been break-ins, vandalism, or insurance claims at this property in the last 3 years? What carrier currently insures it and at what premium?
- What's the average days-on-market for RENTAL listings here right now (not sales)? A rising rental-DOM trend means longer vacancies and softer asking-rent achievability than the comps imply.
- What's the recent tenant-quality profile in this submarket — average credit score on applications, eviction rate, late-payment / NSF rate, and stable-employment percentage? A property-management company in the area should have these aggregated.
- How much new for-sale + rental construction is in the pipeline within 1–3 miles? Heavy new supply typically softens prices + rents 12–24 months out; constrained supply supports both.
Investment metrics
- 1% rule
- 2.55% ✓
- Cap rate
- 22.17%
- Cash-on-cash
- 56.70%
- DSCR
- 3.52
- GRM
- 3.3
CMA / ARV
- ARV (median comp)
- $140,000
- List price
- $85,000
- Delta
- -39.29%
- Verdict
- UNDERPRICED
- Comps
- 20 within 1.0 mi
Show comp detail 1 sale within ~0.75 mi
| Address | Dist | Beds/Ba | Sqft | Sold | Price | $/sf | Match |
|---|---|---|---|---|---|---|---|
| 37597 Shady Cir | 0.14mi | 2/1.0 | 1,000 (0%) | 10mo | $70,000 | $70 | 81 |
Match score weights: distance 35% · size 25% · config 20% · recency 20%. Top-matched comps best support the ARV.
Projected returns pro-forma
-3.0% appreciation · 3.0% rent growth · sell at horizon
- IRR
- 55.1%
- Equity multiple
- 3.43×
- Total profit
- $57,890
- Equity at exit
- $12,674
- IRR
- 60.2%
- Equity multiple
- 7.00×
- Total profit
- $142,782
- Equity at exit
- $7,349
Cash invested: $23,800 (down + closing). Projections, not guarantees.
Landlord ↔ Tenant lean methodology
- Overall (STATE)
- 27 Tenant-Leaning
- State Maryland
- 27 Tenant-Leaning · D+14
- County
- — inherits STATE
- City
- — inherits STATE
ZIP-level market 19975
- Home prices YoY
- -11.2%
- Price-to-rent
- 3.3×
Monthly cashflow live
- Estimated rent
- $2,170 medium interval (Pro) →
- Mortgage (P&I)
- −$446
- Tax est. 1.5%
- −$106 /mo · $1,275/yr
- Insurance
- −$35
- HOA
- −$2
- Vacancy / Maint / Mgmt
- −$456
- Net cashflow
- $1,125
Break-even live
UW: 25.0% down · 7.5% · 30yr · 1.5% tax · 5.0% vac · 8.0% maint · 8.0% mgmt
Financing live
Cash to close
- Down payment
- $21,250
- Closing costs
- $2,550
- Reserves months
- —
- Total cash needed
- —
Loan-product check · same deal, 3 products live
Conventional
25% down · 7.5% · 30yr
- Down + closing
- —
- Monthly P&I
- —
- Monthly cashflow
- —
- DSCR
- —
- Eligible?
- —
Personal DTI + credit; lowest rate.
DSCR
20% down · 8.5% · 30yr
- Down + closing
- —
- Monthly P&I
- —
- Monthly cashflow
- —
- DSCR
- —
- Eligible?
- —
No personal income docs; deal must DSCR.
Hard money
10% down · 12.0% · 12mo
- Down + closing
- —
- Monthly P&I
- —
- Monthly cashflow
- —
- DSCR
- —
- Eligible?
- —
Short-term bridge; refi at stabilization.
Rent comps 2 comps
| Address | Beds | Baths | Sqft | Rent | $/sqft | DOM | Units | Dist |
|---|---|---|---|---|---|---|---|---|
| 37057 Mallard Dr Selbyville, DE | 3.0 | 2.0 | 1416 | $2,300 | $1.62 | 43d | 1 | 0.55mi |
| 38256 Hummingbird Ln #214 Selbyville, DE | 2.0 | 1.5 | 900 | $2,000 | $2.22 | 21d | 1 | 0.91mi |
HOA detail
- Monthly dues
- $2 · $24/yr
- Likely covers
- water
Listing history 18 events
-
2026-06-18days on market $85,000 Active 184 DOM
-
2026-06-17days on market $85,000 Active 183 DOM
-
2026-06-16days on market $85,000 Active 182 DOM
-
2026-06-15days on market $85,000 Active 181 DOM
-
2026-06-14days on market $85,000 Active 179 DOM
-
2026-06-13days on market $85,000 Active 178 DOM
-
2026-06-10days on market $85,000 Active 176 DOM
-
2026-06-09days on market $85,000 Active 175 DOM
-
2026-06-08days on market $85,000 Active 174 DOM
-
2026-06-07days on market $85,000 Active 173 DOM
-
2026-06-02days on market $85,000 Active 168 DOM
-
2026-06-01days on market $85,000 Active 167 DOM
-
2026-05-31days on market $85,000 Active 166 DOM
-
2026-05-30days on market $85,000 Active 165 DOM
-
2026-03-27price $85,000 715-char remark
Show marketing remark (715 chars)
Welcome to 37630 W Shady Dr, a good sized 2 bedroom, 2 bath home, with room for a possible 3rd bedroom, in the desirable community of Shady Park, only about 3 miles from the beaches of Fenwick Island, DE and Ocean City, MD. This home has plenty of room for guests including 2 living areas and 1 with a fireplace. The kitchen has plenty of cabinet space, a breakfast bar and a good sized dining area. Both baths have walk-in showers. The community has a waterfront picnic area, playground, dog park and access to a boat ramp for a small annual fee. This home is close to shopping, restaurants, beach, bay, golf courses and Freeman Arts Pavilion, which hosts a Summer Concert Series featuring local and national acts.
-
2025-12-17status Active 715-char remark
Show marketing remark (715 chars)
Welcome to 37630 W Shady Dr, a good sized 2 bedroom, 2 bath home, with room for a possible 3rd bedroom, in the desirable community of Shady Park, only about 3 miles from the beaches of Fenwick Island, DE and Ocean City, MD. This home has plenty of room for guests including 2 living areas and 1 with a fireplace. The kitchen has plenty of cabinet space, a breakfast bar and a good sized dining area. Both baths have walk-in showers. The community has a waterfront picnic area, playground, dog park and access to a boat ramp for a small annual fee. This home is close to shopping, restaurants, beach, bay, golf courses and Freeman Arts Pavilion, which hosts a Summer Concert Series featuring local and national acts.
-
2025-12-11historical 715-char remark
Show marketing remark (715 chars)
Welcome to 37630 W Shady Dr, a good sized 2 bedroom, 2 bath home, with room for a possible 3rd bedroom, in the desirable community of Shady Park, only about 3 miles from the beaches of Fenwick Island, DE and Ocean City, MD. This home has plenty of room for guests including 2 living areas and 1 with a fireplace. The kitchen has plenty of cabinet space, a breakfast bar and a good sized dining area. Both baths have walk-in showers. The community has a waterfront picnic area, playground, dog park and access to a boat ramp for a small annual fee. This home is close to shopping, restaurants, beach, bay, golf courses and Freeman Arts Pavilion, which hosts a Summer Concert Series featuring local and national acts.
-
2025-12-10$90,000 Active 715-char remark
Show marketing remark (715 chars)
Welcome to 37630 W Shady Dr, a good sized 2 bedroom, 2 bath home, with room for a possible 3rd bedroom, in the desirable community of Shady Park, only about 3 miles from the beaches of Fenwick Island, DE and Ocean City, MD. This home has plenty of room for guests including 2 living areas and 1 with a fireplace. The kitchen has plenty of cabinet space, a breakfast bar and a good sized dining area. Both baths have walk-in showers. The community has a waterfront picnic area, playground, dog park and access to a boat ramp for a small annual fee. This home is close to shopping, restaurants, beach, bay, golf courses and Freeman Arts Pavilion, which hosts a Summer Concert Series featuring local and national acts.
ⓘ Source: listings_history table (triggers on properties + properties_extension) + one-shot
backfill from property_details.listing_events for pre-trigger history.
Nearby sold comps map
Loading sold comps map…
Walkable amenities ~0.75 mi
Loading nearby amenities…
Taxation est. · year 1
- Rental income
- $26,036
- − Mortgage interest
- −$4,761
- − Property taxes
- −$1,275
- − Insurance
- −$425
- − Repairs & maintenance
- −$2,083
- − Management
- −$2,083
- − HOA
- −$24
- − Depreciation
- −$2,473
- Taxable income
- $12,913
- Est. tax owed @ 24.0%
- −$3,099
- After-tax cash flow
- $10,397/yr
For passive investors: Depreciation is non-cash, so a rental often shows a tax loss while cash-flowing — sheltering income. Rental losses are passive: they offset passive income freely, and up to $25,000/yr can offset ordinary (W-2) income if you actively participate and your MAGI is under $100k (phasing out to $0 by $150k); unused losses carry forward. On sale, claimed depreciation is recaptured at up to 25%, and gains may owe capital-gains tax (a 1031 exchange can defer both). Figures are a year-1 estimate at your 24.0% rate — not tax advice; consult a CPA.
Condition & rehab AI · 12 photos
This manufactured home requires moderate renovations to update the kitchen and bathrooms, and paint the interior walls. These updates would significantly improve its resale value.
Repairs flagged
- Moderate kitchen cabinets — outdated and in need of replacement
- Moderate kitchen countertops — dated and in need of replacement
- Minor bathroom fixtures — standard fixtures that could be updated
Value-add opportunities
- Resale paint interior walls — fresh paint can improve curb appeal
- Resale replace kitchen cabinets and countertops — new cabinets and countertops can significantly improve the kitchen's appearance
- Resale update bathroom fixtures — new fixtures can enhance the bathroom's functionality and appearance
Renovation cost estimate screening
| Repair item | Severity | Est. cost |
|---|---|---|
| kitchen cabinets · outdated and in need of replacement | Moderate | $3,000–15,000 |
| kitchen countertops · dated and in need of replacement | Moderate | $3,000–15,000 |
| bathroom fixtures · standard fixtures that could be updated | Minor | $500–3,000 |
| Total estimated repair cost · 3 items | $6,500–33,000 |
Value-add ROI direction
- Resale paint interior walls — fresh paint can improve curb appeal ↑
- Resale replace kitchen cabinets and countertops — new cabinets and countertops can significantly improve the kitchen's appearance ↑
- Resale update bathroom fixtures — new fixtures can enhance the bathroom's functionality and appearance ↑
ⓘ Cost ranges are severity-bucket heuristics (US national rule-of-thumb). Get contractor quotes + a written scope before underwriting a rehab budget.
Schools (NCES district)
- District
- Indian River School District
- NCES district ID
- 1000680
- Math proficiency
- 25% ▼ -27.00%
- Reading proficiency
- 41% ▼ -17.00%
- Median HH income
- $53,838
- Composite
- 28.99/100
- National rank
- #6620
- State rank
- #14 of 26 in DE
Livability — Ocean City
- Score
- 73/100
- State rank
- #125
- US rank
- #5407
Category grades
Schools grade is shown separately in the Schools card above.
Census & demographics
- Population (ZIP)
- 10,356
Population outlook (Sussex County) Hauer SSP2
- Today (2025)
- 248,853 people
- By 2030
- 264,464 · +6.3%
- By 2040
- 290,980 · +16.9%
- By 2050
- 311,259 · +25.1%
- By 2075
- 352,488 · +41.6%
- By 2100
- 367,406 · +47.6%
Race, ethnicity, and origin ACS 2023
- Neighborhood character
- Predominantly White (86%)
- Race & ethnicity
- White 86% Hispanic / Latino 8% Two or more races 7% Black 3%
- Hispanic origin (detail)
- Mexican 4%
- Common ancestry
- Romanian 4% Slovak 4% Russian 2%
- Foreign-born
- 8% · Canada
- Languages at home
- 89% English-only · Spanish 8% Other Indo-European 2% Russian/Polish/Slavic 1%
Political lean MEDSL · Sussex
- 2024 margin
- R (+11.0) · D 43.9% · R 54.9% · Other 1.2%
- 2008→2024 swing
- -2.4pp toward R · 2008: -8.6pp · 2024: -11.0pp
- All cycles
- 2024: R+11.0 2020: R+11.2 2016: R+22.0 2012: R+13.0 2008: R+8.6
Not yet ingested
- Civics
- —
Market trends
- HPI YoY
- ▼ -43.61%
- Current HPI
- 345.1746
- Rent YoY
- —
- Metro
- —
- State GDP YoY
- ▲ 2.97%
- F500 in state
- 12
Industry mix (Fortune 500 HQ in MD)
| Industry | F500 HQs | Revenue |
|---|---|---|
| Aerospace / Defense | 1 | $71B |
|
||
| Utilities | 1 | $25B |
|
||
| Hotels | 1 | $24B |
|
||
| Consumer Goods | 1 | $7B |
|
||
| Real Estate | 1 | $6B |
|
||
| Chemicals | 1 | $2B |
|
||
Price history
-5.6% since first listed4 events — show timeline
- 2026-03-27 Price Changed $85,000 BRIGHT MLS
- 2025-12-17 Relisted — BRIGHT MLS
- 2025-12-11 Listing Removed — BRIGHT MLS
- 2025-12-10 Listed $90,000 BRIGHT MLS
Property tax history
-14.0%/yrLatest (2025): $137 · -38.7% YoY. Source: county tax records.
Cash-flow waterfall
monthlySold comps — $/sqft
last 12 mo · ≤1 miLoading sold comps…