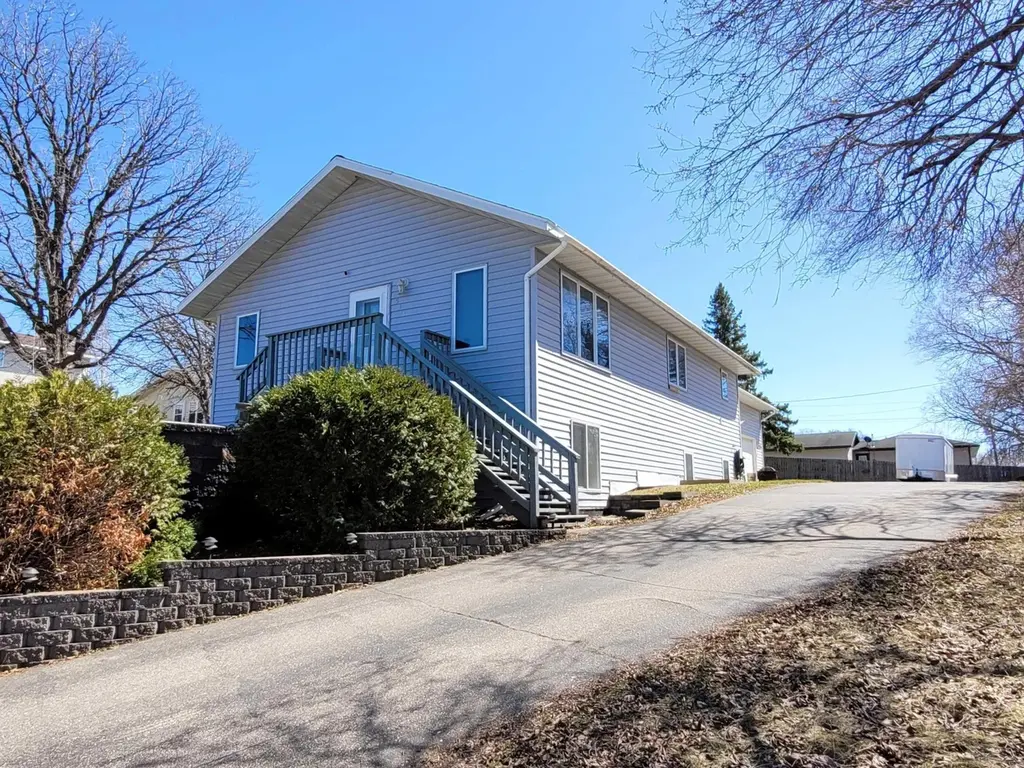
513 North St E · Detroit Lakes, MN
Flood risk 1/10 · Minimal
- FEMA flood zone
- X
- Chance of flooding over 30 yrs
- 0.0%
- Est. flood insurance / yr
- $473 – $860
Fire risk 5/10 · Moderate
- Est. fire insurance / yr
- $888 – $1,650
Heat risk 1/10 · Minimal
- Hot days now (above 96°F)
- 7 days/yr
- Hot days in 30 yrs
- 12 days/yr
Wind risk 1/10 · Minimal
- Chance of severe wind over 30 yrs
- —
Air-quality risk 2/10 · Minimal
- Unhealthy air days now
- 2 days/yr
- Unhealthy air days in 30 yrs
- 2 days/yr
Risk factors via First Street. Map © Google.
Why this score? — see what drove the D+ grade
The composite is a weighted blend of 9 inputs, each scored 0–100. Each bar is that input's sub-score; the figure is the points it added to the 100-point composite (weight × sub-score).
- Cash flow +16.0/30.0
- ARV discount +7.5/15.0
- DSCR +4.9/10.0
- Schools +4.0/10.0
- Livability +4.0/5.0
- 1% rule +3.6/10.0
- Rent growth +2.5/5.0
- Condition / age +2.5/5.0
- Appreciation +0.0/10.0
$299,000
🖨 Deal sheet 📄 Offer letter ✓ Due diligence
Listing remarks
No more rambling through listings, this rambler deserves your attention! Welcome to this inviting rambler-style home offering comfortable living with a finished lower level and plenty of space to enjoy. Featuring 4 bedrooms, 2 bathrooms, and an attached oversized 2-stall garage, this home provides both functionality and room to spread out. The main level offers 1,170 sq. ft. and welcomes you with 2 bedrooms, a spacious full bathroom, and a versatile main-level laundry area that could also serve as a home office. The desirable kitchen flows seamlessly into the dining area and living room, creating a great layout for everyday living and easy entertaining. The lower level adds another 1,170 sq
Key facts
- 0.29 acre lot
- 2 garage spots
- Built 2001
Property features AI
Finance
- HOA & community: Other annual assessment noted
Exterior
- Parking: Attached insulated garage with garage door opener; 2 garage spaces; Asphalt driveway
- Utilities: City water connected; City sewer connected; Electric and natural gas service
- Home design: Residential property; One story (main level plus lower/finished basement); Above- and below-grade finished living areas
- Construction: Foundation: Other; Foundation area reported; Vinyl siding
- Exterior features: Vinyl exterior; Lot approximately 75 x 150
Interior
- Kitchen: Range; Microwave; Dishwasher; Refrigerator; Electric water heater
- Bedrooms: 4 bedrooms (main and lower levels)
- Bathrooms: 2 full bathrooms (one on the main floor, one in the basement)
- Heating & cooling: Baseboard heating; Fireplace heating; No central air
- Interior features: Wood basement; Has a gas fireplace in the family room
- Laundry & utility: Laundry room on lower level; Dryer; Owned water softener
Neighborhood map
What this means for you Summary
Snapshot
- This is a 2-bed/1.0-bath single-family listed at $299k.
Deal economics
- At list price, monthly cash flow is $148 ($2k/yr) — positive.
- The deal already cash-flows at list — no discount required.
- To meet the 1% rule (rent ≥ 1% of price), the offer needs to be $258k (13.8% below list).
- Recommended offer: $258k (13.8% below list) — sets the bar for 1% rule.
- Cap rate 6.9% vs local median 5.2% in Detroit Lakes — top-decile yield for the area; either an underpriced asset or a hidden risk that comps aren't pricing in. Stress-test before assuming the spread holds.
Location & tenants
- Location reads 80/100 on livability (#78 in MN, #1,847 nationally) — a professional / high-income tenant draw. Strengths: housing A+, health & safety A+, cost of living A; Watch: amenities F, commute F.
- Detroit Lakes Public School District (town): math 44% / reading 50% proficiency, ranked #155 of 301 in MN (top 52%) — families likely to look elsewhere, expect single-tenant / working-renter base with shorter leases.
- Market conditions: 301 active listings in the ZIP; 156 units permitted in Becker County in 2024 (0 in 5+ unit buildings).
Forward outlook
- Local home prices are declining (-3.0%/yr); year-one equity from $2k of loan paydown is wiped out by about $9k of value loss. Plan a longer hold.
- Becker County population projected at +4% by 2050 — modest demand growth; plan on rents tracking national, not racing it.
Negotiation context
- It's been on market 79 days — a 6% lower offer ($281k) is reasonable based on typical stale-listing flexibility.
- Current owner paid $157k; list at $299k implies a 90% gain — meaningful room to come down on a strong offer.
Risks & watch-outs
- Climate carrying-cost: moderate wildfire risk — expect insurance premiums to compound above CPI over the hold.
Questions for the listing agent
- It's been on market 79 days. Have you received any prior offers? Is the seller open to a 14% concession, seller financing, or rate buy-down credit?
- Why hasn't it sold? Are there any deal-killer items the seller is aware of (foundation, flood, title, zoning, code violations)?
- Is there a deadline driving the sale (1031 exchange, divorce, estate, relocation)? That informs how much negotiation room exists.
- Schools are B-rated — typically a magnet for longer-tenancy family renters. What's the average tenant stay here, and is there a school-zone premium baked into asking?
- The area grade is low — what's the realistic commute time and amenity access for the typical tenant pool here? Any planned neighborhood developments (good or bad) we should know about?
- What's the average days-on-market for RENTAL listings here right now (not sales)? A rising rental-DOM trend means longer vacancies and softer asking-rent achievability than the comps imply.
- What's the recent tenant-quality profile in this submarket — average credit score on applications, eviction rate, late-payment / NSF rate, and stable-employment percentage? A property-management company in the area should have these aggregated.
- How much new for-sale + rental construction is in the pipeline within 1–3 miles? Heavy new supply typically softens prices + rents 12–24 months out; constrained supply supports both.
Investment metrics
- 1% rule
- 0.86% ✗
- Cap rate
- 6.89%
- Cash-on-cash
- 2.12%
- DSCR
- 1.09
- GRM
- 9.7
CMA / ARV
No comps found within radius.
Projected returns pro-forma
-3.0% appreciation · 3.0% rent growth · sell at horizon
- IRR
- -13.0%
- Equity multiple
- 0.53×
- Total profit
- $-39,088
- Equity at exit
- $44,582
- IRR
- -4.0%
- Equity multiple
- 0.74×
- Total profit
- $-22,178
- Equity at exit
- $25,852
Cash invested: $83,720 (down + closing). Projections, not guarantees.
Landlord ↔ Tenant lean methodology
- Overall (STATE)
- 46 Balanced
- State Minnesota
- 46 Balanced · D+2
- County
- — inherits STATE
- City
- — inherits STATE
ZIP-level market 56501
- Active inventory
- 301
- Price-to-rent
- 9.7×
Monthly cashflow live
- Estimated rent
- $2,577 medium interval (Pro) →
- Mortgage (P&I)
- −$1,568
- Tax from tax record
- −$195 /mo · $2,338/yr
- Insurance
- −$125
- HOA
- −$0
- Vacancy / Maint / Mgmt
- −$541
- Net cashflow
- $148
Break-even live
UW: 25.0% down · 7.5% · 30yr · 1.5% tax · 5.0% vac · 8.0% maint · 8.0% mgmt
Financing live
Cash to close
- Down payment
- $74,750
- Closing costs
- $8,970
- Reserves months
- —
- Total cash needed
- —
Loan-product check · same deal, 3 products live
Conventional
25% down · 7.5% · 30yr
- Down + closing
- —
- Monthly P&I
- —
- Monthly cashflow
- —
- DSCR
- —
- Eligible?
- —
Personal DTI + credit; lowest rate.
DSCR
20% down · 8.5% · 30yr
- Down + closing
- —
- Monthly P&I
- —
- Monthly cashflow
- —
- DSCR
- —
- Eligible?
- —
No personal income docs; deal must DSCR.
Hard money
10% down · 12.0% · 12mo
- Down + closing
- —
- Monthly P&I
- —
- Monthly cashflow
- —
- DSCR
- —
- Eligible?
- —
Short-term bridge; refi at stabilization.
Listing history 12 events
-
2026-06-07statusdays on market $299,000 Pending 79 DOM
-
2026-06-04days on market $299,000 Contingent - Subject to Financing 78 DOM
-
2026-06-02days on market $299,000 Contingent - Subject to Financing 77 DOM
-
2026-06-01days on market $299,000 Contingent - Subject to Financing 76 DOM
-
2026-05-31days on market $299,000 Contingent - Subject to Financing 75 DOM
-
2026-05-31days on market $299,000 Contingent - Subject to Financing 74 DOM
-
2026-04-18historical Contingent - Inspection
-
2026-03-17$299,000 Active
-
2015-11-03soldstatus $157,000
-
2013-08-05soldstatus $145,500
-
2007-02-22soldstatus $127,000
-
2003-05-12soldstatus $108,150
ⓘ Source: listings_history table (triggers on properties + properties_extension) + one-shot
backfill from property_details.listing_events for pre-trigger history.
Tax reassessment forecast MN · Partial reset (capped growth)
- Current annual tax
- $2,338 · $195/mo
- Projected year-2 tax
- $2,843 · $237/mo
- Expected delta
- +$505/yr (+$42/mo · 21.6%)
ⓘ Screening estimate from a state-policy table — verify with the county assessor before closing.
Climate risk First Street
- Flood 1/10 Low FEMA zone X · 0% chance over 30 yrs
- Wildfire 5/10 Major
- Heat 1/10 Low 7 d/yr ≥96°F today · 12 d/yr by 30 yrs out
- Wind 1/10 Low
- Air quality 2/10 Low 2 unhealthy d/yr today · 2 by 30 yrs out
Nearby sold comps map
Loading sold comps map…
Walkable amenities ~0.75 mi
Loading nearby amenities…
Taxation est. · year 1
- Rental income
- $30,919
- − Mortgage interest
- −$16,749
- − Property taxes
- −$2,338
- − Insurance
- −$1,495
- − Repairs & maintenance
- −$2,474
- − Management
- −$2,474
- − Depreciation
- −$8,698
- Taxable loss
- −$3,308
- Est. tax savings @ 24.0%
- +$794
- After-tax cash flow
- $2,571/yr
For passive investors: Depreciation is non-cash, so a rental often shows a tax loss while cash-flowing — sheltering income. Rental losses are passive: they offset passive income freely, and up to $25,000/yr can offset ordinary (W-2) income if you actively participate and your MAGI is under $100k (phasing out to $0 by $150k); unused losses carry forward. On sale, claimed depreciation is recaptured at up to 25%, and gains may owe capital-gains tax (a 1031 exchange can defer both). Figures are a year-1 estimate at your 24.0% rate — not tax advice; consult a CPA.
Schools (NCES district)
- District
- Detroit Lakes Public School District
- NCES district ID
- 2710230
- Math proficiency
- 44% ▼ -11.00%
- Reading proficiency
- 50% ▼ -11.00%
- Median HH income
- $50,571
- Composite
- 40.33/100
- National rank
- #3746
- State rank
- #155 of 301 in MN
Livability — Detroit Lakes
- Score
- 80/100
- State rank
- #78
- US rank
- #1847
Category grades
Schools grade is shown separately in the Schools card above.
Census & demographics
- Census place
- Detroit Lakes, MN
- City population
- 18,239
- Population (ZIP)
- 18,239
Population outlook (Becker County) Hauer SSP2
- Today (2025)
- 34,604 people
- By 2030
- 35,095 · +1.4%
- By 2040
- 35,691 · +3.1%
- By 2050
- 35,869 · +3.7%
- By 2075
- 36,103 · +4.3%
- By 2100
- 32,798 · -5.2%
Race, ethnicity, and origin ACS 2023
- Neighborhood character
- Predominantly White (91%)
- Race & ethnicity
- White 91% Two or more races 5% Native American 2%
- Common ancestry
- Portuguese 25% Scottish 4% Lithuanian 3%
- Foreign-born
- 1% · Canada
- Languages at home
- 98% English-only · Spanish 1%
Political lean MEDSL · Becker
- 2024 margin
- Solid R (+33.1) · D 32.7% · R 65.8% · Other 1.5%
- 2008→2024 swing
- -26.3pp toward R · 2008: -6.9pp · 2024: -33.1pp
- All cycles
- 2024: R+33.1 2020: R+30.1 2016: R+33.2 2012: R+14.6 2008: R+6.9
Not yet ingested
- Civics
- —
Market trends
- HPI YoY
- ▼ -222.40%
- Current HPI
- 217.4973
- Rent YoY
- —
- Metro
- —
- State GDP YoY
- ▲ 2.41%
- F500 in state
- 34
Industry mix (Fortune 500 HQ in MN)
| Industry | F500 HQs | Revenue |
|---|---|---|
| Healthcare | 2 | $407B |
|
||
| Retail | 2 | $150B |
|
||
| Consumer Goods | 2 | $32B |
|
||
| Industrial Machinery | 2 | $6B |
|
||
| Agriculture | 1 | $40B |
|
||
| Healthcare / Medical Devices | 1 | $32B |
|
||
Price history
+176.5% since first listed6 events — show timeline
- 2026-04-18 Contingent — NORTHSTARMLS as Distributed by MLS Grid
- 2026-03-17 Listed $299,000 NORTHSTARMLS as Distributed by MLS Grid
- 2015-11-03 Sold (Public Records) $157,000 Public Records
- 2013-08-05 Sold (Public Records) $145,500 Public Records
- 2007-02-22 Sold (Public Records) $127,000 Public Records
- 2003-05-12 Sold (Public Records) $108,150 Public Records
Property tax history
+4.5%/yrLatest (2025): $2,338 · -6.3% YoY. Source: county tax records.
Cash-flow waterfall
monthlySold comps — $/sqft
last 12 mo · ≤1 miLoading sold comps…