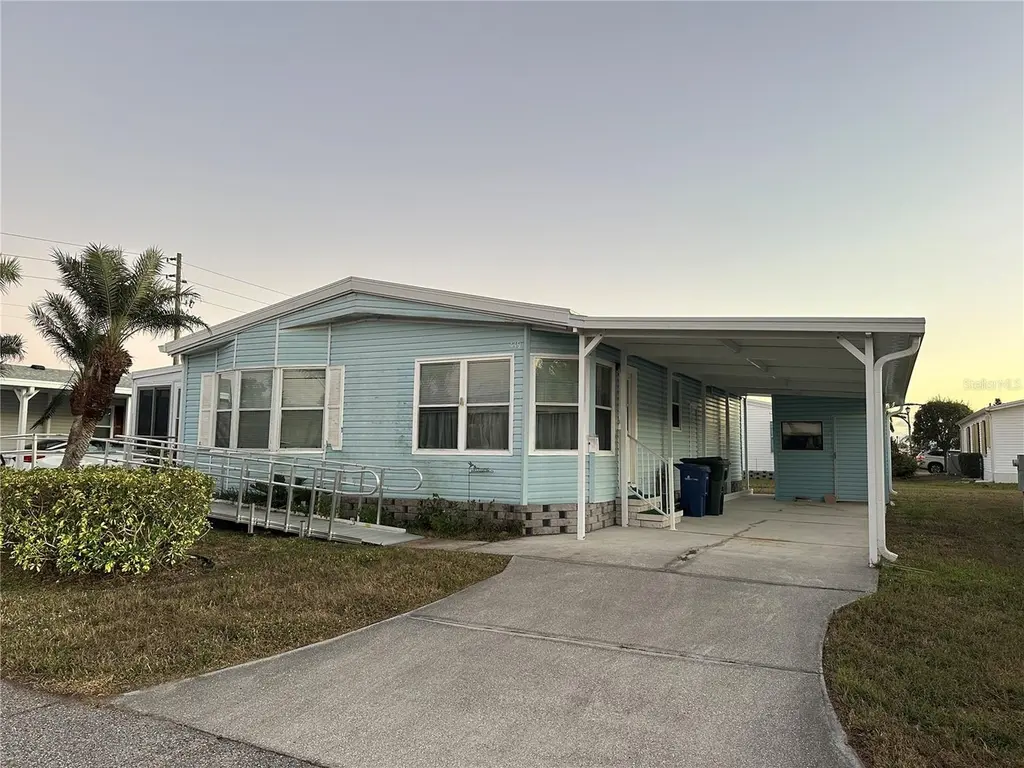
449 Landsedge Dr · Warm Mineral Springs, FL
Flood risk 9/10 · Severe
- FEMA flood zone
- AE
- Chance of flooding over 30 yrs
- 0.99%
- Est. flood insurance / yr
- $1,737 – $8,500
Fire risk 6/10 · Moderate
- Est. fire insurance / yr
- $947 – $1,759
Heat risk 10/10 · Severe
- Hot days now (above 107°F)
- 7 days/yr
- Hot days in 30 yrs
- 28 days/yr
Wind risk 10/10 · Severe
- Chance of severe wind over 30 yrs
- 99.0%
Air-quality risk 2/10 · Minimal
- Unhealthy air days now
- 1 days/yr
- Unhealthy air days in 30 yrs
- 1 days/yr
Risk factors via First Street. Map © Google.
Why this score? — see what drove the B- grade
The composite is a weighted blend of 9 inputs, each scored 0–100. Each bar is that input's sub-score; the figure is the points it added to the 100-point composite (weight × sub-score).
- Cash flow +26.5/30.0
- 1% rule +9.4/10.0
- DSCR +9.0/10.0
- ARV discount +7.5/15.0
- Schools +5.4/10.0
- Livability +3.3/5.0
- Rent growth +2.6/5.0
- Condition / age +2.5/5.0
- Appreciation +0.0/10.0
$119,000
🖨 Deal sheet 📄 Offer letter ✓ Due diligence
Listing remarks MLS
Located in the award-winning 55+ community of Harbor Isles in North Port, this double-wide manufactured home offers a great opportunity to create your own Florida retreat. The home is functional and well laid out, featuring generous living spaces, but is ready for cosmetic updates and a little TLC—perfect for buyers who want to add their own finishing touches and build instant equity. A new roof installed in 2025 provides peace of mind and adds significant value. Enjoy the Harbor Isles lifestyle with resort-style amenities including a clubhouse, community pools, marina, fitness center, and an active social calendar. Conveniently located near shopping, dining, medical facilities, and Gulf beaches, this home is an excellent value in a sought-after community.
Key facts
- Fitness center
- Clubhouse
- New roof
Tags
Neighborhood map
What this means for you Summary
Snapshot
- This is a 2-bed/2.0-bath manufactured listed at $119k.
Deal economics
- At list price, monthly cash flow is $-113 ($-1k/yr) — negative.
- To cash-flow at today's rent, offer at most $99k (16.7% below list).
- Meets the 1% rule at list price ($2k rent vs $119k).
- Recommended offer: $99k (16.7% below list) — sets the bar for cash-flow.
Location & tenants
- Location reads 66/100 on livability (#604 in FL) — a middle-class / working-renter tenant base. Strengths: cost of living A+, housing A+, crime B+; Watch: schools D-, amenities F, commute F.
- Sarasota (urban): math 63% / reading 63% proficiency, ranked #7 of 73 in FL (top 10%) — acceptable for families but not a draw, mixed tenant base, ~2y average lease.
- Market conditions: Rents flat; 852 active listings in the ZIP; 7,466 units permitted in Sarasota County in 2024 (2,138 in 5+ unit buildings).
- This rent runs 32% of the median local income ($63k/yr) — at the standard rent-burdened threshold; future hikes will face affordability resistance.
Forward outlook
- Local home prices are declining (-3.0%/yr); year-one equity from $823 of loan paydown is wiped out by about $4k of value loss. Plan a longer hold.
- Sarasota County population projected at +20% by 2050 — long-run rental-demand tailwind backs the buy-and-hold thesis.
Negotiation context
- It's been on market 152 days — a 12% lower offer ($105k) is reasonable based on typical stale-listing flexibility.
- 2 sale attempts since 2y ago; this cycle's ask has dropped $14k (10%) from the opening price — seller is motivated, your offer sets the floor, not the list.
- Current owner paid $76k; list at $119k implies a 57% gain — meaningful room to come down on a strong offer.
Risks & watch-outs
- Watch-outs: flood insurance adds $427/mo.
- Climate carrying-cost: in FEMA flood zone AE (mandatory federal flood insurance); severe wind risk, 99% chance of damaging wind over 30y; major wildfire risk; extreme-heat days projected 7→28/yr by 2055 (HVAC capex compounding) — expect insurance premiums to compound above CPI over the hold.
Questions for the listing agent
- What do current leases actually rent for vs. the listed asking? Can we see a recent rent roll and the last 12 months of T-12 income?
- It's been on market 152 days. Have you received any prior offers? Is the seller open to a 17% concession, seller financing, or rate buy-down credit?
- What's the actual annual flood-insurance premium (NFIP or private), and is the property in a SFHA with mandatory coverage?
- What does the HOA fee cover, when was the last increase, and are there any pending special assessments or reserve-fund shortfalls?
- Why hasn't it sold? Are there any deal-killer items the seller is aware of (foundation, flood, title, zoning, code violations)?
- Is there a deadline driving the sale (1031 exchange, divorce, estate, relocation)? That informs how much negotiation room exists.
- Schools are D-rated, which usually means shorter tenancies and higher turnover. Who's the typical renter profile here, and what's been the actual vacancy rate?
- What's the average days-on-market for RENTAL listings here right now (not sales)? A rising rental-DOM trend means longer vacancies and softer asking-rent achievability than the comps imply.
- What's the recent tenant-quality profile in this submarket — average credit score on applications, eviction rate, late-payment / NSF rate, and stable-employment percentage? A property-management company in the area should have these aggregated.
- How much new for-sale + rental construction is in the pipeline within 1–3 miles? Heavy new supply typically softens prices + rents 12–24 months out; constrained supply supports both.
Investment metrics
- 1% rule
- 1.44% ✓
- Cap rate
- 9.46%
- Cash-on-cash
- 11.31%
- DSCR
- 1.50
- GRM
- 5.8
CMA / ARV
No comps found within radius.
Projected returns pro-forma
-3.0% appreciation · 0.26% rent growth · sell at horizon
- IRR
- -28.7%
- Equity multiple
- 0.08×
- Total profit
- $-30,616
- Equity at exit
- $17,743
- IRR
- -66.5%
- Equity multiple
- -0.56×
- Total profit
- $-51,999
- Equity at exit
- $10,289
Cash invested: $33,320 (down + closing). Projections, not guarantees.
Landlord ↔ Tenant lean methodology
- Overall (STATE)
- 87 Strongly Landlord-Friendly
- State Florida
- 87 Strongly Landlord-Friendly · R+3
- County
- — inherits STATE
- City
- — inherits STATE
ZIP-level market 34287
- Home prices YoY
- -20.1%
- Rents YoY
- 0.3%
- Active inventory
- 852
- Price-to-rent
- 5.8×
Monthly cashflow live
- Estimated rent
- $1,709 medium interval (Pro) →
- Mortgage (P&I)
- −$624
- Tax from tax record
- −$167 /mo · $1,998/yr
- Insurance
- −$50
- Flood insurance flood zone
- −$427 /mo · $5,118/yr
- HOA
- −$196
- Vacancy / Maint / Mgmt
- −$359
- Net cashflow
- $-113
Break-even live
UW: 25.0% down · 7.5% · 30yr · 1.5% tax · 5.0% vac · 8.0% maint · 8.0% mgmt
Financing live
Cash to close
- Down payment
- $29,750
- Closing costs
- $3,570
- Reserves months
- —
- Total cash needed
- —
Loan-product check · same deal, 3 products live
Conventional
25% down · 7.5% · 30yr
- Down + closing
- —
- Monthly P&I
- —
- Monthly cashflow
- —
- DSCR
- —
- Eligible?
- —
Personal DTI + credit; lowest rate.
DSCR
20% down · 8.5% · 30yr
- Down + closing
- —
- Monthly P&I
- —
- Monthly cashflow
- —
- DSCR
- —
- Eligible?
- —
No personal income docs; deal must DSCR.
Hard money
10% down · 12.0% · 12mo
- Down + closing
- —
- Monthly P&I
- —
- Monthly cashflow
- —
- DSCR
- —
- Eligible?
- —
Short-term bridge; refi at stabilization.
HOA detail
- Monthly dues
- $196 · $2,352/yr
- Likely covers
- poolgym
Listing history 22 events
-
2026-06-18days on market $119,000 Active 152 DOM
-
2026-06-17days on market $119,000 Active 151 DOM
-
2026-06-16days on market $119,000 Active 150 DOM
-
2026-06-15days on market $119,000 Active 149 DOM
-
2026-06-13days on market $119,000 Active 147 DOM
-
2026-06-13days on market $119,000 Active 146 DOM
-
2026-06-10days on market $119,000 Active 144 DOM
-
2026-06-09days on market $119,000 Active 143 DOM
-
2026-06-08days on market $119,000 Active 142 DOM
-
2026-06-08days on market $119,000 Active 141 DOM
-
2026-06-05days on market $119,000 Active 138 DOM
-
2026-06-03days on market $119,000 Active 137 DOM
-
2026-06-02days on market $119,000 Active 136 DOM
-
2026-06-01days on market $119,000 Active 135 DOM
-
2026-05-31days on market $119,000 Active 134 DOM
-
2026-03-14price $119,000 772-char remark
Show marketing remark (772 chars)
Located in the award-winning 55+ community of Harbor Isles in North Port, this double-wide manufactured home offers a great opportunity to create your own Florida retreat. The home is functional and well laid out, featuring generous living spaces, but is ready for cosmetic updates and a little TLC—perfect for buyers who want to add their own finishing touches and build instant equity. A new roof installed in 2025 provides peace of mind and adds significant value. Enjoy the Harbor Isles lifestyle with resort-style amenities including a clubhouse, community pools, marina, fitness center, and an active social calendar. Conveniently located near shopping, dining, medical facilities, and Gulf beaches, this home is an excellent value in a sought-after community.
-
2026-01-17$132,500 Active 772-char remark
Show marketing remark (772 chars)
Located in the award-winning 55+ community of Harbor Isles in North Port, this double-wide manufactured home offers a great opportunity to create your own Florida retreat. The home is functional and well laid out, featuring generous living spaces, but is ready for cosmetic updates and a little TLC—perfect for buyers who want to add their own finishing touches and build instant equity. A new roof installed in 2025 provides peace of mind and adds significant value. Enjoy the Harbor Isles lifestyle with resort-style amenities including a clubhouse, community pools, marina, fitness center, and an active social calendar. Conveniently located near shopping, dining, medical facilities, and Gulf beaches, this home is an excellent value in a sought-after community.
-
2024-09-22price $159,000
-
2024-07-31price $164,900
-
2024-03-26$185,000 Active
-
2002-06-11soldstatus $76,000
-
1990-11-07soldstatus $67,000
ⓘ Source: listings_history table (triggers on properties + properties_extension) + one-shot
backfill from property_details.listing_events for pre-trigger history.
Tax reassessment forecast FL · Resets to sale price
- Current annual tax
- $1,998 · $167/mo
- Projected year-2 tax
- $1,998 · $167/mo
- Expected delta
- $0/yr ($0/mo · 0.0%)
ⓘ Screening estimate from a state-policy table — verify with the county assessor before closing.
Climate risk First Street
- Flood 9/10 Extreme FEMA zone AE · 99% chance over 30 yrs
- Wildfire 6/10 Major
- Heat 10/10 Extreme 7 d/yr ≥107°F today · 28 d/yr by 30 yrs out
- Wind 10/10 Extreme 99% chance of damaging wind over 30 yrs
- Air quality 2/10 Low 1 unhealthy d/yr today · 1 by 30 yrs out
Nearby sold comps map
Loading sold comps map…
Walkable amenities ~0.75 mi
Loading nearby amenities…
Taxation est. · year 1
- Rental income
- $20,509
- − Mortgage interest
- −$6,666
- − Property taxes
- −$1,998
- − Insurance
- −$5,714
- − Repairs & maintenance
- −$1,641
- − Management
- −$1,641
- − HOA
- −$2,352
- − Depreciation
- −$3,462
- Taxable loss
- −$2,964
- Est. tax savings @ 24.0%
- +$711
- After-tax cash flow
- $-639/yr
For passive investors: Depreciation is non-cash, so a rental often shows a tax loss while cash-flowing — sheltering income. Rental losses are passive: they offset passive income freely, and up to $25,000/yr can offset ordinary (W-2) income if you actively participate and your MAGI is under $100k (phasing out to $0 by $150k); unused losses carry forward. On sale, claimed depreciation is recaptured at up to 25%, and gains may owe capital-gains tax (a 1031 exchange can defer both). Figures are a year-1 estimate at your 24.0% rate — not tax advice; consult a CPA.
Schools (NCES district)
- District
- Sarasota
- NCES district ID
- 1201680
- Math proficiency
- 63% ▼ -8.00%
- Reading proficiency
- 63% ▼ -3.00%
- Median HH income
- $51,167
- Composite
- 53.68/100
- National rank
- #1428
- State rank
- #7 of 73 in FL
Livability — Warm Mineral Springs
- Score
- 66/100
- State rank
- #604
- US rank
- #11606
Category grades
Schools grade is shown separately in the Schools card above.
Census & demographics
- Census place
- Warm Mineral Springs, FL
- County
- Sarasota County · 448,376 people
- Metro
- North Port-Sarasota-Bradenton, FL
- Population (ZIP)
- 25,929
- Household income
- $63,464
- Rent vs Own
- Severe rent burden
- 522.0
Population outlook (Sarasota County) Hauer SSP2
- Today (2025)
- 452,380 people
- By 2030
- 474,175 · +4.8%
- By 2040
- 511,577 · +13.1%
- By 2050
- 541,467 · +19.7%
- By 2075
- 604,947 · +33.7%
- By 2100
- 621,965 · +37.5%
Race, ethnicity, and origin ACS 2023
- Neighborhood character
- Predominantly White (77%)
- Race & ethnicity
- White 77% Hispanic / Latino 14% Two or more races 7% Asian 4% Black 3%
- Hispanic origin (detail)
- Mexican 2% Puerto Rican 3% Cuban 3% Dominican 1%
- Common ancestry
- Romanian 4% Scotch-Irish 3% Lithuanian 3%
- Foreign-born
- 16% · Canada, Philippines
- Languages at home
- 81% English-only · Spanish 8% Russian/Polish/Slavic 5% French/Haitian/Cajun 2%
Political lean MEDSL · Sarasota
- 2024 margin
- R (+18.2) · D 40.5% · R 58.7%
- 2008→2024 swing
- -18.1pp toward R · 2008: -0.1pp · 2024: -18.2pp
- All cycles
- 2024: R+18.2 2020: R+10.4 2016: R+11.6 2012: R+7.4 2008: R+0.1
Not yet ingested
- Civics
- —
Market trends
- HPI YoY
- ▼ -70.89%
- Current HPI
- 280.8484
- Rent YoY
- ▲ 0.26%
- Metro
- North Port-Sarasota-Bradenton, FL
- State GDP YoY
- ▲ 3.28%
- F500 in state
- 36
Industry mix (Fortune 500 HQ in FL)
| Industry | F500 HQs | Revenue |
|---|---|---|
| Industrial Technology | 2 | $29B |
|
||
| Insurance | 2 | $17B |
|
||
| Retail | 1 | $60B |
|
||
| Technology Distribution | 1 | $58B |
|
||
| Homebuilding | 1 | $35B |
|
||
| Technology Manufacturing | 1 | $35B |
|
||
Price history
+77.6% since first listed7 events — show timeline
- 2026-03-14 Price Changed $119,000 Stellar MLS as Distributed by MLS Grid
- 2026-01-17 Listed $132,500 Stellar MLS as Distributed by MLS Grid
- 2024-09-22 Price Changed $159,000 Stellar MLS as Distributed by MLS Grid
- 2024-07-31 Price Changed $164,900 Stellar MLS as Distributed by MLS Grid
- 2024-03-26 Listed $185,000 Stellar MLS as Distributed by MLS Grid
- 2002-06-11 Sold (Public Records) $76,000 Public Records
- 1990-11-07 Sold (Public Records) $67,000 Public Records
Property tax history
+9.4%/yrLatest (2025): $1,998 · -5.8% YoY. Source: county tax records.
Cash-flow waterfall
monthlySold comps — $/sqft
last 12 mo · ≤1 miLoading sold comps…