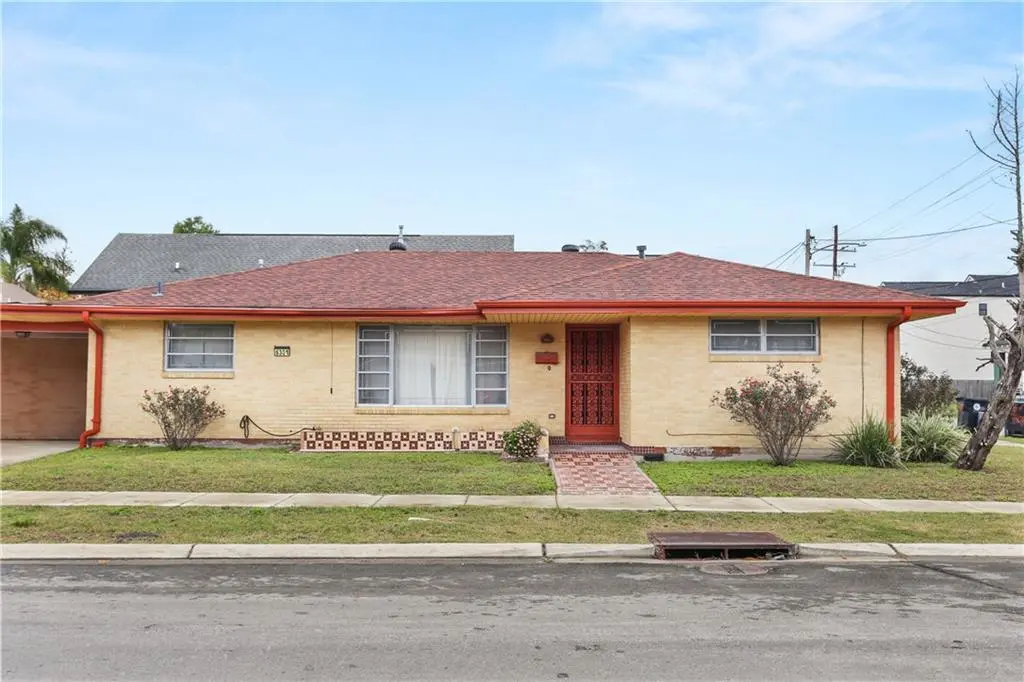
6301 S Rocheblave St · New Orleans, LA
Flood risk 8/10 · Major
- FEMA flood zone
- X (shaded)
- Chance of flooding over 30 yrs
- 0.6%
- Est. flood insurance / yr
- $507 – $1,088
Fire risk 1/10 · Minimal
- Est. fire insurance / yr
- $1,269 – $2,357
Heat risk 10/10 · Severe
- Hot days now (above 108°F)
- 7 days/yr
- Hot days in 30 yrs
- 21 days/yr
Wind risk 10/10 · Severe
- Chance of severe wind over 30 yrs
- 99.0%
Air-quality risk 3/10 · Minor
- Unhealthy air days now
- 3 days/yr
- Unhealthy air days in 30 yrs
- 4 days/yr
Risk factors via First Street. Map © Google.
Why this score? — see what drove the D+ grade
The composite is a weighted blend of 9 inputs, each scored 0–100. Each bar is that input's sub-score; the figure is the points it added to the 100-point composite (weight × sub-score).
- ARV discount +15.0/15.0
- Cash flow +13.0/30.0
- Livability +4.0/5.0
- DSCR +3.9/10.0
- Rent growth +2.7/5.0
- 1% rule +2.5/10.0
- Condition / age +2.5/5.0
- Schools +1.6/10.0
- Appreciation +0.0/10.0
$290,000
🖨 Deal sheet (PDF) 📄 Offer letter ✓ Due diligence
Listing remarks MLS
Are you looking for a move-in ready home in the heart of New Orleans? This beauty has it all — all-new streets in the area, a newer roof, a large inviting den, and a massive kitchen and dining room combo perfect for entertaining! Every bedroom is generously sized and well-appointed, offering comfort and space for everyone. Don’t miss your opportunity to own a home that checks all the boxes!
Key facts
- Newer roof
- Large inviting den
- Parking
Tags
Neighborhood map
What this means for you Summary
Snapshot
- This is a 3-bed/2.0-bath single-family listed at $290k.
Deal economics
- At list price, monthly cash flow is $-83 ($-1k/yr) — negative.
- To cash-flow at today's rent, offer at most $275k (5.1% below list).
- To meet the 1% rule (rent ≥ 1% of price), the offer needs to be $217k (25.2% below list).
- Recommended offer: $217k (25.2% below list) — sets the bar for 1% rule.
- Cap rate 6.2% vs local median 4.4% in New Orleans — top-decile yield for the area; either an underpriced asset or a hidden risk that comps aren't pricing in. Stress-test before assuming the spread holds.
Location & tenants
- Location reads 81/100 on livability (#3 in LA, #1,383 nationally) — a professional / high-income tenant draw. Strengths: amenities A+, commute A+, health & safety A+; Watch: crime C-, employment D.
- Orleans Parish (urban): math 11% / reading 27% proficiency, ranked #69 of 98 in LA (top 70%) — low school quality limits family demand, transient renter base, plan for 1-2y turnover; 68% free/reduced lunch — lower-income household profile, screen leases tightly.
- Zoned schools: Benjamin Franklin Elem. Math And Science (math 12% / reading 23%, grade F, #479 of 646 statewide, top 75%, 747 students, 98% FRL, charter) — zoned schools average 98% FRL vs 68% district-wide (30 pts higher); higher-poverty schools than district average — tighter screening recommended.
- Market conditions: Rents flat; 219 active listings in the ZIP; 40 comparable units currently listed for rent nearby; rentals at typical pace (median 19d on market — plan ~3-4 weeks tenant-placement turnaround); 710 units permitted in Orleans Parish in 2024 (244 in 5+ unit buildings).
- This rent runs 43% of the median local income ($61k/yr) — at the standard rent-burdened threshold; future hikes will face affordability resistance.
Forward outlook
- Local home prices are declining (-3.0%/yr); year-one equity from $2k of loan paydown is wiped out by about $9k of value loss. Plan a longer hold.
- Orleans County population projected at +61% by 2050 — long-run rental-demand tailwind backs the buy-and-hold thesis.
Negotiation context
- It's been on market 115 days — a 9% lower offer ($264k) is reasonable based on typical stale-listing flexibility.
- 8 sale attempts since 20y ago with the ask held roughly flat each time — persistent listings suggest the price (not the market) is what's stuck; bring a comps-based counter.
- Current owner paid $75k; list at $290k implies a 287% gain — meaningful room to come down on a strong offer.
Risks & watch-outs
- Watch-outs: flood insurance adds $66/mo.
- Climate carrying-cost: severe flood risk; severe wind risk, 99% chance of damaging wind over 30y; extreme-heat days projected 7→21/yr by 2055 (HVAC capex compounding) — expect insurance premiums to compound above CPI over the hold.
Questions for the listing agent
- What do current leases actually rent for vs. the listed asking? Can we see a recent rent roll and the last 12 months of T-12 income?
- It's been on market 115 days. Have you received any prior offers? Is the seller open to a 25% concession, seller financing, or rate buy-down credit?
- Built in 1964 — when were the roof, HVAC, electrical panel, plumbing, and water heater last replaced?
- What's the actual annual flood-insurance premium (NFIP or private), and is the property in a SFHA with mandatory coverage?
- Why hasn't it sold? Are there any deal-killer items the seller is aware of (foundation, flood, title, zoning, code violations)?
- Is there a deadline driving the sale (1031 exchange, divorce, estate, relocation)? That informs how much negotiation room exists.
- The area grade is low — what's the realistic commute time and amenity access for the typical tenant pool here? Any planned neighborhood developments (good or bad) we should know about?
- What's the average days-on-market for RENTAL listings here right now (not sales)? A rising rental-DOM trend means longer vacancies and softer asking-rent achievability than the comps imply.
- What's the recent tenant-quality profile in this submarket — average credit score on applications, eviction rate, late-payment / NSF rate, and stable-employment percentage? A property-management company in the area should have these aggregated.
- How much new for-sale + rental construction is in the pipeline within 1–3 miles? Heavy new supply typically softens prices + rents 12–24 months out; constrained supply supports both.
Investment metrics
- 1% rule
- 0.75% ✗
- Cap rate
- 6.22%
- Cash-on-cash
- -0.25%
- DSCR
- 0.99
- GRM
- 11.1
CMA / ARV
- ARV (median comp)
- $429,482
- List price
- $290,000
- Delta
- -32.48%
- Verdict
- UNDERPRICED
- Comps
- 20 within 1.0 mi
Show comp detail 12 sales within ~0.75 mi
| Address | Dist | Beds/Ba | Sqft | Sold | Price | $/sf | Match |
|---|---|---|---|---|---|---|---|
| 3712 Calhoun St | 0.27mi | 3/2.0 | 1,426 (-1%) | 1mo | $325,000 | $228 | 85 |
| 4927 S Johnson St | 0.46mi | 3/2.0 | 1,406 (-2%) | 1mo | $345,000 | $245 | 74 |
| 6120 Delord St | 0.54mi | 3/2.0 | 1,410 (-2%) | 2mo | $345,000 | $245 | 70 |
| 2033 Audubon St | 0.22mi | 4/2.0 (+1) | 1,596 (+11%) | 1mo | $511,500 | $320 | 66 |
| 7822 Colapissa St | 0.73mi | 3/2.0 | 1,452 (+1%) | 1mo | $245,000 | $169 | 63 |
| 7809 Hickory St | 0.61mi | 2/2.0 (-1) | 1,417 (-2%) | 1mo | $301,800 | $213 | 63 |
| 4428 Fontainebleau Dr | 0.33mi | 3/2.0 | 1,650 (+15%) | 1mo | $373,000 | $226 | 60 |
| 2801 Joseph St | 0.53mi | 2/2.0 (-1) | 1,324 (-8%) | 1mo | $395,000 | $298 | 56 |
| 3920 Delachaise St | 0.67mi | 3/2.0 | 1,544 (+7%) | 1mo | $90,000 | $58 | 56 |
| 4119 Walmsley Ave | 0.58mi | 3/2.0 | 1,596 (+11%) | 1mo | $427,750 | $268 | 54 |
| 7909 Belfast St | 0.63mi | 3/2.0 | 1,615 (+12%) | 1mo | $466,000 | $289 | 50 |
| 2018 Fern St | 0.59mi | 3/1.0 | 1,280 (-11%) | 1mo | $200,000 | $156 | 49 |
Match score weights: distance 35% · size 25% · config 20% · recency 20%. Top-matched comps best support the ARV.
Projected returns pro-forma
-3.0% appreciation · 0.73% rent growth · sell at horizon
- IRR
- -20.7%
- Equity multiple
- 0.30×
- Total profit
- $-57,243
- Equity at exit
- $43,240
- IRR
- -19.3%
- Equity multiple
- 0.06×
- Total profit
- $-76,070
- Equity at exit
- $25,074
Cash invested: $81,200 (down + closing). Projections, not guarantees.
Landlord ↔ Tenant lean methodology
- Overall (STATE)
- 90 Strongly Landlord-Friendly
- State Louisiana
- 90 Strongly Landlord-Friendly · R+12
- County
- — inherits STATE
- City
- — inherits STATE
ZIP-level market 70125
- Home prices YoY
- -16.3%
- Rents YoY
- 0.7%
- Active inventory
- 219
- Price-to-rent
- 11.1×
Monthly cashflow live
- Estimated rent
- $2,170 high interval (Pro) →
- Mortgage (P&I)
- −$1,521
- Tax from tax record
- −$90 /mo · $1,078/yr
- Insurance
- −$121
- Flood insurance flood zone
- −$66 /mo · $798/yr
- HOA
- −$0
- Vacancy / Maint / Mgmt
- −$456
- Net cashflow
- $-83
Break-even live
Sensitivity live
| Price | -10% $81 | -5% $-1 | +0% $-83 | +5% $-165 | +10% $-248 |
|---|---|---|---|---|---|
| Rent | -10% $-255 | -5% $-169 | +0% $-83 | +5% $2 | +10% $88 |
| Rate | -1.0pp $63 | -0.5pp $-10 | base $-83 | +0.5pp $-159 | +1.0pp $-235 |
UW: 25.0% down · 7.5% · 30yr · 1.5% tax · 5.0% vac · 8.0% maint · 8.0% mgmt
Financing live
Cash to close
- Down payment
- $72,500
- Closing costs
- $8,700
- Reserves months
- —
- Total cash needed
- —
Loan-product check · same deal, 3 products live
Conventional
25% down · 7.5% · 30yr
- Down + closing
- —
- Monthly P&I
- —
- Monthly cashflow
- —
- DSCR
- —
- Eligible?
- —
Personal DTI + credit; lowest rate.
DSCR
20% down · 8.5% · 30yr
- Down + closing
- —
- Monthly P&I
- —
- Monthly cashflow
- —
- DSCR
- —
- Eligible?
- —
No personal income docs; deal must DSCR.
Hard money
10% down · 12.0% · 12mo
- Down + closing
- —
- Monthly P&I
- —
- Monthly cashflow
- —
- DSCR
- —
- Eligible?
- —
Short-term bridge; refi at stabilization.
Rent comps 40 comps
| Address | Beds | Baths | Sqft | Rent | $/sqft | DOM | Units | Dist |
|---|---|---|---|---|---|---|---|---|
| 3180 State Street Dr New Orleans, LA | 3.0 | 2.0 | 1600 | $1,900 | $1.19 | 12d | 1 | 0.15mi |
| 2308 Audubon St New Orleans, LA | 4.0 | 1.5 | 1480 | $3,050 | $2.06 | 17d | 1 | 0.19mi |
| 3708 Nashville Ave New Orleans, LA | 2.0 | 1.0 | 1100 | $1,800 | $1.64 | 19d | 1 | 0.19mi |
| 2344 Audubon St New Orleans, LA | 2.0 | 1.0 | 988 | $1,600 | $1.62 | 25d | 1 | 0.21mi |
| 2203 Broadway St New Orleans, LA | 3.0 | 2.0 | 1491 | $3,000 | $2.01 | 23d | 1 | 0.22mi |
| 3821 Vincennes Pl New Orleans, LA | 2.0 | 1.0 | 950 | $1,500 | $1.58 | 25d | 1 | 0.25mi |
| 5512 S Tonti St Unit 5512 New Orleans, LA | 2.0 | 1.0 | 1143 | $1,600 | $1.40 | 22d | 1 | 0.27mi |
| 1929 Broadway St Unit B New Orleans, LA | 2.0 | 1.0 | 1000 | $1,500 | $1.50 | 19d | 1 | 0.29mi |
| 2432 Broadway St Unit C New Orleans, LA | 2.0 | 1.0 | 1000 | $1,400 | $1.40 | 19d | 1 | 0.29mi |
| 2010 Broadway St New Orleans, LA | 4.0 | 2.0 | 1600 | $2,400 | $1.50 | 25d | 1 | 0.30mi |
| 4324 Cadiz St New Orleans, LA | 2.0 | 1.5 | 1325 | $2,000 | $1.51 | 16d | 1 | 0.30mi |
| 2525 Broadway St New Orleans, LA | 2.0 | 1.0 | 1380 | $2,200 | $1.59 | 25d | 1 | 0.31mi |
| 2123 S Lopez St New Orleans, LA | 2.0 | 1.0 | 950 | $1,300 | $1.37 | 5d | 1 | 0.34mi |
| 7305 Spruce St New Orleans, LA | 2.0 | 1.0 | 981 | $1,000 | $1.02 | 25d | 1 | 0.35mi |
| 7 Melodia Ct New Orleans, LA | 2.0 | 1.0 | 1120 | $2,000 | $1.79 | 22d | 1 | 0.35mi |
| 2741 Audubon St New Orleans, LA | 3.0 | 2.0 | 1100 | $1,800 | $1.64 | 5d | 1 | 0.36mi |
| 4115 State Street Dr New Orleans, LA | 2.0 | 1.0 | 1000 | $1,900 | $1.90 | 22d | 1 | 0.36mi |
| 2838 Palmer Ave New Orleans, LA | 3.0 | 1.5 | 1500 | $2,000 | $1.33 | 19d | 1 | 0.36mi |
| 2834 Palmer Ave New Orleans, LA | 3.0 | 2.0 | 1533 | $2,800 | $1.83 | 19d | 1 | 0.37mi |
| 4117 State Street Dr New Orleans, LA | 3.0 | 1.0 | 1678 | $1,550 | $0.92 | 13d | 1 | 0.37mi |
| 2836 Palmer Ave New Orleans, LA | 3.0 | 2.0 | 1376 | $2,500 | $1.82 | 45d | 1 | 0.37mi |
| 2824 Calhoun St Unit B New Orleans, LA | 2.0 | 1.0 | 1385 | $2,200 | $1.59 | 25d | 1 | 0.37mi |
| 2824 Calhoun St Unit A New Orleans, LA | 3.0 | 2.0 | 1828 | $3,900 | $2.13 | 45d | 1 | 0.37mi |
| 2212 S Salcedo St New Orleans, LA | 2.0 | 1.0 | 1000 | $1,975 | $1.98 | 5d | 1 | 0.37mi |
| 2016 S Rendon St New Orleans, LA | 2.0 | 1.5 | 1224 | $1,600 | $1.31 | 13d | 1 | 0.38mi |
| 2102 S Lopez St New Orleans, LA | 2.0 | 1.0 | 900 | $1,500 | $1.67 | 16d | 1 | 0.38mi |
| 2832 Palmer Ave Unit Up New Orleans, LA | 4.0 | 2.0 | 1720 | $2,900 | $1.69 | 45d | 1 | 0.38mi |
| 7408 Panola St New Orleans, LA | 2.0 | 1.0 | 900 | $1,500 | $1.67 | 25d | 1 | 0.38mi |
| 3636 Upperline St New Orleans, LA | 3.0 | 1.0 | 1600 | $1,975 | $1.23 | 25d | 1 | 0.38mi |
| 1827 Pine St New Orleans, LA | 2.0 | 1.0 | 1436 | $2,400 | $1.67 | 25d | 1 | 0.38mi |
| 2829 Palmer Ave New Orleans, LA | 2.0 | 2.0 | 1075 | $2,295 | $2.13 | 25d | 1 | 0.39mi |
| 2014 Lowerline St New Orleans, LA | 3.0 | 1.5 | 1600 | $2,850 | $1.78 | 16d | 1 | 0.39mi |
| 2814 Palmer Ave New Orleans, LA | 3.0 | 2.0 | 1500 | $2,400 | $1.60 | 19d | 1 | 0.40mi |
| 7317 Cohn St New Orleans, LA | 2.0 | 1.0 | 950 | $1,800 | $1.89 | 4d | 1 | 0.40mi |
| 7317 Cohn St New Orleans, LA | 2.0 | 1.0 | 875 | $1,700 | $1.94 | 13d | 1 | 0.40mi |
| 1801 Pine St New Orleans, LA | 2.0 | 1.0 | 1340 | $2,800 | $2.09 | 5d | 1 | 0.42mi |
| 5417 S Johnson St New Orleans, LA | 3.0 | 3.0 | 1739 | $2,900 | $1.67 | 19d | 1 | 0.43mi |
| 7728 Sycamore St Unit B New Orleans, LA | 2.0 | 2.0 | 900 | $1,750 | $1.94 | 19d | 1 | 0.44mi |
| 2201 Burdette St New Orleans, LA | 3.0 | 1.5 | 1800 | $2,695 | $1.50 | 19d | 1 | 0.45mi |
| 7021 Pritchard Pl New Orleans, LA | 2.0 | 1.0 | 1100 | $1,950 | $1.77 | 17d | 1 | 0.45mi |
Listing history 31 events
-
2026-06-21days on market $290,000 Active 115 DOM
-
2026-06-18days on market $290,000 Active 112 DOM
-
2026-06-17days on market $290,000 Active 111 DOM
-
2026-06-16days on market $290,000 Active 110 DOM
-
2026-06-15days on market $290,000 Active 109 DOM
-
2026-06-13days on market $290,000 Active 107 DOM
-
2026-06-10days on market $290,000 Active 104 DOM
-
2026-06-09days on market $290,000 Active 103 DOM
-
2026-06-08days on market $290,000 Active 102 DOM
-
2026-06-07days on market $290,000 Active 101 DOM
-
2026-06-05days on market $290,000 Active 98 DOM
-
2026-06-03days on market $290,000 Active 97 DOM
-
2026-06-02days on market $290,000 Active 96 DOM
-
2026-06-01days on market $290,000 Active 95 DOM
-
2026-05-31days on market $290,000 Active 94 DOM
-
2026-02-26$290,000 Active 405-char remark
Show marketing remark (394 chars)
ARE YOU LOOKING FOR A MOVE-IN READY HOME IN THE HEART OF NEW ORLEANS? THIS BEAUTY HAS IT ALL -- ALL-NEW STREETS IN THE AREA, A NEWER ROOF, A LARGE INVITING DEN, AND A MASSIVE KITCHEN AND DINING ROOM COMBO PERFECT FOR ENTERTAINING! EVERY BEDROOM IS GENEROUSLY SIZED AND WELL-APPOINTED, OFFERING COMFORT AND SPACE FOR EVERYONE. DON'T MISS YOUR OPPORTUNITY TO OWN A HOME THAT CHECKS ALL THE BOXES!
-
2026-02-26$290,000 Active 394-char remark
Show marketing remark (394 chars)
ARE YOU LOOKING FOR A MOVE-IN READY HOME IN THE HEART OF NEW ORLEANS? THIS BEAUTY HAS IT ALL -- ALL-NEW STREETS IN THE AREA, A NEWER ROOF, A LARGE INVITING DEN, AND A MASSIVE KITCHEN AND DINING ROOM COMBO PERFECT FOR ENTERTAINING! EVERY BEDROOM IS GENEROUSLY SIZED AND WELL-APPOINTED, OFFERING COMFORT AND SPACE FOR EVERYONE. DON'T MISS YOUR OPPORTUNITY TO OWN A HOME THAT CHECKS ALL THE BOXES!
-
2025-05-30price $290,000
-
2025-05-30price $290,000
-
2024-12-11$299,900 Active
-
2024-04-02price $320,000
-
2024-02-15$320,000
-
2023-10-24price $350,000
-
2023-10-03price $360,000
-
2023-08-21price $370,000
-
2023-08-07$350,000
-
2023-07-19$380,000
-
2006-10-30soldstatus $75,000
-
2006-10-27soldstatus $75,000
-
2006-09-26$79,900
-
2006-09-26$79,900
ⓘ Source: listings_history table (triggers on properties + properties_extension) + one-shot
backfill from property_details.listing_events for pre-trigger history.
Tax reassessment forecast LA · Resets to sale price
- Current annual tax
- $1,078 · $90/mo
- Projected year-2 tax
- $1,595 · $133/mo
- Expected delta
- +$517/yr (+$43/mo · 47.9%)
ⓘ Screening estimate from a state-policy table — verify with the county assessor before closing.
Climate risk First Street
- Flood 8/10 Severe FEMA zone X (shaded) · 60% chance over 30 yrs
- Wildfire 1/10 Low
- Heat 10/10 Extreme 7 d/yr ≥108°F today · 21 d/yr by 30 yrs out
- Wind 10/10 Extreme 99% chance of damaging wind over 30 yrs
- Air quality 3/10 Moderate 3 unhealthy d/yr today · 4 by 30 yrs out
Nearby sold comps map
Loading sold comps map…
Walkable amenities ~0.75 mi
Loading nearby amenities…
Taxation est. · year 1
- Rental income
- $26,044
- − Mortgage interest
- −$16,245
- − Property taxes
- −$1,078
- − Insurance
- −$2,248
- − Repairs & maintenance
- −$2,084
- − Management
- −$2,084
- − Depreciation
- −$8,436
- Taxable loss
- −$6,129
- Est. tax savings @ 24.0%
- +$1,471
- After-tax cash flow
- $471/yr
For passive investors: Depreciation is non-cash, so a rental often shows a tax loss while cash-flowing — sheltering income. Rental losses are passive: they offset passive income freely, and up to $25,000/yr can offset ordinary (W-2) income if you actively participate and your MAGI is under $100k (phasing out to $0 by $150k); unused losses carry forward. On sale, claimed depreciation is recaptured at up to 25%, and gains may owe capital-gains tax (a 1031 exchange can defer both). Figures are a year-1 estimate at your 24.0% rate — not tax advice; consult a CPA.
Schools (NCES district)
- District
- Orleans Parish
- NCES district ID
- 2201170
- Math proficiency
- 11% ▼ -52.00%
- Reading proficiency
- 27% ▼ -46.00%
- Median HH income
- $37,011
- Composite
- 15.78/100
- National rank
- #9271
- State rank
- #69 of 98 in LA
Livability — New Orleans
- Score
- 81/100
- State rank
- #3
- US rank
- #1383
Category grades
Schools grade is shown separately in the Schools card above.
Census & demographics
- Census place
- New Orleans, LA
- County
- Orleans Parish · 338,817 people
- City population
- 338,817
- Metro
- New Orleans-Metairie, LA
- Population (ZIP)
- 17,821
- Household income
- $61,174
- Rent vs Own
- Severe rent burden
- 1270.0
Population outlook (Orleans County) Hauer SSP2
- Today (2025)
- 513,025 people
- By 2030
- 575,781 · +12.2%
- By 2040
- 700,174 · +36.5%
- By 2050
- 826,541 · +61.1%
- By 2075
- 1,123,374 · +119.0%
- By 2100
- 1,355,609 · +164.2%
Race, ethnicity, and origin ACS 2023
- Neighborhood character
- Diverse neighborhood (Simpson 0.63)
- Race & ethnicity
- Black 51% White 32% Hispanic / Latino 9% Two or more races 9% Asian 2% Native American 1%
- Hispanic origin (detail)
- Mexican 2%
- Common ancestry
- Lithuanian 8% Romanian 1% Slovak 1%
- Foreign-born
- 7% · Canada, China
- Languages at home
- 90% English-only · Spanish 6% French/Haitian/Cajun 1% Chinese 1%
Political lean MEDSL · Orleans
- 2024 margin
- Solid D (+67.0) · D 82.2% · R 15.2% · Other 2.7%
- 2008→2024 swing
- +6.7pp toward D · 2008: 60.3pp · 2024: 67.0pp
- All cycles
- 2024: D+67.0 2020: D+68.2 2016: D+66.2 2012: D+62.5 2008: D+60.3
Not yet ingested
- Civics
- —
Market trends
- HPI YoY
- ▼ -49.68%
- Current HPI
- 255.5998
- Rent YoY
- ▲ 0.73%
- Metro
- New Orleans-Metairie, LA
- State GDP YoY
- ▲ 3.29%
- F500 in state
- 10
Industry mix (Fortune 500 HQ in LA)
| Industry | F500 HQs | Revenue |
|---|---|---|
| Telecommunications | 2 | $23B |
|
||
| Utilities | 1 | $12B |
|
||
| Wholesale / Distribution | 1 | $5B |
|
||
| Advertising | 1 | $2B |
|
||
Price history
+263.0% since first listed16 events — show timeline
- 2026-02-26 Listed $290,000 AcadianaMLS
- 2026-02-26 Listed $290,000 GSREIN
- 2025-05-30 Price Changed $290,000 AcadianaMLS
- 2025-05-30 Price Changed $290,000 GSREIN
- 2024-12-11 Listed $299,900 AcadianaMLS
- 2024-04-02 Price Changed $320,000 GSREIN
- 2024-02-15 Listed $320,000 AcadianaMLS
- 2023-10-24 Price Changed $350,000 GSREIN
- 2023-10-03 Price Changed $360,000 GSREIN
- 2023-08-21 Price Changed $370,000 GSREIN
- 2023-08-07 Listed $350,000 AcadianaMLS
- 2023-07-19 Listed $380,000 AcadianaMLS
- 2006-10-30 Sold (Public Records) $75,000 Public Records
- 2006-10-27 Sold (MLS) $75,000 GSREIN
- 2006-09-26 Listed $79,900 GSREIN
- 2006-09-26 Listed $79,900 AcadianaMLS
Property tax history
-0.8%/yrLatest (2026): $1,078 · +1.0% YoY. Source: county tax records.
Cash-flow waterfall
monthlySold comps — $/sqft
last 12 mo · ≤1 miLoading sold comps…