23109 Nicholson Knob Rd · Borden, IN
Flood risk 1/10 · Minimal
- FEMA flood zone
- X (unshaded)
- Chance of flooding over 30 yrs
- 0.0%
- Est. flood insurance / yr
- $507 – $1,088
Fire risk 1/10 · Minimal
- Est. fire insurance / yr
- $717 – $1,331
Heat risk 4/10 · Minor
- Hot days now (above 104°F)
- 7 days/yr
- Hot days in 30 yrs
- 19 days/yr
Wind risk 2/10 · Minimal
- Chance of severe wind over 30 yrs
- 1.0%
Air-quality risk 2/10 · Minimal
- Unhealthy air days now
- 1 days/yr
- Unhealthy air days in 30 yrs
- 2 days/yr
Risk factors via First Street. Map © Google.
Why this score? — see what drove the B+ grade
The composite is a weighted blend of 9 inputs, each scored 0–100. Each bar is that input's sub-score; the figure is the points it added to the 100-point composite (weight × sub-score).
- Cash flow +28.4/30.0
- DSCR +10.0/10.0
- Appreciation +10.0/10.0
- 1% rule +7.8/10.0
- ARV discount +7.5/15.0
- Schools +5.0/10.0
- Livability +3.1/5.0
- Rent growth +2.5/5.0
- Condition / age +2.5/5.0
$154,999
🖨 Deal sheet 📄 Offer letter ✓ Due diligence
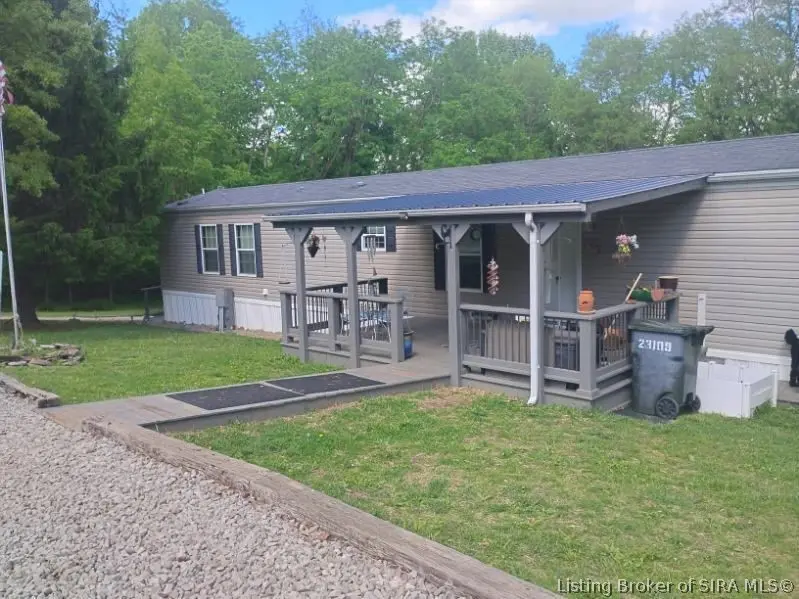
Listing remarks
What a deal! This roomy home has 4 bedrooms and 2 full bathrooms on almost an acre lot! Lots of room to spread out in the home and outside! Great floor plan with a good size family room and woodburning stove! Covered front porch! Rear deck with views of the property! Call today for a private showing before this home is SOLD!
Key facts
- Covered front porch
- Rear deck with views
- 0.92 acre lot
Tags
Property features AI
Exterior
- Utilities: Public water connection; Septic tank sewer
- Home design: Single-story home; Single wide mobile home
- Construction: Vinyl siding; Built with conventional foundation
- Exterior features: Covered porch; Deck; Landscaping; Shed(s); Has a view; Paved road access
Interior
- Kitchen: Kitchen on the main level
- Bedrooms: Bedrooms located on the main level
- Bathrooms: 2 full bathrooms
- Heating & cooling: Forced air heating; Central air conditioning
- Interior features: Ceiling fans; Primary bedroom on main level; Bath in primary bedroom; Walk-in closet(s); Utility room
- Laundry & utility: Main-level laundry room
Neighborhood map
What this means for you Summary
Snapshot
- This is a 4-bed/2.0-bath single-family listed at $155k.
Deal economics
- At list price, monthly cash flow is $502 ($6k/yr) — positive.
- The deal already cash-flows at list — no discount required.
- Meets the 1% rule at list price ($2k rent vs $155k).
- Recommended offer: $150k (3.0% below list) — sets the bar for market timing.
Location & tenants
- Location reads 61/100 on livability (#507 in IN) — a middle-class / working-renter tenant base. Strengths: crime A+, cost of living A+, housing A+; Watch: employment D+, amenities F, commute F.
- Market conditions: 26 active listings in the ZIP; 911 units permitted in Clark County in 2024 (133 in 5+ unit buildings).
Forward outlook
- In year one you build about $17k of equity ($1k loan paydown + $16k appreciation (10.0% local appreciation)).
- Clark County population projected at +17% by 2050 — long-run rental-demand tailwind backs the buy-and-hold thesis.
- At projected returns (10.0% appreciation + 3.0% rent growth), your $43k cash investment doubles in ~2 years — after that, you're playing with house money.
- By year 3, paydown + projected appreciation supports a ~$42k cash-out refi (75% LTV) — recoverable capital for the next deal without selling this one.
Negotiation context
- It's been on market 44 days — a 3% lower offer ($150k) is reasonable based on typical stale-listing flexibility.
- 2 sale attempts since 10y ago; this cycle's ask has dropped $15k (9%) from the opening price — seller is motivated, your offer sets the floor, not the list.
- Current owner paid $15k; list at $155k implies a 933% gain — meaningful room to come down on a strong offer.
Questions for the listing agent
- It's been on market 44 days. Have you received any prior offers? Is the seller open to a 3% concession, seller financing, or rate buy-down credit?
- Is there a deadline driving the sale (1031 exchange, divorce, estate, relocation)? That informs how much negotiation room exists.
- Schools are B-rated — typically a magnet for longer-tenancy family renters. What's the average tenant stay here, and is there a school-zone premium baked into asking?
- What's the average days-on-market for RENTAL listings here right now (not sales)? A rising rental-DOM trend means longer vacancies and softer asking-rent achievability than the comps imply.
- What's the recent tenant-quality profile in this submarket — average credit score on applications, eviction rate, late-payment / NSF rate, and stable-employment percentage? A property-management company in the area should have these aggregated.
- How much new for-sale + rental construction is in the pipeline within 1–3 miles? Heavy new supply typically softens prices + rents 12–24 months out; constrained supply supports both.
Investment metrics
- 1% rule
- 1.28% ✓
- Cap rate
- 10.18%
- Cash-on-cash
- 13.87%
- DSCR
- 1.62
- GRM
- 6.5
CMA / ARV
No comps found within radius.
Projected returns pro-forma
10.0% appreciation · 3.0% rent growth · sell at horizon
- IRR
- 34.5%
- Equity multiple
- 3.68×
- Total profit
- $116,395
- Equity at exit
- $139,635
- IRR
- 29.7%
- Equity multiple
- 8.32×
- Total profit
- $317,700
- Equity at exit
- $301,129
Cash invested: $43,400 (down + closing). Projections, not guarantees.
Landlord ↔ Tenant lean methodology
- Overall (STATE)
- 90 Strongly Landlord-Friendly
- State Indiana
- 90 Strongly Landlord-Friendly · R+11
- County
- — inherits STATE
- City
- — inherits STATE
ZIP-level market 47106
- Home prices YoY
- 6.7%
- Active inventory
- 26
- Price-to-rent
- 6.5×
Monthly cashflow live
- Estimated rent
- $1,991 medium interval (Pro) →
- Mortgage (P&I)
- −$813
- Tax est. 1.5%
- −$194 /mo · $2,325/yr
- Insurance
- −$65
- HOA
- −$0
- Vacancy / Maint / Mgmt
- −$418
- Net cashflow
- $502
Break-even live
UW: 25.0% down · 7.5% · 30yr · 1.5% tax · 5.0% vac · 8.0% maint · 8.0% mgmt
Financing live
Cash to close
- Down payment
- $38,750
- Closing costs
- $4,650
- Reserves months
- —
- Total cash needed
- —
Loan-product check · same deal, 3 products live
Conventional
25% down · 7.5% · 30yr
- Down + closing
- —
- Monthly P&I
- —
- Monthly cashflow
- —
- DSCR
- —
- Eligible?
- —
Personal DTI + credit; lowest rate.
DSCR
20% down · 8.5% · 30yr
- Down + closing
- —
- Monthly P&I
- —
- Monthly cashflow
- —
- DSCR
- —
- Eligible?
- —
No personal income docs; deal must DSCR.
Hard money
10% down · 12.0% · 12mo
- Down + closing
- —
- Monthly P&I
- —
- Monthly cashflow
- —
- DSCR
- —
- Eligible?
- —
Short-term bridge; refi at stabilization.
Listing history 17 events
-
2026-06-18days on market $154,999 Active 44 DOM
-
2026-06-17days on market $154,999 Active 43 DOM
-
2026-06-16days on market $154,999 Active 42 DOM
-
2026-06-15days on market $154,999 Active 41 DOM
-
2026-06-13days on market $154,999 Active 39 DOM
-
2026-06-10days on market $154,999 Active 36 DOM
-
2026-06-09days on market $154,999 Active 35 DOM
-
2026-06-08pricedays on market $154,999 Active 34 DOM
-
2026-06-07days on market $155,000 Active 33 DOM
-
2026-06-03days on market $155,000 Active 29 DOM
-
2026-06-02days on market $155,000 Active 28 DOM
-
2026-06-01days on market $155,000 Active 27 DOM
-
2026-05-31days on market $155,000 Active 26 DOM
-
2026-05-05$169,900 Active
-
2016-08-29soldstatus $15,000
-
2016-08-29soldstatus $15,000
-
2016-07-21$15,000
ⓘ Source: listings_history table (triggers on properties + properties_extension) + one-shot
backfill from property_details.listing_events for pre-trigger history.
Climate risk First Street
- Flood 1/10 Low FEMA zone X (unshaded) · 0% chance over 30 yrs
- Wildfire 1/10 Low
- Heat 4/10 Moderate 7 d/yr ≥104°F today · 19 d/yr by 30 yrs out
- Wind 2/10 Low 100% chance of damaging wind over 30 yrs
- Air quality 2/10 Low 1 unhealthy d/yr today · 2 by 30 yrs out
Nearby sold comps map
Loading sold comps map…
Walkable amenities ~0.75 mi
Loading nearby amenities…
Taxation est. · year 1
- Rental income
- $23,890
- − Mortgage interest
- −$8,682
- − Property taxes
- −$2,325
- − Insurance
- −$775
- − Repairs & maintenance
- −$1,911
- − Management
- −$1,911
- − Depreciation
- −$4,509
- Taxable income
- $3,777
- Est. tax owed @ 24.0%
- −$906
- After-tax cash flow
- $5,113/yr
For passive investors: Depreciation is non-cash, so a rental often shows a tax loss while cash-flowing — sheltering income. Rental losses are passive: they offset passive income freely, and up to $25,000/yr can offset ordinary (W-2) income if you actively participate and your MAGI is under $100k (phasing out to $0 by $150k); unused losses carry forward. On sale, claimed depreciation is recaptured at up to 25%, and gains may owe capital-gains tax (a 1031 exchange can defer both). Figures are a year-1 estimate at your 24.0% rate — not tax advice; consult a CPA.
Schools (NCES district)
No district data.
Livability — Borden
- Score
- 61/100
- State rank
- #507
- US rank
- #17982
Category grades
Schools grade is shown separately in the Schools card above.
Census & demographics
- Population (ZIP)
- 4,583
Population outlook (Clark County) Hauer SSP2
- Today (2025)
- 126,401 people
- By 2030
- 131,455 · +4.0%
- By 2040
- 140,471 · +11.1%
- By 2050
- 147,677 · +16.8%
- By 2075
- 161,702 · +27.9%
- By 2100
- 164,078 · +29.8%
Race, ethnicity, and origin ACS 2023
- Neighborhood character
- Predominantly White (95%)
- Race & ethnicity
- White 95% Two or more races 2%
- Common ancestry
- Lithuanian 2% Serbian 2% Italian 2%
- Foreign-born
- 0%
Political lean MEDSL · Clark
- 2024 margin
- Strong R (+20.4) · D 38.9% · R 59.3% · Other 1.8%
- 2008→2024 swing
- -13.3pp toward R · 2008: -7.1pp · 2024: -20.4pp
- All cycles
- 2024: R+20.4 2020: R+18.3 2016: R+22.0 2012: R+9.9 2008: R+7.1
Not yet ingested
- Civics
- —
Market trends
- HPI YoY
- ▲ 21.50%
- Current HPI
- 344.4
- Rent YoY
- —
- Metro
- —
- State GDP YoY
- ▲ 2.90%
- F500 in state
- 18
Industry mix (Fortune 500 HQ in IN)
| Industry | F500 HQs | Revenue |
|---|---|---|
| Industrial Machinery | 2 | $37B |
|
||
| Healthcare | 1 | $177B |
|
||
| Pharmaceuticals | 1 | $45B |
|
||
| Metals / Steel | 1 | $18B |
|
||
| Agriculture | 1 | $17B |
|
||
| Packaging | 1 | $12B |
|
||
Price history
+1032.7% since first listed4 events — show timeline
- 2026-05-05 Listed $169,900 SIRA
- 2016-08-29 Sold (Public Records) $15,000 Public Records
- 2016-08-29 Sold (MLS) $15,000 SIRA
- 2016-07-21 Listed $15,000 SIRA
Property tax history
-1.1%/yrLatest (2024): $285 · +67.8% YoY. Source: county tax records.
Cash-flow waterfall
monthlySold comps — $/sqft
last 12 mo · ≤1 miLoading sold comps…