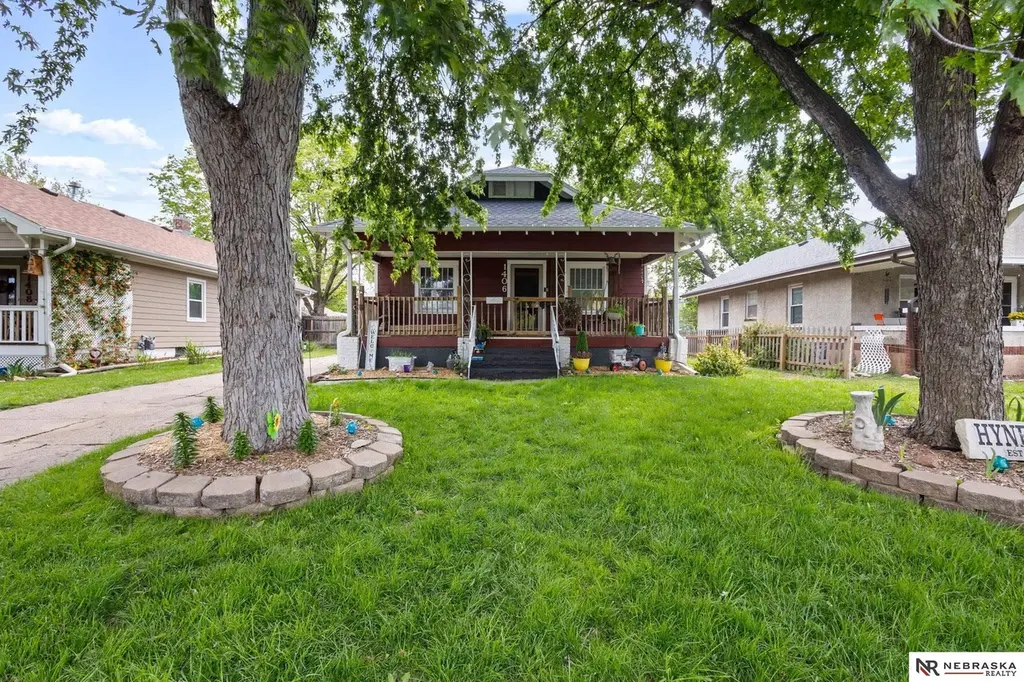
1406 N 10th St · Beatrice, NE
Flood risk 1/10 · Minimal
- FEMA flood zone
- X (unshaded)
- Chance of flooding over 30 yrs
- 0.0%
- Est. flood insurance / yr
- $473 – $860
Fire risk 2/10 · Minimal
- Est. fire insurance / yr
- $1,161 – $2,155
Heat risk 3/10 · Minor
- Hot days now (above 104°F)
- 7 days/yr
- Hot days in 30 yrs
- 16 days/yr
Wind risk 2/10 · Minimal
- Chance of severe wind over 30 yrs
- —
Air-quality risk 1/10 · Minimal
- Unhealthy air days now
- 0 days/yr
- Unhealthy air days in 30 yrs
- 0 days/yr
Risk factors via First Street. Map © Google.
Why this score? — see what drove the C grade
The composite is a weighted blend of 9 inputs, each scored 0–100. Each bar is that input's sub-score; the figure is the points it added to the 100-point composite (weight × sub-score).
- Cash flow +22.5/30.0
- ARV discount +9.3/15.0
- DSCR +7.2/10.0
- 1% rule +5.1/10.0
- Livability +4.0/5.0
- Schools +3.6/10.0
- Rent growth +2.5/5.0
- Condition / age +2.5/5.0
- Appreciation +0.0/10.0
$135,000
🖨 Deal sheet 📄 Offer letter ✓ Due diligence
Listing remarks MLS
Great starter home or investment property! Close to school. Property has been updated w/new carpet & flooring. Paint has been redone throughout most of home. Basement floors have been resealed & in process of epoxying floors in basement. Newer range & refrigerator in kitchen. Nice big backyard with storage shed. Large concrete off street parking area to north of house.
Key facts
- Great curb appeal
- Modern appliances
- Updated flooring
Tags
Property features AI
Exterior
- Parking: No garage
- Utilities: Electricity available; Natural gas available; Public water; Public sewer
- Home design: Single-family residence; Residential property; Built in 1925; Other levels
- Construction: Masonite exterior; Composition roof; Block foundation
- Exterior features: Front porch; Wood fencing; Paved road access; Lot approximately 0.17 acre (about 50 x 150)
Interior
- Bedrooms: Master bedroom on main floor; Additional bedrooms on main floor
- Flooring: Wood flooring
- Bathrooms: One full bathroom (main level)
- Heating & cooling: Natural gas forced-air heating; Central air conditioning
- Interior features: Unfinished basement; Wood flooring; No fireplaces
Neighborhood map
What this means for you Summary
Snapshot
- This is a 3-bed/1.0-bath single-family listed at $135k.
Deal economics
- At list price, monthly cash flow is $227 ($3k/yr) — positive.
- The deal already cash-flows at list — no discount required.
- Meets the 1% rule at list price ($1k rent vs $135k).
- Cap rate 8.3% vs local median 4.7% in Beatrice — top-decile yield for the area; either an underpriced asset or a hidden risk that comps aren't pricing in. Stress-test before assuming the spread holds.
Location & tenants
- Location reads 80/100 on livability (#21 in NE, #1,637 nationally) — a professional / high-income tenant draw. Strengths: crime A+, cost of living A+, housing A+; Watch: employment D+, commute F.
- Beatrice Public Schools (town): math 40% / reading 44% proficiency, ranked #92 of 111 in NE (top 83%) — families likely to look elsewhere, expect single-tenant / working-renter base with shorter leases.
- Zoned schools: Beatrice Community Preschool (226 students, 54% FRL); Beatrice Middle School (math 42% / reading 43%, grade D-, #71 of 128 statewide, top 55%, 421 students, 48% FRL); Beatrice High School (math 47% / reading 57%, grade D+, #98 of 261 statewide, top 40%, 644 students, 43% FRL).
- Market conditions: 112 active listings in the ZIP; 2 comparable units currently listed for rent nearby; 41 units permitted in Gage County in 2024 (14 in 5+ unit buildings).
Forward outlook
- Local home prices are declining (-3.0%/yr); year-one equity from $933 of loan paydown is wiped out by about $4k of value loss. Plan a longer hold.
- Gage County population projected at -15% by 2050 — secular population decline; favor cash flow + early exit over multi-decade hold.
Negotiation context
- Only 5 days on market — expect competitive offers; lowballing is unlikely to land.
- 5 sale attempts since 15y ago with the ask held roughly flat each time — persistent listings suggest the price (not the market) is what's stuck; bring a comps-based counter.
Risks & watch-outs
- Watch-outs: built in 1925 — expect roof / HVAC / electrical / plumbing capex.
Questions for the listing agent
- Built in 1925 — when were the roof, HVAC, electrical panel, plumbing, and water heater last replaced?
- Is there a deadline driving the sale (1031 exchange, divorce, estate, relocation)? That informs how much negotiation room exists.
- What's the average days-on-market for RENTAL listings here right now (not sales)? A rising rental-DOM trend means longer vacancies and softer asking-rent achievability than the comps imply.
- What's the recent tenant-quality profile in this submarket — average credit score on applications, eviction rate, late-payment / NSF rate, and stable-employment percentage? A property-management company in the area should have these aggregated.
- How much new for-sale + rental construction is in the pipeline within 1–3 miles? Heavy new supply typically softens prices + rents 12–24 months out; constrained supply supports both.
Investment metrics
- 1% rule
- 1.01% ✓
- Cap rate
- 8.31%
- Cash-on-cash
- 7.21%
- DSCR
- 1.32
- GRM
- 8.3
CMA / ARV
- ARV (median comp)
- $140,690
- List price
- $135,000
- Delta
- -4.04%
- Verdict
- FAIR
- Comps
- 20 within 1.0 mi
Show comp detail 12 sales within ~0.75 mi
| Address | Dist | Beds/Ba | Sqft | Sold | Price | $/sf | Match |
|---|---|---|---|---|---|---|---|
| 1416 N 11th St | 0.08mi | 3/1.0 | 1,040 (+5%) | 3mo | $148,900 | $143 | 85 |
| 1324 N 7th St | 0.22mi | 3/1.0 | 864 (-13%) | 6mo | $137,500 | $159 | 64 |
| 1406 N 8th St | 0.14mi | 2/1.0 (-1) | 884 (-10%) | 9mo | $153,000 | $173 | 63 |
| 817 N 12th St | 0.42mi | 2/1.0 (-1) | 1,070 (+8%) | 1mo | $165,000 | $154 | 61 |
| 1205 Jackson St | 0.23mi | 2/1.0 (-1) | 859 (-13%) | 2mo | $30,000 | $35 | 61 |
| 902 N 13th St | 0.40mi | 2/1.0 (-1) | 904 (-8%) | 8mo | $108,000 | $119 | 56 |
| 1209 Grant St | 0.70mi | 2/1.0 (-1) | 1,040 (+5%) | 1mo | $159,000 | $153 | 53 |
| 923 N 5th St | 0.51mi | 2/1.0 (-1) | 1,048 (+6%) | 10mo | $110,000 | $105 | 53 |
| 508 N 12th St | 0.65mi | 2/1.0 (-1) | 952 (-4%) | 8mo | $139,000 | $146 | 52 |
| 1711 N 19th St | 0.71mi | 3/1.0 | 1,028 (+4%) | 15mo | $185,000 | $180 | 48 |
| 1623 N 19th St | 0.71mi | 3/1.0 | 1,040 (+5%) | 13mo | $168,000 | $162 | 47 |
| 1020 Summit St | 0.36mi | 2/1.0 (-1) | 850 (-14%) | 14mo | $137,000 | $161 | 44 |
Match score weights: distance 35% · size 25% · config 20% · recency 20%. Top-matched comps best support the ARV.
Projected returns pro-forma
-3.0% appreciation · 3.0% rent growth · sell at horizon
- IRR
- -5.3%
- Equity multiple
- 0.80×
- Total profit
- $-7,454
- Equity at exit
- $20,129
- IRR
- 4.3%
- Equity multiple
- 1.32×
- Total profit
- $11,987
- Equity at exit
- $11,672
Cash invested: $37,800 (down + closing). Projections, not guarantees.
Landlord ↔ Tenant lean methodology
- Overall (STATE)
- 83 Strongly Landlord-Friendly
- State Nebraska
- 83 Strongly Landlord-Friendly · R+13
- County
- — inherits STATE
- City
- — inherits STATE
ZIP-level market 68310
- Home prices YoY
- -26.8%
- Active inventory
- 112
- Price-to-rent
- 8.3×
Monthly cashflow live
- Estimated rent
- $1,357 medium interval (Pro) →
- Mortgage (P&I)
- −$708
- Tax from tax record
- −$81 /mo · $968/yr
- Insurance
- −$56
- HOA
- −$0
- Vacancy / Maint / Mgmt
- −$285
- Net cashflow
- $227
Break-even live
UW: 25.0% down · 7.5% · 30yr · 1.5% tax · 5.0% vac · 8.0% maint · 8.0% mgmt
Financing live
Cash to close
- Down payment
- $33,750
- Closing costs
- $4,050
- Reserves months
- —
- Total cash needed
- —
Loan-product check · same deal, 3 products live
Conventional
25% down · 7.5% · 30yr
- Down + closing
- —
- Monthly P&I
- —
- Monthly cashflow
- —
- DSCR
- —
- Eligible?
- —
Personal DTI + credit; lowest rate.
DSCR
20% down · 8.5% · 30yr
- Down + closing
- —
- Monthly P&I
- —
- Monthly cashflow
- —
- DSCR
- —
- Eligible?
- —
No personal income docs; deal must DSCR.
Hard money
10% down · 12.0% · 12mo
- Down + closing
- —
- Monthly P&I
- —
- Monthly cashflow
- —
- DSCR
- —
- Eligible?
- —
Short-term bridge; refi at stabilization.
Rent comps 2 comps
| Address | Beds | Baths | Sqft | Rent | $/sqft | DOM | Units | Dist |
|---|---|---|---|---|---|---|---|---|
| 527 Irving St Beatrice, NE | 1.0–2.0 | 1.0–2.0 | 915 | $1,295 | $1.42 | 43d | 10 | 0.28mi |
| 1212 Elk St Beatrice, NE | 2.0 | 2.0 | 816 | $1,550 | $1.90 | 43d | 1 | 0.84mi |
Listing history 14 events
-
2026-05-12status Pending 737-char remark
-
2026-04-28$135,000 New 737-char remark
-
2022-09-16historical
-
2022-07-29price $105,000
-
2022-06-01$115,000 Active - New
-
2018-03-16soldstatus $66,000
Show marketing remark (383 chars)
Great starter home or investment property! Close to school. Property has been updated w/new carpet & flooring. Paint has been redone throughout most of home. Basement floors have been resealed & in process of epoxying floors in basement. Newer range & refrigerator in kitchen. Nice big backyard with storage shed. Large concrete off street parking area to north of house.
-
2017-11-14$62,500
Show marketing remark (383 chars)
Great starter home or investment property! Close to school. Property has been updated w/new carpet & flooring. Paint has been redone throughout most of home. Basement floors have been resealed & in process of epoxying floors in basement. Newer range & refrigerator in kitchen. Nice big backyard with storage shed. Large concrete off street parking area to north of house.
-
2012-05-23soldstatus $59,000
-
2012-04-04soldstatus $55,000
-
2012-03-30soldstatus $55,000
-
2012-01-31$59,900
-
2011-04-14historical
-
2011-02-26$58,500
ⓘ Source: listings_history table (triggers on properties + properties_extension) + one-shot
backfill from property_details.listing_events for pre-trigger history.
Tax reassessment forecast NE · Resets to sale price
- Current annual tax
- $968 · $81/mo
- Projected year-2 tax
- $2,336 · $195/mo
- Expected delta
- +$1,367/yr (+$114/mo · 141.3%)
ⓘ Screening estimate from a state-policy table — verify with the county assessor before closing.
Climate risk First Street
- Flood 1/10 Low FEMA zone X (unshaded) · 0% chance over 30 yrs
- Wildfire 2/10 Low
- Heat 3/10 Moderate 7 d/yr ≥104°F today · 16 d/yr by 30 yrs out
- Wind 2/10 Low
- Air quality 1/10 Low 0 unhealthy d/yr today · 0 by 30 yrs out
Nearby sold comps map
Loading sold comps map…
Walkable amenities ~0.75 mi
Loading nearby amenities…
Taxation est. · year 1
- Rental income
- $16,281
- − Mortgage interest
- −$7,562
- − Property taxes
- −$968
- − Insurance
- −$675
- − Repairs & maintenance
- −$1,302
- − Management
- −$1,302
- − Depreciation
- −$3,927
- Taxable income
- $544
- Est. tax owed @ 24.0%
- −$130
- After-tax cash flow
- $2,593/yr
For passive investors: Depreciation is non-cash, so a rental often shows a tax loss while cash-flowing — sheltering income. Rental losses are passive: they offset passive income freely, and up to $25,000/yr can offset ordinary (W-2) income if you actively participate and your MAGI is under $100k (phasing out to $0 by $150k); unused losses carry forward. On sale, claimed depreciation is recaptured at up to 25%, and gains may owe capital-gains tax (a 1031 exchange can defer both). Figures are a year-1 estimate at your 24.0% rate — not tax advice; consult a CPA.
Schools (NCES district)
- District
- Beatrice Public Schools
- NCES district ID
- 3103600
- Math proficiency
- 40% ▼ -12.00%
- Reading proficiency
- 44% ▼ -6.00%
- Median HH income
- $44,020
- Composite
- 35.57/100
- National rank
- #4899
- State rank
- #92 of 111 in NE
Livability — Beatrice
- Score
- 80/100
- State rank
- #21
- US rank
- #1637
Category grades
Schools grade is shown separately in the Schools card above.
Census & demographics
- Census place
- Beatrice, NE
- County
- Gage County · 14,093 people
- City population
- 14,093
- Metro
- Beatrice, NE
- Population (ZIP)
- 14,093
- Household income
- $60,928
- Rent vs Own
- Severe rent burden
- 369.0
Population outlook (Gage County) Hauer SSP2
- Today (2025)
- 21,133 people
- By 2030
- 20,629 · -2.4%
- By 2040
- 19,398 · -8.2%
- By 2050
- 18,049 · -14.6%
- By 2075
- 15,504 · -26.6%
- By 2100
- 12,941 · -38.8%
Race, ethnicity, and origin ACS 2023
- Neighborhood character
- Predominantly White (93%)
- Race & ethnicity
- White 93% Hispanic / Latino 3% Two or more races 2%
- Common ancestry
- Iranian 2% Lithuanian 2% Serbian 2%
- Foreign-born
- 2% · Canada, Guatemala, China
- Languages at home
- 96% English-only · Spanish 2% German/W. Germanic 1%
Political lean MEDSL · Gage
- 2024 margin
- Solid R (+39.2) · D 29.7% · R 68.9% · Other 1.4%
- 2008→2024 swing
- -29.8pp toward R · 2008: -9.5pp · 2024: -39.2pp
- All cycles
- 2024: R+39.2 2020: R+36.5 2016: R+34.5 2012: R+16.8 2008: R+9.5
Not yet ingested
- Civics
- —
Market trends
- HPI YoY
- ▼ -89.13%
- Current HPI
- 243.8948
- Rent YoY
- —
- Metro
- Beatrice, NE
- State GDP YoY
- ▲ 0.68%
- F500 in state
- 2
Industry mix (Fortune 500 HQ in NE)
| Industry | F500 HQs | Revenue |
|---|---|---|
| Conglomerate | 1 | $371B |
|
||
Price history
+122.2% since first listed15 events — show timeline
- 2026-06-12 Sold (MLS) $130,000 GPRMLS
- 2026-05-12 Pending — GPRMLS
- 2026-04-28 Listed $135,000 GPRMLS
- 2022-09-16 Listing Removed — GPRMLS
- 2022-07-29 Price Changed $105,000 GPRMLS
- 2022-06-01 Listed $115,000 GPRMLS
- 2018-03-16 Sold (Public Records) $66,000 Public Records
- 2018-03-16 Sold (MLS) $66,000 GPRMLS
- 2017-11-14 Listed $62,500 GPRMLS
- 2012-05-23 Sold (Public Records) $59,000 Public Records
- 2012-04-04 Sold (Public Records) $55,000 Public Records
- 2012-03-30 Sold (MLS) $55,000 GPRMLS
- 2012-01-31 Listed $59,900 GPRMLS
- 2011-04-14 Listing Removed — GPRMLS
- 2011-02-26 Listed $58,500 GPRMLS
Property tax history
-0.2%/yrLatest (2025): $968 · -16.9% YoY. Source: county tax records.
Cash-flow waterfall
monthlySold comps — $/sqft
last 12 mo · ≤1 miLoading sold comps…