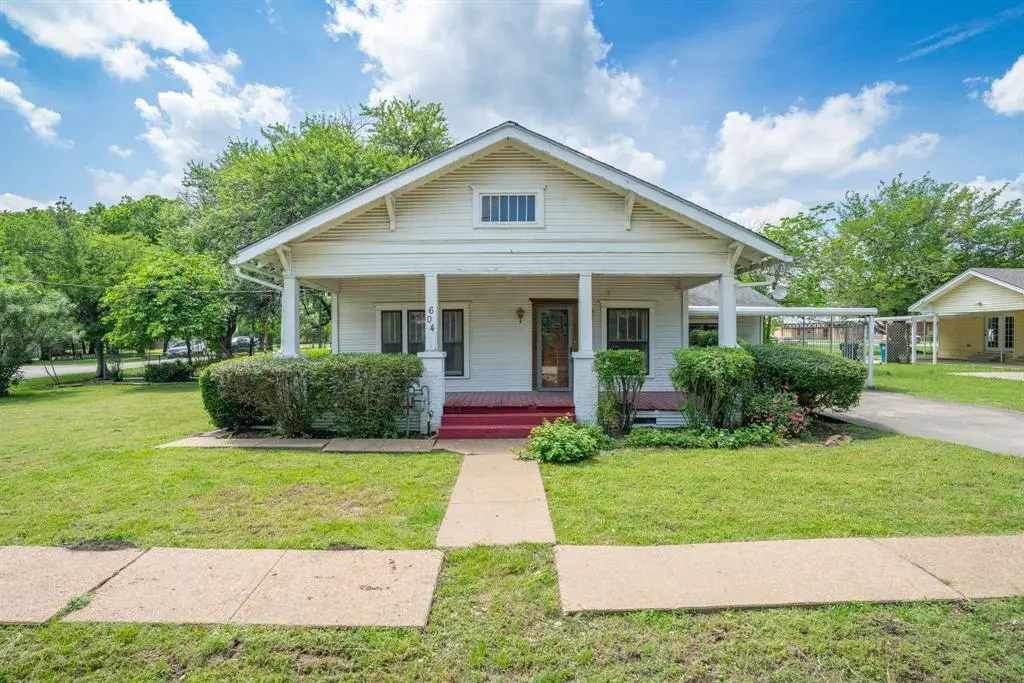
604 S Pearl St · Trenton, TX
Flood risk 1/10 · Minimal
- FEMA flood zone
- X (unshaded)
- Chance of flooding over 30 yrs
- 0.0%
- Est. flood insurance / yr
- $507 – $1,088
Fire risk 7/10 · Major
- Est. fire insurance / yr
- $1,222 – $2,270
Heat risk 7/10 · Major
- Hot days now (above 109°F)
- 7 days/yr
- Hot days in 30 yrs
- 21 days/yr
Wind risk 6/10 · Moderate
- Chance of severe wind over 30 yrs
- 27.0%
Air-quality risk 2/10 · Minimal
- Unhealthy air days now
- 1 days/yr
- Unhealthy air days in 30 yrs
- 1 days/yr
Risk factors via First Street. Map © Google.
Why this score? — see what drove the B- grade
The composite is a weighted blend of 9 inputs, each scored 0–100. Each bar is that input's sub-score; the figure is the points it added to the 100-point composite (weight × sub-score).
- Cash flow +18.7/30.0
- ARV discount +15.0/15.0
- Appreciation +10.0/10.0
- DSCR +5.9/10.0
- 1% rule +5.1/10.0
- Schools +3.1/10.0
- Livability +3.0/5.0
- Rent growth +2.5/5.0
- Condition / age +2.5/5.0
$199,000
🖨 Deal sheet 📄 Offer letter ✓ Due diligence
Listing remarks
Tucked beneath a canopy of mature trees on an oversized corner lot, this 1920s Craftsman exudes a dreamy, storybook charm that’s hard to find. From the moment you arrive, you’ll feel the character of a bygone era—inviting front porch, timeless architectural details, and a warmth that lingers throughout. Inside, you’ll find three bedrooms and two bathrooms, with original touches that speak to the home’s history and soul. This home is full of charm and possibility, ready for someone with vision to bring it back to life and make it their own. Whether you’re drawn to restoring its classic beauty or adding your own modern touches, the potential here is undenia
Key facts
- Oversized corner lot
- Original touches
- Inviting front porch
Tags
Property features AI
Finance
- Other: Property type: Single Family Residence; Subdivision: Riley Add; County: Fannin
- Financial info: Listing terms: Cash; Loan type: Treat as clear; No second mortgage indicated
- HOA & community: No homeowners association
Exterior
- Parking: Attached carport; 2 covered/carport spaces; Driveway
- Utilities: City water; City sewer; All-weather road access; Sidewalk
- Home design: Single-family residence; Residential property; One story; Preowned (built 1920)
- Construction: Siding and wood construction; Composition roof; Pillar/post/pier foundation; Year built: 1920
- Exterior features: Covered porch; Covered patio/porch areas; Chain link fencing; Corner lot; Landscaped yard; Many trees
Interior
- Kitchen: Dishwasher; Gas range; Refrigerator
- Bedrooms: 3 bedrooms (primary bedroom on level 1, approx. 13 x 13)
- Flooring: Carpet; Linoleum
- Bathrooms: 2 full bathrooms
- Heating & cooling: Central heating; Central air; Ceiling fans
- Interior features: Decorative lighting; Natural woodwork; Two living areas; One dining area; One-level layout
- Laundry & utility: Utility room with full-size washer/dryer area
Neighborhood map
What this means for you Summary
Snapshot
- This is a 3-bed/2.0-bath single-family listed at $199k.
Deal economics
- At list price, monthly cash flow is $196 ($2k/yr) — positive.
- The deal already cash-flows at list — no discount required.
- Meets the 1% rule at list price ($2k rent vs $199k).
- Recommended offer: $196k (1.5% below list) — sets the bar for market timing.
- Cap rate 7.5% vs local median 2.7% in Trenton — top-decile yield for the area; either an underpriced asset or a hidden risk that comps aren't pricing in. Stress-test before assuming the spread holds.
Location & tenants
- Location reads 59/100 on livability (#1,108 in TX) — a working-class tenant base; expect higher turnover. Strengths: cost of living A+, housing A+, employment B+; Watch: schools C-, crime D, amenities F.
- Trenton ISD (rural): math 27% / reading 43% proficiency, ranked #483 of 826 in TX (top 58%) — families likely to look elsewhere, expect single-tenant / working-renter base with shorter leases.
- Market conditions: 165 active listings in the ZIP; 1 comparable units currently listed for rent nearby; 82 units permitted in Fannin County in 2024 (0 in 5+ unit buildings).
Forward outlook
- In year one you build about $21k of equity ($1k loan paydown + $20k appreciation (10.0% local appreciation)).
- Fannin County population projected to shrink 6% by 2050 — rents likely to lag national; underwrite the cash flow, not the appreciation.
- At projected returns (10.0% appreciation + 3.0% rent growth), your $56k cash investment doubles in ~3 years — after that, you're playing with house money.
- By year 2, paydown + projected appreciation supports a ~$34k cash-out refi (75% LTV) — recoverable capital for the next deal without selling this one.
Negotiation context
- It's been on market 29 days — a 2% lower offer ($196k) is reasonable based on typical stale-listing flexibility.
Risks & watch-outs
- Watch-outs: built in 1920 — expect roof / HVAC / electrical / plumbing capex.
- Climate carrying-cost: major wind risk, 27% chance of damaging wind over 30y; major wildfire risk; extreme-heat days projected 7→21/yr by 2055 (HVAC capex compounding) — expect insurance premiums to compound above CPI over the hold.
Questions for the listing agent
- Built in 1920 — when were the roof, HVAC, electrical panel, plumbing, and water heater last replaced?
- Is there a deadline driving the sale (1031 exchange, divorce, estate, relocation)? That informs how much negotiation room exists.
- Crime grade is D in this area — have there been break-ins, vandalism, or insurance claims at this property in the last 3 years? What carrier currently insures it and at what premium?
- What's the average days-on-market for RENTAL listings here right now (not sales)? A rising rental-DOM trend means longer vacancies and softer asking-rent achievability than the comps imply.
- What's the recent tenant-quality profile in this submarket — average credit score on applications, eviction rate, late-payment / NSF rate, and stable-employment percentage? A property-management company in the area should have these aggregated.
- How much new for-sale + rental construction is in the pipeline within 1–3 miles? Heavy new supply typically softens prices + rents 12–24 months out; constrained supply supports both.
Investment metrics
- 1% rule
- 1.01% ✓
- Cap rate
- 7.47%
- Cash-on-cash
- 4.21%
- DSCR
- 1.19
- GRM
- 8.3
CMA / ARV
- ARV (median comp)
- $263,754
- List price
- $199,000
- Delta
- -24.55%
- Verdict
- UNDERPRICED
- Comps
- 20 within 1.0 mi
Show comp detail 12 sales within ~0.75 mi
| Address | Dist | Beds/Ba | Sqft | Sold | Price | $/sf | Match |
|---|---|---|---|---|---|---|---|
| 118 Indian Crk | 0.29mi | 3/2.0 | 1,829 (-5%) | 2mo | $415,995 | $227 | 76 |
| 1304 Cole Dr | 0.32mi | 3/2.0 | 1,898 (-2%) | 9mo | $359,990 | $190 | 74 |
| 1102 Alexander St | 0.53mi | 3/2.0 | 1,878 (-3%) | 5mo | $319,000 | $170 | 66 |
| 1606 Olivia Dr | 0.45mi | 4/2.0 (+1) | 2,038 (+6%) | 2mo | $359,900 | $177 | 63 |
| 1506 Latimer Ct | 0.52mi | 3/2.0 | 1,840 (-5%) | 8mo | $329,900 | $179 | 62 |
| 1524 Latimer Ct | 0.49mi | 3/2.0 | 1,819 (-6%) | 9mo | $342,990 | $189 | 60 |
| 1286 Emily Dr | 0.46mi | 4/2.0 (+1) | 2,042 (+6%) | 7mo | $363,900 | $178 | 58 |
| 309 Kelcey Ct | 0.61mi | 3/2.0 | 1,850 (-4%) | 10mo | $319,900 | $173 | 56 |
| 1267 Emily Dr | 0.47mi | 4/3.0 (+1) | 2,098 (+9%) | 1mo | $364,900 | $174 | 54 |
| 1209 Anderson Dr | 0.46mi | 4/3.0 (+1) | 2,098 (+9%) | 8mo | $385,900 | $184 | 49 |
| 407 W Saunders St | 0.40mi | 3/2.5 | 2,201 (+14%) | 12mo | $460,000 | $209 | 46 |
| 549 Augustus St | 0.61mi | 4/4.0 (+1) | 2,171 (+12%) | 6mo | $334,999 | $154 | 33 |
Match score weights: distance 35% · size 25% · config 20% · recency 20%. Top-matched comps best support the ARV.
Projected returns pro-forma
10.0% appreciation · 3.0% rent growth · sell at horizon
- IRR
- 27.3%
- Equity multiple
- 3.17×
- Total profit
- $120,881
- Equity at exit
- $179,275
- IRR
- 23.9%
- Equity multiple
- 7.21×
- Total profit
- $346,243
- Equity at exit
- $386,613
Cash invested: $55,720 (down + closing). Projections, not guarantees.
Landlord ↔ Tenant lean methodology
- Overall (STATE)
- 87 Strongly Landlord-Friendly
- State Texas
- 87 Strongly Landlord-Friendly · R+5
- County
- — inherits STATE
- City
- — inherits STATE
ZIP-level market 75490
- Home prices YoY
- 5.6%
- Active inventory
- 165
- Price-to-rent
- 8.3×
Monthly cashflow live
- Estimated rent
- $2,000 medium interval (Pro) →
- Mortgage (P&I)
- −$1,044
- Tax from tax record
- −$258 /mo · $3,094/yr
- Insurance
- −$83
- HOA
- −$0
- Vacancy / Maint / Mgmt
- −$420
- Net cashflow
- $196
Break-even live
UW: 25.0% down · 7.5% · 30yr · 1.5% tax · 5.0% vac · 8.0% maint · 8.0% mgmt
Financing live
Cash to close
- Down payment
- $49,750
- Closing costs
- $5,970
- Reserves months
- —
- Total cash needed
- —
Loan-product check · same deal, 3 products live
Conventional
25% down · 7.5% · 30yr
- Down + closing
- —
- Monthly P&I
- —
- Monthly cashflow
- —
- DSCR
- —
- Eligible?
- —
Personal DTI + credit; lowest rate.
DSCR
20% down · 8.5% · 30yr
- Down + closing
- —
- Monthly P&I
- —
- Monthly cashflow
- —
- DSCR
- —
- Eligible?
- —
No personal income docs; deal must DSCR.
Hard money
10% down · 12.0% · 12mo
- Down + closing
- —
- Monthly P&I
- —
- Monthly cashflow
- —
- DSCR
- —
- Eligible?
- —
Short-term bridge; refi at stabilization.
Rent comps 1 comps
| Address | Beds | Baths | Sqft | Rent | $/sqft | DOM | Units | Dist |
|---|---|---|---|---|---|---|---|---|
| 340 Sunnyside Dr Unit B Trenton, TX | 3.0 | 3.5 | 1673 | $2,000 | $1.20 | 1d | 1 | 0.70mi |
Listing history 2 events
-
2026-05-09price $199,000 1080-char remark
-
2026-04-26$210,000 Active 1080-char remark
ⓘ Source: listings_history table (triggers on properties + properties_extension) + one-shot
backfill from property_details.listing_events for pre-trigger history.
Tax reassessment forecast TX · Resets to sale price
- Current annual tax
- $3,094 · $258/mo
- Projected year-2 tax
- $3,642 · $303/mo
- Expected delta
- +$548/yr (+$46/mo · 17.7%)
ⓘ Screening estimate from a state-policy table — verify with the county assessor before closing.
Climate risk First Street
- Flood 1/10 Low FEMA zone X (unshaded) · 0% chance over 30 yrs
- Wildfire 7/10 Severe
- Heat 7/10 Severe 7 d/yr ≥109°F today · 21 d/yr by 30 yrs out
- Wind 6/10 Major 27% chance of damaging wind over 30 yrs
- Air quality 2/10 Low 1 unhealthy d/yr today · 1 by 30 yrs out
Nearby sold comps map
Loading sold comps map…
Walkable amenities ~0.75 mi
Loading nearby amenities…
Taxation est. · year 1
- Rental income
- $24,000
- − Mortgage interest
- −$11,147
- − Property taxes
- −$3,094
- − Insurance
- −$995
- − Repairs & maintenance
- −$1,920
- − Management
- −$1,920
- − Depreciation
- −$5,789
- Taxable loss
- −$865
- Est. tax savings @ 24.0%
- +$208
- After-tax cash flow
- $2,556/yr
For passive investors: Depreciation is non-cash, so a rental often shows a tax loss while cash-flowing — sheltering income. Rental losses are passive: they offset passive income freely, and up to $25,000/yr can offset ordinary (W-2) income if you actively participate and your MAGI is under $100k (phasing out to $0 by $150k); unused losses carry forward. On sale, claimed depreciation is recaptured at up to 25%, and gains may owe capital-gains tax (a 1031 exchange can defer both). Figures are a year-1 estimate at your 24.0% rate — not tax advice; consult a CPA.
Schools (NCES district)
- District
- Trenton ISD
- NCES district ID
- 4843140
- Math proficiency
- 27% ▼ -16.00%
- Reading proficiency
- 43% ▼ -11.00%
- Median HH income
- $61,383
- Composite
- 31.38/100
- National rank
- #5993
- State rank
- #483 of 826 in TX
Livability — Trenton
- Score
- 59/100
- State rank
- #1108
- US rank
- #19614
Category grades
Schools grade is shown separately in the Schools card above.
Census & demographics
- Census place
- Trenton, TX
- Population (ZIP)
- 3,024
Population outlook (Fannin County) Hauer SSP2
- Today (2025)
- 33,423 people
- By 2030
- 33,035 · -1.2%
- By 2040
- 32,250 · -3.5%
- By 2050
- 31,462 · -5.9%
- By 2075
- 29,447 · -11.9%
- By 2100
- 25,459 · -23.8%
Race, ethnicity, and origin ACS 2023
- Neighborhood character
- Predominantly White (84%)
- Race & ethnicity
- White 84% Hispanic / Latino 10% Two or more races 8% Black 5%
- Hispanic origin (detail)
- Mexican 8%
- Common ancestry
- Slovak 1%
- Foreign-born
- 3% · Canada, Dominican Republic
- Languages at home
- 95% English-only · Spanish 5%
Political lean MEDSL · Fannin
- 2024 margin
- Solid R (+67.4) · D 15.9% · R 83.3%
- 2008→2024 swing
- -27.8pp toward R · 2008: -39.6pp · 2024: -67.4pp
- All cycles
- 2024: R+67.4 2020: R+63.4 2016: R+61.9 2012: R+52.5 2008: R+39.6
Not yet ingested
- Civics
- —
Market trends
- HPI YoY
- ▲ 16.09%
- Current HPI
- 301.2127
- Rent YoY
- —
- Metro
- —
- State GDP YoY
- ▲ 3.95%
- F500 in state
- 110
Industry mix (Fortune 500 HQ in TX)
| Industry | F500 HQs | Revenue |
|---|---|---|
| Energy | 16 | $1,198B |
|
||
| Technology | 5 | $198B |
|
||
| Engineering / Construction | 4 | $72B |
|
||
| Energy Services | 3 | $60B |
|
||
| Utilities | 3 | $41B |
|
||
| Healthcare | 2 | $330B |
|
||
Price history
-5.2% since first listed2 events — show timeline
- 2026-05-09 Price Changed $199,000 NTREIS
- 2026-04-26 Listed $210,000 NTREIS
Property tax history
+7.3%/yrLatest (2025): $3,094 · +2.9% YoY. Source: county tax records.
Cash-flow waterfall
monthlySold comps — $/sqft
last 12 mo · ≤1 miLoading sold comps…