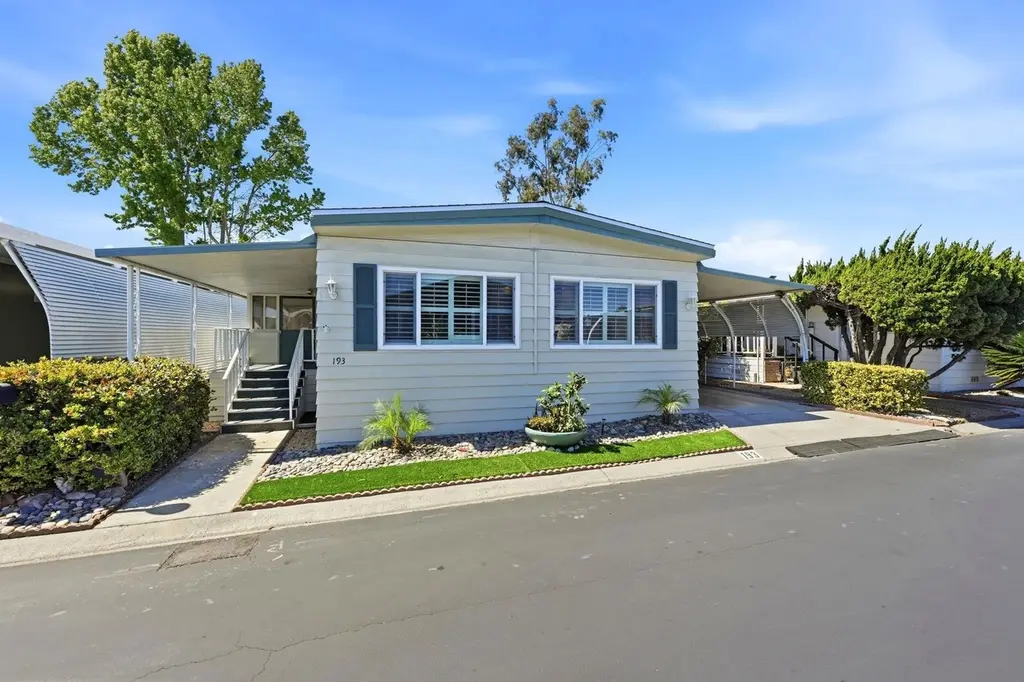
3535 Linda Vis Spc 193 · San Marcos, CA
Flood risk 1/10 · Minimal
- FEMA flood zone
- X (unshaded)
- Chance of flooding over 30 yrs
- 0.0%
- Est. flood insurance / yr
- $507 – $1,088
Fire risk 1/10 · Minimal
- Est. fire insurance / yr
- $659 – $1,223
Heat risk 4/10 · Minor
- Hot days now (above 93°F)
- 7 days/yr
- Hot days in 30 yrs
- 21 days/yr
Wind risk 1/10 · Minimal
- Chance of severe wind over 30 yrs
- —
Air-quality risk 4/10 · Minor
- Unhealthy air days now
- 4 days/yr
- Unhealthy air days in 30 yrs
- 4 days/yr
Risk factors via First Street. Map © Google.
Why this score? — see what drove the C- grade
The composite is a weighted blend of 9 inputs, each scored 0–100. Each bar is that input's sub-score; the figure is the points it added to the 100-point composite (weight × sub-score).
- Cash flow +18.7/30.0
- ARV discount +7.1/15.0
- DSCR +5.9/10.0
- Schools +5.4/10.0
- 1% rule +5.0/10.0
- Livability +3.9/5.0
- Rent growth +2.6/5.0
- Condition / age +2.5/5.0
- Appreciation +0.0/10.0
$339,500
🖨 Deal sheet 📄 Offer letter ✓ Due diligence
Listing remarks MLS
Beautiful home located in a 55+ resort style community offering many recent upgrades. This home features vinyl plank flooring throughout, remodeled kitchen includes a new pantry, updated bathrooms, new interior doors and hardware, and dual pane windows throughout (except in bathrooms). The kitchen includes a stove, oven, and a microwave. Outside the home, there are two storage sheds and a brand new roof. The community also features a clubhouse and swimming pool for the leisure of its residents. Conveniently located near shopping, public transportation, schools, and major freeways this home has the perfect location for everyday living. * The above information including square footage is based on data received from the seller and/or from public sources. This information is deemed reliable but has not been independently verified and cannot be guaranteed. Prospective buyers are advised to verify information to their own satisfaction prior to purchase. Pictures may not depict exact home details.
Key facts
- New pantry
- Remodeled kitchen
- Updated bathrooms
Tags
Neighborhood map
What this means for you Summary
Snapshot
- This is a 2-bed/2.0-bath manufactured listed at $340k.
Deal economics
- At list price, monthly cash flow is $334 ($4k/yr) — positive.
- The deal already cash-flows at list — no discount required.
- To meet the 1% rule (rent ≥ 1% of price), the offer needs to be $339k (0.1% below list).
- Recommended offer: $319k (6.0% below list) — sets the bar for market timing.
- Cap rate 7.5% vs local median 2.5% in San Marcos — top-decile yield for the area; either an underpriced asset or a hidden risk that comps aren't pricing in. Stress-test before assuming the spread holds.
Location & tenants
- Location reads 77/100 on livability (#80 in CA, #3,074 nationally) — a middle-class / working-renter tenant base. Strengths: amenities A+, commute A+, employment A+; Watch: health & safety D+, cost of living F.
- San Marcos Unified (suburban): math 52% / reading 67% proficiency, ranked #249 of 1,400 in CA (top 18%) — acceptable for families but not a draw, mixed tenant base, ~2y average lease.
- Market conditions: Rents flat; 232 active listings in the ZIP; 25 comparable units currently listed for rent nearby; rentals at typical pace (median 24d on market — plan ~3-4 weeks tenant-placement turnaround); high-income renter base; 11,759 units permitted in San Diego County in 2024 (7,244 in 5+ unit buildings).
- This rent runs 34% of the median local income ($120k/yr) — at the standard rent-burdened threshold; future hikes will face affordability resistance.
Forward outlook
- Local home prices are declining (-3.0%/yr); year-one equity from $2k of loan paydown is wiped out by about $10k of value loss. Plan a longer hold.
- San Diego County population projected at +20% by 2050 — long-run rental-demand tailwind backs the buy-and-hold thesis.
Negotiation context
- It's been on market 61 days — a 6% lower offer ($319k) is reasonable based on typical stale-listing flexibility.
- 9 sale attempts since 24y ago with the ask held roughly flat each time — persistent listings suggest the price (not the market) is what's stuck; bring a comps-based counter.
Questions for the listing agent
- It's been on market 61 days. Have you received any prior offers? Is the seller open to a 6% concession, seller financing, or rate buy-down credit?
- Built in 1972 — when were the roof, HVAC, electrical panel, plumbing, and water heater last replaced?
- Why hasn't it sold? Are there any deal-killer items the seller is aware of (foundation, flood, title, zoning, code violations)?
- Is there a deadline driving the sale (1031 exchange, divorce, estate, relocation)? That informs how much negotiation room exists.
- What's the average days-on-market for RENTAL listings here right now (not sales)? A rising rental-DOM trend means longer vacancies and softer asking-rent achievability than the comps imply.
- What's the recent tenant-quality profile in this submarket — average credit score on applications, eviction rate, late-payment / NSF rate, and stable-employment percentage? A property-management company in the area should have these aggregated.
- How much new for-sale + rental construction is in the pipeline within 1–3 miles? Heavy new supply typically softens prices + rents 12–24 months out; constrained supply supports both.
Investment metrics
- 1% rule
- 1.00% ✗
- Cap rate
- 7.47%
- Cash-on-cash
- 4.21%
- DSCR
- 1.19
- GRM
- 8.3
CMA / ARV
- ARV (median comp)
- $336,634
- List price
- $339,500
- Delta
- 0.85%
- Verdict
- FAIR
- Comps
- 20 within 1.0 mi
Show comp detail 12 sales within ~0.75 mi
| Address | Dist | Beds/Ba | Sqft | Sold | Price | $/sf | Match |
|---|---|---|---|---|---|---|---|
| 3535 Linda Vista Dr Spc 29 | 0.00mi | 2/2.0 | 1,440 (0%) | 1mo | $250,000 | $174 | 99 |
| 3535 Linda Vista Dr #50 | 0.00mi | 2/2.0 | 1,368 (-5%) | 1mo | $358,000 | $262 | 91 |
| 1930 W San Marcos Blvd #374 | 0.26mi | 2/2.0 | 1,440 (0%) | 1mo | $385,000 | $267 | 87 |
| 3535 Linda Vista Dr #321 | 0.00mi | 3/2.0 (+1) | 1,344 (-7%) | 1mo | $275,000 | $205 | 83 |
| 1930 W San Marcos Blvd #191 | 0.26mi | 2/2.0 | 1,488 (+3%) | 1mo | $310,000 | $208 | 81 |
| 3535 Linda Vista Dr #255 | 0.00mi | 2/2.0 | 1,624 (+13%) | 2mo | $285,000 | $175 | 77 |
| 1930 W San Marcos Blvd #437 | 0.26mi | 3/2.0 (+1) | 1,531 (+6%) | 2mo | $475,000 | $310 | 71 |
| 650 S Rancho Santa Fe Rd #312 | 0.38mi | 2/2.0 | 1,344 (-7%) | 1mo | $267,000 | $199 | 71 |
| 650 S Rancho Santa Fe. Rd #294 | 0.37mi | 2/2.0 | 1,344 (-7%) | 2mo | $228,500 | $170 | 70 |
| 1930 W San Marcos Blvd #425 | 0.26mi | 3/2.0 (+1) | 1,344 (-7%) | 2mo | $320,000 | $238 | 70 |
| 650 S Rancho Santa Fe Rd #54 | 0.38mi | 2/2.0 | 1,248 (-13%) | 2mo | $260,000 | $208 | 58 |
| 2010 W San Marcos Blvd #54 | 0.63mi | 3/2.0 (+1) | 1,344 (-7%) | 1mo | $684,999 | $510 | 54 |
Match score weights: distance 35% · size 25% · config 20% · recency 20%. Top-matched comps best support the ARV.
Projected returns pro-forma
-3.0% appreciation · 0.35% rent growth · sell at horizon
- IRR
- -12.7%
- Equity multiple
- 0.55×
- Total profit
- $-42,530
- Equity at exit
- $50,621
- IRR
- -8.4%
- Equity multiple
- 0.54×
- Total profit
- $-43,760
- Equity at exit
- $29,354
Cash invested: $95,060 (down + closing). Projections, not guarantees.
Landlord ↔ Tenant lean methodology
- Overall (STATE)
- 18 Strongly Tenant-Friendly
- State California
- 18 Strongly Tenant-Friendly · D+13
- County
- — inherits STATE
- City
- — inherits STATE
ZIP-level market 92078
- Rents YoY
- 0.3%
- Active inventory
- 232
- Price-to-rent
- 8.3×
Monthly cashflow live
- Estimated rent
- $3,392 high interval (Pro) →
- Mortgage (P&I)
- −$1,780
- Tax est. 1.5%
- −$424 /mo · $5,092/yr
- Insurance
- −$141
- HOA
- −$0
- Vacancy / Maint / Mgmt
- −$712
- Net cashflow
- $334
Break-even live
UW: 25.0% down · 7.5% · 30yr · 1.5% tax · 5.0% vac · 8.0% maint · 8.0% mgmt
Financing live
Cash to close
- Down payment
- $84,875
- Closing costs
- $10,185
- Reserves months
- —
- Total cash needed
- —
Loan-product check · same deal, 3 products live
Conventional
25% down · 7.5% · 30yr
- Down + closing
- —
- Monthly P&I
- —
- Monthly cashflow
- —
- DSCR
- —
- Eligible?
- —
Personal DTI + credit; lowest rate.
DSCR
20% down · 8.5% · 30yr
- Down + closing
- —
- Monthly P&I
- —
- Monthly cashflow
- —
- DSCR
- —
- Eligible?
- —
No personal income docs; deal must DSCR.
Hard money
10% down · 12.0% · 12mo
- Down + closing
- —
- Monthly P&I
- —
- Monthly cashflow
- —
- DSCR
- —
- Eligible?
- —
Short-term bridge; refi at stabilization.
Rent comps 25 comps
| Address | Beds | Baths | Sqft | Rent | $/sqft | DOM | Units | Dist |
|---|---|---|---|---|---|---|---|---|
| 3919 Las Cruces Ave San Marcos, CA | 3.0 | 2.0 | 1100 | $3,200 | $2.91 | 5d | 1 | 0.31mi |
| 658 Las Flores Dr San Marcos, CA | 3.0 | 1.0 | 1284 | $3,650 | $2.84 | 43d | 1 | 0.32mi |
| 3815 La Rosa Dr San Marcos, CA | 3.0 | 1.0 | 1014 | $3,700 | $3.65 | 12d | 1 | 0.39mi |
| 3834 La Rosa Dr Unit A San Marcos, CA | 2.0 | 1.0 | 1014 | $4,200 | $4.14 | 43d | 1 | 0.44mi |
| 2010 W San Marcos Blvd San Marcos, CA | 2.0 | 2.0 | 1288 | $4,000 | $3.11 | 43d | 1 | 0.53mi |
| 1643 Rue de Valle San Marcos, CA | 2.0 | 1.5 | 1086 | $3,222 | $2.97 | 17d | 1 | 0.53mi |
| 830 S Rancho Santa Fe Rd San Marcos, CA | 1.0–2.0 | 1.0–2.0 | 826 | $3,150 | $3.81 | 2d | 5 | 0.58mi |
| 603 Beverly Pl San Marcos, CA | 2.0 | 1.5 | 1068 | $3,150 | $2.95 | 43d | 1 | 0.61mi |
| 910 S Rancho Santa Fe Rd Unit 1 San Marcos, CA | 2.0 | 2.0 | 950 | $2,900 | $3.05 | 24d | 1 | 0.70mi |
| 1635 Creek St San Marcos, CA | 1.0–2.0 | 2.0 | 1047 | $3,450 | $3.29 | 14d | 3 | 0.74mi |
| 1029 Martina Ct San Marcos, CA | 2.0 | 2.0 | 1200 | $2,995 | $2.50 | 43d | 1 | 1.00mi |
| 1241 W San Marcos Blvd San Marcos, CA | 1.0–2.0 | 1.0 | 883 | $2,400 | $2.72 | 43d | 1 | 1.06mi |
| 420 Smilax Rd San Marcos, CA | 2.0 | 2.0 | 896 | $2,445 | $2.73 | 2d | 3 | 1.07mi |
| 1560 Circa Del Lago Unit D304 San Marcos, CA | 2.0 | 2.0 | 1030 | $4,500 | $4.37 | 24d | 1 | 1.12mi |
| 1560 Circa Del Lago Unit D302 San Marcos, CA | 2.0 | 2.0 | 1030 | $4,500 | $4.37 | 43d | 1 | 1.12mi |
| 320 Smilax Rd San Marcos, CA | 2.0 | 1.0 | 875 | $2,675 | $3.06 | 43d | 1 | 1.31mi |
| 320 Smilax Rd San Marcos, CA | 2.0 | 1.0 | 875 | $2,675 | $3.06 | 24d | 1 | 1.31mi |
| 300 Smilax Rd Unit 11 San Marcos, CA | 2.0 | 1.0 | 875 | $2,675 | $3.06 | 24d | 1 | 1.31mi |
| 266 Avenida de Suerte San Marcos, CA | 3.0 | 2.0 | 1132 | $3,495 | $3.09 | 21d | 1 | 1.32mi |
| 1257 Armorlite Dr San Marcos, CA | 2.0 | 1.0–2.5 | 1189 | $4,330 | $3.64 | 1d | 24 | 1.32mi |
| 920 Sycamore Ave Vista, CA | 2.0 | 2.0 | 950 | $2,675 | $2.82 | 3d | 1 | 1.35mi |
| 1052 Kendale Way Vista, CA | 3.0 | 2.5 | 1576 | $3,795 | $2.41 | 43d | 1 | 1.38mi |
| 221 Smilax Rd Vista, CA | 1.0–2.0 | 1.0–2.0 | 855 | $2,799 | $3.27 | 2d | 8 | 1.39mi |
| 2206 Saltbush Dr San Marcos, CA | 3.0 | 3.5 | 1781 | $4,000 | $2.25 | 11d | 1 | 1.39mi |
| 1045 Armorlite Dr San Marcos, CA | 2.0 | 1.0–3.0 | 902 | $3,398 | $3.77 | 1d | 16 | 1.50mi |
Listing history 33 events
-
2026-06-18days on market $339,500 Active 61 DOM
-
2026-06-17days on market $339,500 Active 60 DOM
-
2026-06-16days on market $339,500 Active 59 DOM
-
2026-06-15days on market $339,500 Active 58 DOM
-
2026-06-13days on market $339,500 Active 56 DOM
-
2026-06-09days on market $339,500 Active 52 DOM
-
2026-06-08days on market $339,500 Active 51 DOM
-
2026-06-07days on market $339,500 Active 50 DOM
-
2026-06-04days on market $339,500 Active 47 DOM
-
2026-06-03days on market $339,500 Active 46 DOM
-
2026-06-02days on market $339,500 Active 45 DOM
-
2026-06-01days on market $339,500 Active 44 DOM
-
2026-05-31days on market $339,500 Active 43 DOM
-
2026-04-18$339,500 Active 1005-char remark
Show marketing remark (1005 chars)
Beautiful home located in a 55+ resort style community offering many recent upgrades. This home features vinyl plank flooring throughout, remodeled kitchen includes a new pantry, updated bathrooms, new interior doors and hardware, and dual pane windows throughout (except in bathrooms). The kitchen includes a stove, oven, and a microwave. Outside the home, there are two storage sheds and a brand new roof. The community also features a clubhouse and swimming pool for the leisure of its residents. Conveniently located near shopping, public transportation, schools, and major freeways this home has the perfect location for everyday living. * The above information including square footage is based on data received from the seller and/or from public sources. This information is deemed reliable but has not been independently verified and cannot be guaranteed. Prospective buyers are advised to verify information to their own satisfaction prior to purchase. Pictures may not depict exact home details.
-
2026-02-08historical
-
2025-12-30price $345,000
-
2025-11-06price $335,000
-
2025-08-22$345,000 Active
-
2025-07-28historical
-
2025-07-19status Active
-
2025-07-03status Pending Sale
-
2025-03-26$345,000 Active
-
2024-12-12soldstatus $325,000 Closed Sale
-
2024-11-15status Pending Sale
-
2024-09-09$349,000 Active
-
2024-08-09historical
-
2024-07-03$349,000 Active
-
2019-07-10historical
-
2019-07-09historical
-
2019-07-02$176,900 Active
-
2019-07-02$176,900 Active
-
2002-07-22soldstatus $62,000
-
2002-02-26$63,500
ⓘ Source: listings_history table (triggers on properties + properties_extension) + one-shot
backfill from property_details.listing_events for pre-trigger history.
Climate risk First Street
- Flood 1/10 Low FEMA zone X (unshaded) · 0% chance over 30 yrs
- Wildfire 1/10 Low
- Heat 4/10 Moderate 7 d/yr ≥93°F today · 21 d/yr by 30 yrs out
- Wind 1/10 Low
- Air quality 4/10 Moderate 4 unhealthy d/yr today · 4 by 30 yrs out
Nearby sold comps map
Loading sold comps map…
Walkable amenities ~0.75 mi
Loading nearby amenities…
Taxation est. · year 1
- Rental income
- $40,705
- − Mortgage interest
- −$19,017
- − Property taxes
- −$5,092
- − Insurance
- −$1,698
- − Repairs & maintenance
- −$3,256
- − Management
- −$3,256
- − Depreciation
- −$9,876
- Taxable loss
- −$1,491
- Est. tax savings @ 24.0%
- +$358
- After-tax cash flow
- $4,361/yr
For passive investors: Depreciation is non-cash, so a rental often shows a tax loss while cash-flowing — sheltering income. Rental losses are passive: they offset passive income freely, and up to $25,000/yr can offset ordinary (W-2) income if you actively participate and your MAGI is under $100k (phasing out to $0 by $150k); unused losses carry forward. On sale, claimed depreciation is recaptured at up to 25%, and gains may owe capital-gains tax (a 1031 exchange can defer both). Figures are a year-1 estimate at your 24.0% rate — not tax advice; consult a CPA.
Schools (NCES district)
- District
- San Marcos Unified
- NCES district ID
- 0634880
- Math proficiency
- 52% ▲ 1.00%
- Reading proficiency
- 67% ▲ 2.00%
- Median HH income
- $64,752
- Composite
- 53.67/100
- National rank
- #3093
- State rank
- #249 of 1400 in CA
Livability — San Marcos
- Score
- 77/100
- State rank
- #80
- US rank
- #3074
Category grades
Schools grade is shown separately in the Schools card above.
Census & demographics
- Census place
- San Marcos, CA
- County
- San Diego County · 3,178,799 people
- City population
- 100,940
- Metro
- San Diego-Chula Vista-Carlsbad, CA
- Population (ZIP)
- 53,605
- Household income
- $120,268
- Rent vs Own
- Severe rent burden
- 1594.0
Population outlook (San Diego County) Hauer SSP2
- Today (2025)
- 3,678,185 people
- By 2030
- 3,856,546 · +4.8%
- By 2040
- 4,171,407 · +13.4%
- By 2050
- 4,421,607 · +20.2%
- By 2075
- 4,831,599 · +31.4%
- By 2100
- 4,832,502 · +31.4%
Race, ethnicity, and origin ACS 2023
- Neighborhood character
- Diverse neighborhood (Simpson 0.62)
- Race & ethnicity
- White 53% Hispanic / Latino 28% Two or more races 17% Asian 10% Black 1%
- Hispanic origin (detail)
- Mexican 23%
- Common ancestry
- Italian 3% Slovak 3% Romanian 2%
- Foreign-born
- 19% · Canada, China, Vietnam
- Languages at home
- 73% English-only · Spanish 18% Other Indo-European 3% Chinese 1%
Political lean MEDSL · San Diego
- 2024 margin
- D (+16.8) · D 56.9% · R 40.1% · Other 2.9%
- 2008→2024 swing
- +6.6pp toward D · 2008: 10.2pp · 2024: 16.8pp
- All cycles
- 2024: D+16.8 2020: D+22.8 2016: D+17.8 2012: D+5.1 2008: D+10.2
Not yet ingested
- Civics
- —
Market trends
- HPI YoY
- ▼ -351.55%
- Current HPI
- 358.3294
- Rent YoY
- ▲ 0.35%
- Metro
- San Diego-Chula Vista-Carlsbad, CA
- State GDP YoY
- ▲ 3.21%
- F500 in state
- 116
Industry mix (Fortune 500 HQ in CA)
| Industry | F500 HQs | Revenue |
|---|---|---|
| Technology | 27 | $1,492B |
|
||
| Financial Services | 3 | $174B |
|
||
| Retail | 3 | $44B |
|
||
| Insurance | 3 | $26B |
|
||
| Media / Entertainment | 2 | $115B |
|
||
| Pharmaceuticals / Biotech | 2 | $62B |
|
||
Price history
+434.6% since first listed20 events — show timeline
- 2026-04-18 Listed $339,500 SDMLS
- 2026-02-08 Listing Removed — CRMLS
- 2025-12-30 Price Changed $345,000 CRMLS
- 2025-11-06 Price Changed $335,000 CRMLS
- 2025-08-22 Listed $345,000 CRMLS
- 2025-07-28 Listing Removed — CRMLS
- 2025-07-19 Relisted — CRMLS
- 2025-07-03 Pending — CRMLS
- 2025-03-26 Listed $345,000 CRMLS
- 2024-12-12 Sold (MLS) $325,000 CRMLS
- 2024-11-15 Pending — CRMLS
- 2024-09-09 Listed $349,000 CRMLS
- 2024-08-09 Listing Removed — CRMLS
- 2024-07-03 Listed $349,000 CRMLS
- 2019-07-10 Listing Removed — SDMLS
- 2019-07-09 Listing Removed — CRMLS
- 2019-07-02 Listed $176,900 CRMLS
- 2019-07-02 Listed $176,900 SDMLS
- 2002-07-22 Sold (MLS) $62,000 CRMLS
- 2002-02-26 Listed $63,500 CRMLS
Property tax history
+2.5%/yrLatest (2013): $476 · +2.0% YoY. Source: county tax records.
Cash-flow waterfall
monthlySold comps — $/sqft
last 12 mo · ≤1 miLoading sold comps…