10153 Regal Bend Ln · Fort Worth, TX
Flood risk 1/10 · Minimal
- FEMA flood zone
- X (unshaded)
- Chance of flooding over 30 yrs
- 0.0%
- Est. flood insurance / yr
- $507 – $1,088
Fire risk 5/10 · Moderate
- Est. fire insurance / yr
- $1,222 – $2,270
Heat risk 7/10 · Major
- Hot days now (above 109°F)
- 7 days/yr
- Hot days in 30 yrs
- 22 days/yr
Wind risk 6/10 · Moderate
- Chance of severe wind over 30 yrs
- 27.0%
Air-quality risk 2/10 · Minimal
- Unhealthy air days now
- 1 days/yr
- Unhealthy air days in 30 yrs
- 2 days/yr
Risk factors via First Street. Map © Google.
Why this score? — see what drove the D- grade
The composite is a weighted blend of 9 inputs, each scored 0–100. Each bar is that input's sub-score; the figure is the points it added to the 100-point composite (weight × sub-score).
- Cash flow +11.5/30.0
- ARV discount +7.5/15.0
- Livability +4.0/5.0
- Schools +3.5/10.0
- DSCR +3.4/10.0
- Rent growth +2.9/5.0
- Condition / age +2.5/5.0
- 1% rule +2.3/10.0
- Appreciation +0.0/10.0
$331,999
🖨 Deal sheet (PDF) 📄 Offer letter ✓ Due diligence
Listing remarks
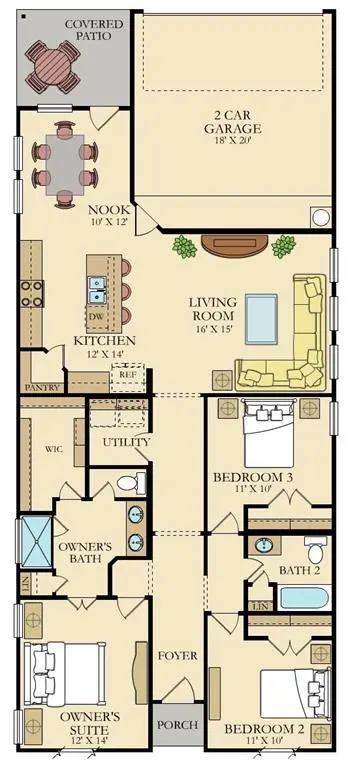
LENNAR - Lonestar Collection at Northpointe - McAllen Floorplan - This two-story home is perfect for families with three bedrooms and an open concept living area. Two bedrooms are situated at the front of the home, including the owner’s suite, which has a full bathroom and walk-in closet. Down the hall is the kitchen, which flows seamlessly into the living room and breakfast nook and connects to a covered patio. Upstairs is an additional bedroom, as well as a game room.
Key facts
- Walk-in closet
- Covered patio
- Game room
Tags
Property features AI
Finance
- Other: Deed restrictions; Builder special listing condition
- Financial info: Accepts Cash, Conventional, FHA, and VA financing; No second mortgage
- HOA & community: Mandatory HOA; Annual association fee ($625); HOA covers full use of facilities, grounds maintenance, and management fees
Exterior
- Parking: Attached 2-car garage (garage faces front, single 2-car door); 2 covered parking spaces
- Security: Smoke detectors; Carbon monoxide detectors; Wireless security features
- Utilities: City water; City sewer; Standard electrical service; Not in a municipal utility district
- Home design: Single family residence; Two levels; New construction (incomplete, 2025); Not attached; Subdivision: Northpointe
- Construction: Brick and fiber cement exterior; Composition roof; Slab foundation; Year built 2025 (new construction - incomplete)
- Exterior features: Landscaped yard; Large backyard with grass; Sprinkler system; Wood fencing; Curbs and sidewalks; Concrete
Interior
- Kitchen: Dishwasher; Disposal; Gas oven; Gas range; Microwave; Water line to refrigerator; Breakfast bar / eat-in kitchen; Natural stone / granite counters; Walk-in pantry; Kitchen island; Built-in cabinets
- Bedrooms: 3 bedrooms total; Primary bedroom on main level; Secondary bedroom on main level; One bedroom on second level
- Flooring: Carpet; Luxury vinyl plank
- Bathrooms: 3 full bathrooms
- Heating & cooling: Central heating (natural gas); Central air conditioning; Thermostat (energy-efficient feature)
- Interior features: Open floorplan; Kitchen island; Pantry; Built-in features; Decorative lighting; High speed internet available; Cable TV available; Smart home system; Other
- Laundry & utility: Tankless water heater
Neighborhood map
What this means for you Summary
Snapshot
- This is a 3-bed/3.0-bath other listed at $332k.
Deal economics
- At list price, monthly cash flow is $-109 ($-1k/yr) — negative.
- To cash-flow at today's rent, offer at most $313k (5.8% below list).
- To meet the 1% rule (rent ≥ 1% of price), the offer needs to be $243k (26.8% below list).
- Recommended offer: $243k (26.8% below list) — sets the bar for 1% rule.
- Cap rate 5.9% vs local median 3.9% in Fort Worth — top-decile yield for the area; either an underpriced asset or a hidden risk that comps aren't pricing in. Stress-test before assuming the spread holds.
Location & tenants
- Location reads 80/100 on livability (#49 in TX, #1,954 nationally) — a professional / high-income tenant draw. Strengths: amenities A+, cost of living A+, housing A+; Watch: schools D+, crime F.
- Eagle Mt-Saginaw ISD (urban): math 35% / reading 42% proficiency, ranked #361 of 826 in TX (top 44%) — families likely to look elsewhere, expect single-tenant / working-renter base with shorter leases.
- Market conditions: Rents rising (+1.5%/yr); 1050 active listings in the ZIP; 32 comparable units currently listed for rent nearby; rentals at typical pace (median 26d on market — plan ~3-4 weeks tenant-placement turnaround); solid renter incomes; 18,938 units permitted in Tarrant County in 2024 (8,336 in 5+ unit buildings).
Forward outlook
- Local home prices are declining (-3.0%/yr); year-one equity from $2k of loan paydown is wiped out by about $10k of value loss. Plan a longer hold.
- Tarrant County population projected at +41% by 2050 — long-run rental-demand tailwind backs the buy-and-hold thesis.
Negotiation context
- It's been on market 45 days — a 3% lower offer ($322k) is reasonable based on typical stale-listing flexibility.
Risks & watch-outs
- Climate carrying-cost: major wind risk, 27% chance of damaging wind over 30y; moderate wildfire risk; extreme-heat days projected 7→22/yr by 2055 (HVAC capex compounding) — expect insurance premiums to compound above CPI over the hold.
Questions for the listing agent
- What do current leases actually rent for vs. the listed asking? Can we see a recent rent roll and the last 12 months of T-12 income?
- It's been on market 45 days. Have you received any prior offers? Is the seller open to a 27% concession, seller financing, or rate buy-down credit?
- What does the HOA fee cover, when was the last increase, and are there any pending special assessments or reserve-fund shortfalls?
- Is there a deadline driving the sale (1031 exchange, divorce, estate, relocation)? That informs how much negotiation room exists.
- Schools are D-rated, which usually means shorter tenancies and higher turnover. Who's the typical renter profile here, and what's been the actual vacancy rate?
- Crime grade is F in this area — have there been break-ins, vandalism, or insurance claims at this property in the last 3 years? What carrier currently insures it and at what premium?
- The area grade is low — what's the realistic commute time and amenity access for the typical tenant pool here? Any planned neighborhood developments (good or bad) we should know about?
- What's the average days-on-market for RENTAL listings here right now (not sales)? A rising rental-DOM trend means longer vacancies and softer asking-rent achievability than the comps imply.
- What's the recent tenant-quality profile in this submarket — average credit score on applications, eviction rate, late-payment / NSF rate, and stable-employment percentage? A property-management company in the area should have these aggregated.
- How much new for-sale + rental construction is in the pipeline within 1–3 miles? Heavy new supply typically softens prices + rents 12–24 months out; constrained supply supports both.
Investment metrics
- 1% rule
- 0.73% ✗
- Cap rate
- 5.90%
- Cash-on-cash
- -1.41%
- DSCR
- 0.94
- GRM
- 11.4
CMA / ARV
No comps found within radius.
Projected returns pro-forma
-3.0% appreciation · 1.51% rent growth · sell at horizon
- IRR
- -20.2%
- Equity multiple
- 0.31×
- Total profit
- $-64,469
- Equity at exit
- $49,502
- IRR
- -16.4%
- Equity multiple
- 0.14×
- Total profit
- $-79,901
- Equity at exit
- $28,705
Cash invested: $92,960 (down + closing). Projections, not guarantees.
Landlord ↔ Tenant lean methodology
- Overall (STATE)
- 87 Strongly Landlord-Friendly
- State Texas
- 87 Strongly Landlord-Friendly · R+5
- County
- — inherits STATE
- City
- — inherits STATE
ZIP-level market 76179
- Rents YoY
- 1.5%
- Active inventory
- 1050
- Price-to-rent
- 11.4×
Monthly cashflow live
- Estimated rent
- $2,430 high interval (Pro) →
- Mortgage (P&I)
- −$1,741
- Tax from tax record
- −$97 /mo · $1,166/yr
- Insurance
- −$138
- HOA
- −$52
- Vacancy / Maint / Mgmt
- −$510
- Net cashflow
- $-109
Break-even live
Sensitivity live
| Price | -10% $79 | -5% $-15 | +0% $-109 | +5% $-203 | +10% $-297 |
|---|---|---|---|---|---|
| Rent | -10% $-301 | -5% $-205 | +0% $-109 | +5% $-13 | +10% $83 |
| Rate | -1.0pp $58 | -0.5pp $-25 | base $-109 | +0.5pp $-195 | +1.0pp $-283 |
UW: 25.0% down · 7.5% · 30yr · 1.5% tax · 5.0% vac · 8.0% maint · 8.0% mgmt
Financing live
Cash to close
- Down payment
- $83,000
- Closing costs
- $9,960
- Reserves months
- —
- Total cash needed
- —
Loan-product check · same deal, 3 products live
Conventional
25% down · 7.5% · 30yr
- Down + closing
- —
- Monthly P&I
- —
- Monthly cashflow
- —
- DSCR
- —
- Eligible?
- —
Personal DTI + credit; lowest rate.
DSCR
20% down · 8.5% · 30yr
- Down + closing
- —
- Monthly P&I
- —
- Monthly cashflow
- —
- DSCR
- —
- Eligible?
- —
No personal income docs; deal must DSCR.
Hard money
10% down · 12.0% · 12mo
- Down + closing
- —
- Monthly P&I
- —
- Monthly cashflow
- —
- DSCR
- —
- Eligible?
- —
Short-term bridge; refi at stabilization.
Rent comps 32 comps
| Address | Beds | Baths | Sqft | Rent | $/sqft | DOM | Units | Dist |
|---|---|---|---|---|---|---|---|---|
| 10212 Regal Bend Ln Saginaw, TX | 4.0 | 2.0 | 1867 | $2,395 | $1.28 | 18d | 1 | 0.09mi |
| 2800 Slatewood Dr Fort Worth, TX | 3.0 | 2.0 | 1450 | $2,045 | $1.41 | 2d | 1 | 0.20mi |
| 2916 Tibbles Dr Fort Worth, TX | 3.0 | 2.0 | 1440 | $1,899 | $1.32 | 25d | 1 | 0.29mi |
| 2629 Turtle Dove Dr Fort Worth, TX | 3.0 | 2.0 | 1534 | $2,075 | $1.35 | 7d | 1 | 0.36mi |
| 10021 Elkhorn Dr Fort Worth, TX | 4.0 | 3.0 | 2238 | $2,595 | $1.16 | 3d | 1 | 0.39mi |
| 9709 Trusler Rd Fort Worth, TX | 3.0 | 2.0 | 1440 | $2,250 | $1.56 | 25d | 1 | 0.44mi |
| 9925 Little Tree Ln Fort Worth, TX | 3.0 | 2.5 | 2081 | $2,600 | $1.25 | 25d | 1 | 0.48mi |
| 2521 Birchcrest Dr Fort Worth, TX | 4.0 | 3.0 | 2371 | $2,795 | $1.18 | 25d | 1 | 0.53mi |
| 2633 Oneida Ln Fort Worth, TX | 4.0 | 3.0 | 2059 | $2,850 | $1.38 | 25d | 1 | 0.63mi |
| 2521 Bunkerton Dr Fort Worth, TX | 4.0 | 2.0 | 1674 | $2,450 | $1.46 | 25d | 1 | 0.65mi |
| 2500 Bunkerton Dr Fort Worth, TX | 4.0 | 2.0 | 1674 | $1,909 | $1.14 | 25d | 1 | 0.65mi |
| 2644 Oneida Ln Fort Worth, TX | 4.0 | 3.0 | 2260 | $2,800 | $1.24 | 17d | 1 | 0.67mi |
| 10617 Kono Trl Fort Worth, TX | 4.0 | 2.0 | 1800 | $2,500 | $1.39 | 25d | 1 | 0.68mi |
| 10616 Kono Trl Fort Worth, TX | 4.0 | 3.0 | 2444 | $2,700 | $1.10 | 13d | 1 | 0.70mi |
| 2513 Ponca Dr Fort Worth, TX | 4.0 | 3.0 | 2070 | $2,495 | $1.21 | 3d | 1 | 0.75mi |
| 2520 Shakopee St Fort Worth, TX | 4.0 | 2.0 | 1731 | $2,695 | $1.56 | 8d | 1 | 0.80mi |
| 10609 Potawatomi Ln Fort Worth, TX | 4.0 | 3.0 | 2260 | $3,200 | $1.42 | 25d | 1 | 0.80mi |
| 2636 Keokuk St Fort Worth, TX | 4.0 | 2.0 | 1810 | $2,500 | $1.38 | 25d | 1 | 0.85mi |
| 3053 Titan Springs Dr Fort Worth, TX | 4.0 | 2.0 | 1667 | $2,320 | $1.39 | 25d | 1 | 0.87mi |
| 3012 Tooley Dr Fort Worth, TX | 4.0 | 2.0 | 1719 | $2,200 | $1.28 | 25d | 1 | 0.96mi |
| 9108 Lookout Pt Fort Worth, TX | 3.0 | 2.0 | 1711 | $2,100 | $1.23 | 8d | 1 | 1.19mi |
| 9021 Eagles Landing Dr Fort Worth, TX | 4.0 | 2.0 | 1850 | $2,295 | $1.24 | 21d | 1 | 1.30mi |
| 10916 Hopewell Cv Fort Worth, TX | 3.0 | 2.0 | 1495 | $2,100 | $1.40 | 25d | 1 | 1.30mi |
| 8928 Puerto Vista Dr Fort Worth, TX | 3.0 | 2.0 | 1631 | $2,050 | $1.26 | 25d | 1 | 1.30mi |
| 8925 Old Rawhide Ln Fort Worth, TX | 4.0 | 2.0 | 1809 | $2,295 | $1.27 | 13d | 1 | 1.31mi |
| 8916 Old Rawhide Ln Fort Worth, TX | 4.0 | 2.0 | 1776 | $2,250 | $1.27 | 25d | 1 | 1.32mi |
| 11012 Dillon St Fort Worth, TX | 3.0 | 2.5 | 1735 | $2,200 | $1.27 | 13d | 1 | 1.37mi |
| 6212 Flour Mill Run Fort Worth, TX | 4.0 | 2.0 | 1820 | $2,500 | $1.37 | 25d | 1 | 1.38mi |
| 8901 Timber Gulch Dr Fort Worth, TX | 3.0 | 2.0 | 1442 | $2,195 | $1.52 | 13d | 1 | 1.39mi |
| 5864 Mount Plymouth Pt Fort Worth, TX | 3.0 | 2.0 | 1635 | $2,100 | $1.28 | 25d | 1 | 1.39mi |
| 5404 Thornbush Dr Fort Worth, TX | 4.0 | 2.5 | 2923 | $2,900 | $0.99 | 25d | 1 | 1.43mi |
| 3025 Tooley Dr Fort Worth, TX | 4.0 | 2.0 | 1667 | $2,320 | $1.39 | 25d | 1 | 1.47mi |
HOA detail
- Monthly dues
- $52 · $624/yr
Listing history 3 events
-
2026-05-19status Pending
-
2026-05-12price $331,999
-
2026-04-04$333,999 Active
ⓘ Source: listings_history table (triggers on properties + properties_extension) + one-shot
backfill from property_details.listing_events for pre-trigger history.
Tax reassessment forecast TX · Resets to sale price
- Current annual tax
- $1,166 · $97/mo
- Projected year-2 tax
- $6,076 · $506/mo
- Expected delta
- +$4,910/yr (+$409/mo · 421.2%)
ⓘ Screening estimate from a state-policy table — verify with the county assessor before closing.
Climate risk First Street
- Flood 1/10 Low FEMA zone X (unshaded) · 0% chance over 30 yrs
- Wildfire 5/10 Major
- Heat 7/10 Severe 7 d/yr ≥109°F today · 22 d/yr by 30 yrs out
- Wind 6/10 Major 27% chance of damaging wind over 30 yrs
- Air quality 2/10 Low 1 unhealthy d/yr today · 2 by 30 yrs out
Nearby sold comps map
Loading sold comps map…
Walkable amenities ~0.75 mi
Loading nearby amenities…
Taxation est. · year 1
- Rental income
- $29,154
- − Mortgage interest
- −$18,597
- − Property taxes
- −$1,166
- − Insurance
- −$1,660
- − Repairs & maintenance
- −$2,332
- − Management
- −$2,332
- − HOA
- −$624
- − Depreciation
- −$9,658
- Taxable loss
- −$7,215
- Est. tax savings @ 24.0%
- +$1,732
- After-tax cash flow
- $421/yr
For passive investors: Depreciation is non-cash, so a rental often shows a tax loss while cash-flowing — sheltering income. Rental losses are passive: they offset passive income freely, and up to $25,000/yr can offset ordinary (W-2) income if you actively participate and your MAGI is under $100k (phasing out to $0 by $150k); unused losses carry forward. On sale, claimed depreciation is recaptured at up to 25%, and gains may owe capital-gains tax (a 1031 exchange can defer both). Figures are a year-1 estimate at your 24.0% rate — not tax advice; consult a CPA.
Schools (NCES district)
- District
- Eagle Mt-Saginaw ISD
- NCES district ID
- 4817700
- Math proficiency
- 35% ▼ -16.00%
- Reading proficiency
- 42% ▼ -9.00%
- Median HH income
- $72,781
- Composite
- 35.41/100
- National rank
- #4945
- State rank
- #361 of 826 in TX
Livability — Fort Worth
- Score
- 80/100
- State rank
- #49
- US rank
- #1954
Category grades
Schools grade is shown separately in the Schools card above.
Census & demographics
- Census place
- Fort Worth, TX
- County
- Tarrant County · 2,033,669 people
- City population
- 911,619
- Metro
- Dallas-Fort Worth-Arlington, TX
- Population (ZIP)
- 80,090
- Household income
- $107,428
- Rent vs Own
- Severe rent burden
- 1494.0
Population outlook (Tarrant County) Hauer SSP2
- Today (2025)
- 2,380,417 people
- By 2030
- 2,578,900 · +8.3%
- By 2040
- 2,974,995 · +25.0%
- By 2050
- 3,350,489 · +40.8%
- By 2075
- 4,216,909 · +77.2%
- By 2100
- 4,741,527 · +99.2%
Race, ethnicity, and origin ACS 2023
- Neighborhood character
- Diverse neighborhood (Simpson 0.63)
- Race & ethnicity
- White 53% Hispanic / Latino 28% Two or more races 14% Black 12% Asian 4%
- Hispanic origin (detail)
- Mexican 22% Puerto Rican 2%
- Common ancestry
- Slovak 2% Lithuanian 2% Italian 1%
- Foreign-born
- 8% · Canada, Jamaica
- Languages at home
- 81% English-only · Spanish 15% Other Asian/Pacific 2% Other Indo-European 1%
Political lean MEDSL · Tarrant
- 2024 margin
- Lean R (+5.1) · D 46.7% · R 51.9% · Other 1.4%
- 2008→2024 swing
- +6.6pp toward D · 2008: -11.7pp · 2024: -5.1pp
- All cycles
- 2024: R+5.1 2020: D+0.2 2016: R+8.7 2012: R+15.7 2008: R+11.7
Not yet ingested
- Civics
- —
Market trends
- HPI YoY
- ▼ -137.12%
- Current HPI
- 237.6676
- Rent YoY
- ▲ 1.51%
- Metro
- Dallas-Fort Worth-Arlington, TX
- State GDP YoY
- ▲ 3.95%
- F500 in state
- 110
Industry mix (Fortune 500 HQ in TX)
| Industry | F500 HQs | Revenue |
|---|---|---|
| Energy | 16 | $1,198B |
|
||
| Technology | 5 | $198B |
|
||
| Engineering / Construction | 4 | $72B |
|
||
| Energy Services | 3 | $60B |
|
||
| Utilities | 3 | $41B |
|
||
| Healthcare | 2 | $330B |
|
||
Price history
-0.6% since first listed3 events — show timeline
- 2026-05-19 Pending — NTREIS
- 2026-05-12 Price Changed $331,999 NTREIS
- 2026-04-04 Listed $333,999 NTREIS
Cash-flow waterfall
monthlySold comps — $/sqft
last 12 mo · ≤1 miLoading sold comps…