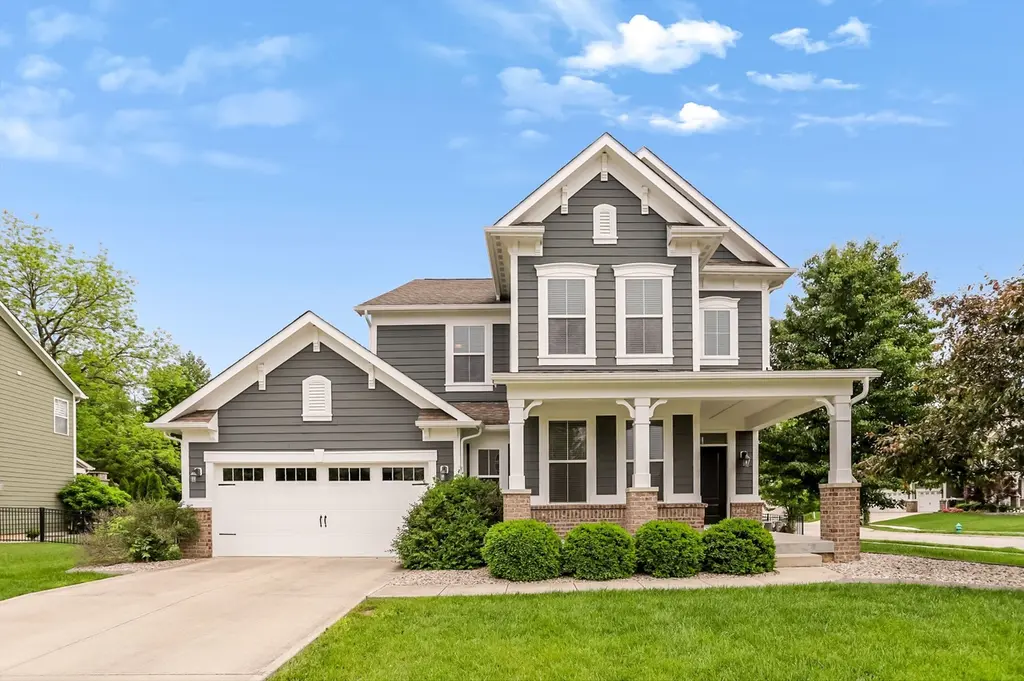
10511 Cleary Trace Dr · Fishers, IN
Flood risk 1/10 · Minimal
- FEMA flood zone
- X (unshaded)
- Chance of flooding over 30 yrs
- 0.0%
- Est. flood insurance / yr
- $473 – $860
Fire risk 1/10 · Minimal
- Est. fire insurance / yr
- $717 – $1,331
Heat risk 3/10 · Minor
- Hot days now (above 101°F)
- 7 days/yr
- Hot days in 30 yrs
- 18 days/yr
Wind risk 2/10 · Minimal
- Chance of severe wind over 30 yrs
- 0.0%
Air-quality risk 2/10 · Minimal
- Unhealthy air days now
- 1 days/yr
- Unhealthy air days in 30 yrs
- 2 days/yr
Risk factors via First Street. Map © Google.
Why this score? — see what drove the F grade
The composite is a weighted blend of 9 inputs, each scored 0–100. Each bar is that input's sub-score; the figure is the points it added to the 100-point composite (weight × sub-score).
- ARV discount +6.0/15.0
- Schools +5.3/10.0
- Livability +4.2/5.0
- Rent growth +2.5/5.0
- Condition / age +2.5/5.0
- Cash flow +1.7/30.0
- 1% rule +0.0/10.0
- DSCR +0.0/10.0
- Appreciation +0.0/10.0
$565,000
🖨 Deal sheet (PDF) 📄 Offer letter ✓ Due diligence
Listing remarks
Some homes simply feel like home from the moment you walk in! Thoughtfully designed with warmth, natural light, & everyday functionality in mind, this beautifully updated two-story in Prescott offers fresh paint, brand-new carpet, & a layout that truly works for the way people live. Stylish, comfortable, and incredibly functional - this home isn't just move-in ready, it's life ready. Custom trimwork in the foyer creates a warm first impression, while the versatile flex room offers endless possibilities - formal dining, home office, playroom, or additional living space designed to adapt to your lifestyle. At the heart of the home, the beautifully appointed kitchen was built for rea
Key facts
- Custom trimwork
- Versatile flex room
- Large granite island
Tags
Property features AI
Finance
- Other: Lot size approximately 0.26 acres
- HOA & community: HOA with annual fee (covers entrance common area, insurance, maintenance, park/playground, snow removal)
Exterior
- Parking: Attached concrete garage with opener; Keyless entry; Two garage spaces
- Security: Security system; Smoke alarm
- Utilities: Public water; Municipal sewer connected; Natural gas connected; Cable available
- Home design: Single-family residence; Two levels; Mandatory fee ownership
- Construction: Brick and wood siding exterior; Concrete perimeter foundation
- Exterior features: Covered patio; Patio; Full yard fencing
Interior
- Kitchen: Electric cooktop; Double oven; Microwave; Dishwasher; Garbage disposal; Refrigerator
- Bedrooms: Four upper-level bedrooms; Primary bedroom with walk-in closet
- Bathrooms: Two full bathrooms; One half bathroom; Primary bath with full shower stall and double sinks
- Heating & cooling: Forced air heating (natural gas); Central air conditioning
- Interior features: Attic access; Breakfast bar; High ceilings; Kitchen island; Painted woodwork; Unfinished basement; Gas-starter fireplace in the great room
- Laundry & utility: Upper-level laundry (washer and dryer included); Electric water heater; Owned water softener; Sump pump
Neighborhood map
What this means for you Summary
Snapshot
- This is a 3-bed/2.5-bath single-family listed at $565k.
Deal economics
- At list price, monthly cash flow is $-2k ($-26k/yr) — negative.
- To cash-flow at today's rent, offer at most $184k (67.4% below list).
- To meet the 1% rule (rent ≥ 1% of price), the offer needs to be $194k (65.6% below list).
- Recommended offer: $184k (67.4% below list) — sets the bar for cash-flow.
- Cap rate 1.7% vs local median 3.6% in Fishers — below-typical yield; the buyer is paying a premium for something (appreciation thesis, condition, location) that the cap rate doesn't capture.
Location & tenants
- Location reads 83/100 on livability (#11 in IN, #898 nationally) — a professional / high-income tenant draw. Strengths: crime A+, amenities A+, employment A+; Watch: commute F.
- Hamilton Southeastern Schools (suburban): math 57% / reading 59% proficiency, ranked #14 of 301 in IN (top 5%) — acceptable for families but not a draw, mixed tenant base, ~2y average lease; only 10% free/reduced lunch — higher-income household profile.
- Zoned schools: Thorpe Creek Elementary (math 69% / reading 59%, grade B, #91 of 994 statewide, top 9%, 628 students, 10% FRL); Hamilton Se Int And Jr High Sch (math 50% / reading 60%, grade B-, #26 of 330 statewide, top 8%, 1,269 students, 13% FRL); Hamilton Southeastern Hs (math 66% / reading 85%, grade A-, #7 of 369 statewide, top 2%, 3,450 students, 15% FRL) — zoned schools at 13% FRL track the district average.
- Market conditions: 307 active listings in the ZIP; 4,661 units permitted in Hamilton County in 2024 (1,528 in 5+ unit buildings).
Forward outlook
- Local home prices are declining (-3.0%/yr); year-one equity from $4k of loan paydown is wiped out by about $17k of value loss. Plan a longer hold.
- Hamilton County population projected at +44% by 2050 — long-run rental-demand tailwind backs the buy-and-hold thesis.
Negotiation context
- Only 3 days on market — expect competitive offers; lowballing is unlikely to land.
Questions for the listing agent
- What do current leases actually rent for vs. the listed asking? Can we see a recent rent roll and the last 12 months of T-12 income?
- What does the HOA fee cover, when was the last increase, and are there any pending special assessments or reserve-fund shortfalls?
- Is there a deadline driving the sale (1031 exchange, divorce, estate, relocation)? That informs how much negotiation room exists.
- Schools are A-rated — typically a magnet for longer-tenancy family renters. What's the average tenant stay here, and is there a school-zone premium baked into asking?
- The area grade is low — what's the realistic commute time and amenity access for the typical tenant pool here? Any planned neighborhood developments (good or bad) we should know about?
- What's the average days-on-market for RENTAL listings here right now (not sales)? A rising rental-DOM trend means longer vacancies and softer asking-rent achievability than the comps imply.
- What's the recent tenant-quality profile in this submarket — average credit score on applications, eviction rate, late-payment / NSF rate, and stable-employment percentage? A property-management company in the area should have these aggregated.
- How much new for-sale + rental construction is in the pipeline within 1–3 miles? Heavy new supply typically softens prices + rents 12–24 months out; constrained supply supports both.
Investment metrics
- 1% rule
- 0.34% ✗
- Cap rate
- 1.72%
- Cash-on-cash
- -16.35%
- DSCR
- 0.27
- GRM
- 24.2
CMA / ARV
- ARV (on-the-fly)
- $546,530
- Comps found
- 12
Show comp detail 12 sales within ~0.75 mi
| Address | Dist | Beds/Ba | Sqft | Sold | Price | $/sf | Match |
|---|---|---|---|---|---|---|---|
| 10510 Fox Hunt Rd | 0.29mi | 3/3.5 | 2,753 (+3%) | 9mo | $535,000 | $194 | 70 |
| 15097 Thoroughbred Dr | 0.29mi | 3/2.0 | 2,802 (+5%) | 9mo | $498,000 | $178 | 69 |
| 14940 Tiago Ln | 0.46mi | 3/3.0 | 2,802 (+5%) | 4mo | $585,000 | $209 | 64 |
| 15825 Oakhurst Ln | 0.56mi | 3/2.0 | 2,634 (-1%) | 22mo | $479,000 | $182 | 52 |
| 10238 Cloverbank Dr | 0.57mi | 3/3.0 | 2,707 (+2%) | 22mo | $555,000 | $205 | 51 |
| 9986 Gallop Ln | 0.63mi | 4/2.5 (+1) | 2,955 (+11%) | 1mo | $495,000 | $168 | 47 |
| 9916 Gallop Ln | 0.71mi | 4/2.5 (+1) | 2,800 (+5%) | 10mo | $435,000 | $155 | 46 |
| 14904 Tiago Ln | 0.48mi | 3/3.0 | 2,322 (-13%) | 13mo | $510,000 | $220 | 43 |
| 14831 Tiago Ln | 0.56mi | 3/3.0 | 2,494 (-6%) | 22mo | $590,000 | $237 | 43 |
| 14817 Anees Ln | 0.64mi | 3/3.0 | 2,786 (+4%) | 23mo | $585,000 | $210 | 42 |
| 10297 Sinndar Ln | 0.39mi | 3/2.5 | 2,326 (-13%) | 23mo | $525,000 | $226 | 42 |
| 10112 Gallop Ln | 0.50mi | 4/2.5 (+1) | 3,035 (+14%) | 9mo | $439,900 | $145 | 41 |
Match score weights: distance 35% · size 25% · config 20% · recency 20%. Top-matched comps best support the ARV.
Projected returns pro-forma
-3.0% appreciation · 3.0% rent growth · sell at horizon
- IRR
- -48.4%
- Equity multiple
- -0.45×
- Total profit
- $-228,928
- Equity at exit
- $84,243
- IRR
- -94.1%
- Equity multiple
- -1.38×
- Total profit
- $-376,521
- Equity at exit
- $48,851
Cash invested: $158,200 (down + closing). Projections, not guarantees.
Landlord ↔ Tenant lean methodology
- Overall (STATE)
- 90 Strongly Landlord-Friendly
- State Indiana
- 90 Strongly Landlord-Friendly · R+11
- County
- — inherits STATE
- City
- — inherits STATE
ZIP-level market 46040
- Home prices YoY
- -24.4%
- Active inventory
- 307
- Price-to-rent
- 24.2×
Monthly cashflow live
- Estimated rent
- $1,943 medium interval (Pro) →
- Mortgage (P&I)
- −$2,963
- Tax from tax record
- −$440 /mo · $5,276/yr
- Insurance
- −$235
- HOA
- −$52
- Vacancy / Maint / Mgmt
- −$408
- Net cashflow
- $-2,155
Break-even live
Sensitivity live
| Price | -10% $-1,835 | -5% $-1,995 | +0% $-2,155 | +5% $-2,315 | +10% $-2,475 |
|---|---|---|---|---|---|
| Rent | -10% $-2,309 | -5% $-2,232 | +0% $-2,155 | +5% $-2,079 | +10% $-2,002 |
| Rate | -1.0pp $-1,871 | -0.5pp $-2,012 | base $-2,155 | +0.5pp $-2,302 | +1.0pp $-2,451 |
UW: 25.0% down · 7.5% · 30yr · 1.5% tax · 5.0% vac · 8.0% maint · 8.0% mgmt
Financing live
Cash to close
- Down payment
- $141,250
- Closing costs
- $16,950
- Reserves months
- —
- Total cash needed
- —
Loan-product check · same deal, 3 products live
Conventional
25% down · 7.5% · 30yr
- Down + closing
- —
- Monthly P&I
- —
- Monthly cashflow
- —
- DSCR
- —
- Eligible?
- —
Personal DTI + credit; lowest rate.
DSCR
20% down · 8.5% · 30yr
- Down + closing
- —
- Monthly P&I
- —
- Monthly cashflow
- —
- DSCR
- —
- Eligible?
- —
No personal income docs; deal must DSCR.
Hard money
10% down · 12.0% · 12mo
- Down + closing
- —
- Monthly P&I
- —
- Monthly cashflow
- —
- DSCR
- —
- Eligible?
- —
Short-term bridge; refi at stabilization.
HOA detail
- Monthly dues
- $52 · $624/yr
Listing history 2 events
-
2026-05-31status $565,000 Pending 3 DOM
-
2026-05-26$565,000 Active
ⓘ Source: listings_history table (triggers on properties + properties_extension) + one-shot
backfill from property_details.listing_events for pre-trigger history.
Tax reassessment forecast IN · Partial reset (capped growth)
- Current annual tax
- $5,276 · $440/mo
- Projected year-2 tax
- $5,276 · $440/mo
- Expected delta
- $0/yr ($0/mo · 0.0%)
ⓘ Screening estimate from a state-policy table — verify with the county assessor before closing.
Climate risk First Street
- Flood 1/10 Low FEMA zone X (unshaded) · 0% chance over 30 yrs
- Wildfire 1/10 Low
- Heat 3/10 Moderate 7 d/yr ≥101°F today · 18 d/yr by 30 yrs out
- Wind 2/10 Low 0% chance of damaging wind over 30 yrs
- Air quality 2/10 Low 1 unhealthy d/yr today · 2 by 30 yrs out
Nearby sold comps map
Loading sold comps map…
Walkable amenities ~0.75 mi
Loading nearby amenities…
Taxation est. · year 1
- Rental income
- $23,312
- − Mortgage interest
- −$31,649
- − Property taxes
- −$5,276
- − Insurance
- −$2,825
- − Repairs & maintenance
- −$1,865
- − Management
- −$1,865
- − HOA
- −$624
- − Depreciation
- −$16,436
- Taxable loss
- −$37,228
- Est. tax savings @ 24.0%
- +$8,935
- After-tax cash flow
- $-16,929/yr
For passive investors: Depreciation is non-cash, so a rental often shows a tax loss while cash-flowing — sheltering income. Rental losses are passive: they offset passive income freely, and up to $25,000/yr can offset ordinary (W-2) income if you actively participate and your MAGI is under $100k (phasing out to $0 by $150k); unused losses carry forward. On sale, claimed depreciation is recaptured at up to 25%, and gains may owe capital-gains tax (a 1031 exchange can defer both). Figures are a year-1 estimate at your 24.0% rate — not tax advice; consult a CPA.
Schools (NCES district)
- District
- Hamilton Southeastern Schools
- NCES district ID
- 1810650
- Math proficiency
- 57% ▼ -11.00%
- Reading proficiency
- 59% ▼ -7.00%
- Median HH income
- $87,726
- Composite
- 53.02/100
- National rank
- #1520
- State rank
- #14 of 301 in IN
Livability — Fishers
- Score
- 83/100
- State rank
- #11
- US rank
- #898
Category grades
Schools grade is shown separately in the Schools card above.
Census & demographics
- Census place
- Fishers, IN
- City population
- 92,467
- Population (ZIP)
- 17,891
Population outlook (Hamilton County) Hauer SSP2
- Today (2025)
- 381,938 people
- By 2030
- 417,496 · +9.3%
- By 2040
- 486,684 · +27.4%
- By 2050
- 549,805 · +44.0%
- By 2075
- 687,078 · +79.9%
- By 2100
- 754,495 · +97.5%
Race, ethnicity, and origin ACS 2023
- Neighborhood character
- Predominantly White (83%)
- Race & ethnicity
- White 83% Black 6% Two or more races 4% Asian 4% Hispanic / Latino 2%
- Common ancestry
- Lithuanian 5% Romanian 2% Portuguese 2%
- Foreign-born
- 5% · Canada
- Languages at home
- 94% English-only · Other Indo-European 3% Arabic 1% Spanish 1%
Political lean MEDSL · Hamilton
- 2024 margin
- Lean R (+6.1) · D 46.0% · R 52.1% · Other 1.9%
- 2008→2024 swing
- +16.2pp toward D · 2008: -22.2pp · 2024: -6.1pp
- All cycles
- 2024: R+6.1 2020: R+6.8 2016: R+19.6 2012: R+34.3 2008: R+22.2
Not yet ingested
- Civics
- —
Market trends
- HPI YoY
- ▼ -71.54%
- Current HPI
- 221.8703
- Rent YoY
- —
- Metro
- —
- State GDP YoY
- ▲ 2.90%
- F500 in state
- 18
Industry mix (Fortune 500 HQ in IN)
| Industry | F500 HQs | Revenue |
|---|---|---|
| Industrial Machinery | 2 | $37B |
|
||
| Healthcare | 1 | $177B |
|
||
| Pharmaceuticals | 1 | $45B |
|
||
| Metals / Steel | 1 | $18B |
|
||
| Agriculture | 1 | $17B |
|
||
| Packaging | 1 | $12B |
|
||
Price history
1 event — show timeline
- 2026-05-26 Listed $565,000 MIBOR as Distributed by MLS Grid
Property tax history
+66.1%/yrLatest (2025): $5,276 · +3.0% YoY. Source: county tax records.
Cash-flow waterfall
monthlySold comps — $/sqft
last 12 mo · ≤1 miLoading sold comps…