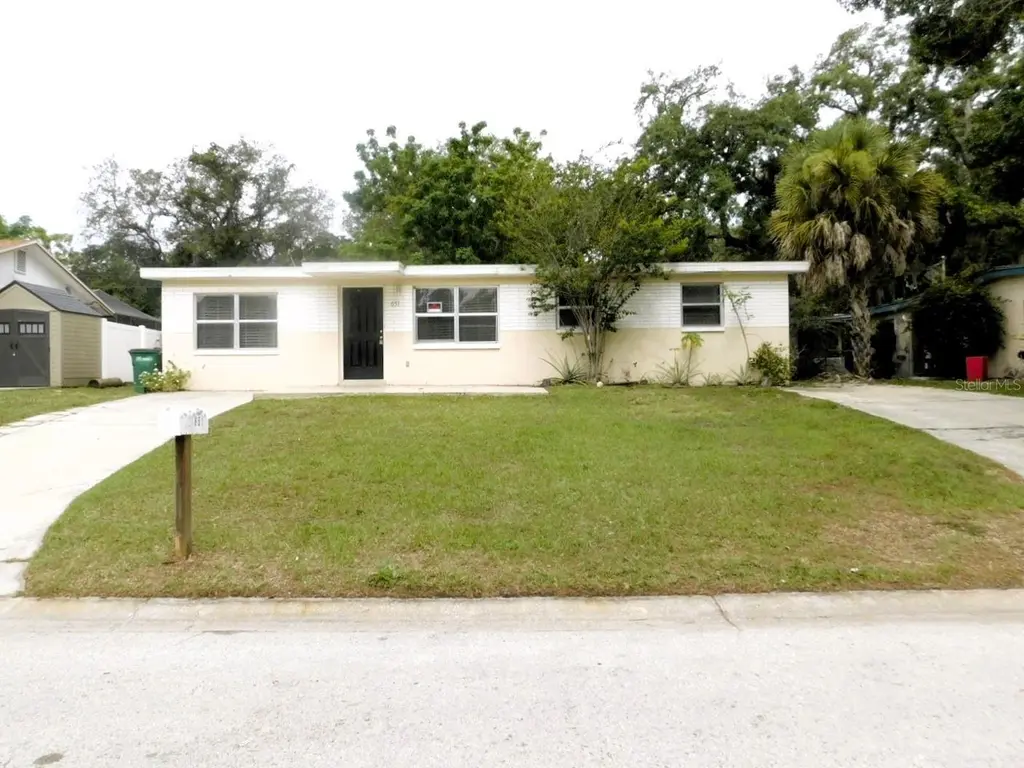
651 12th Ave N · Safety Harbor, FL
Flood risk 3/10 · Minor
- FEMA flood zone
- X (unshaded)
- Chance of flooding over 30 yrs
- 0.12%
- Est. flood insurance / yr
- $507 – $1,088
Fire risk 1/10 · Minimal
- Est. fire insurance / yr
- $947 – $1,759
Heat risk 10/10 · Severe
- Hot days now (above 107°F)
- 7 days/yr
- Hot days in 30 yrs
- 27 days/yr
Wind risk 10/10 · Severe
- Chance of severe wind over 30 yrs
- 99.0%
Air-quality risk 3/10 · Minor
- Unhealthy air days now
- 3 days/yr
- Unhealthy air days in 30 yrs
- 3 days/yr
Risk factors via First Street. Map © Google.
Why this score? — see what drove the C+ grade
The composite is a weighted blend of 9 inputs, each scored 0–100. Each bar is that input's sub-score; the figure is the points it added to the 100-point composite (weight × sub-score).
- Cash flow +20.0/30.0
- ARV discount +15.0/15.0
- DSCR +6.3/10.0
- 1% rule +5.2/10.0
- Livability +4.4/5.0
- Rent growth +4.3/5.0
- Schools +4.3/10.0
- Condition / age +2.5/5.0
- Appreciation +0.0/10.0
$225,000
🖨 Deal sheet (PDF) 📄 Offer letter ✓ Due diligence
Listing remarks MLS
Wow if you're an investor, handyman or have just been looking for one that you can truly make your own, this is truly the one you want. Located at the end of a private road and comes with a very large level lot. this is the opportunity to make it your very own from the ground up. This one has a great open floor plan and it's minutes to shopping. However you can't beat this one in this location. Purchase this property for as little as 5% down! This property is approved for HomePath Mortgage and Homepath Renovation Mortgage.
Key facts
- Fully fenced lot
- Spacious family room
- Inside laundry
Tags
Property features AI
Finance
- Other: Property is unfurnished
- Financial info: Lease restrictions apply
- HOA & community: Pets allowed
Exterior
- Parking: Driveway
- Utilities: Public water; Public sewer; Public utilities
- Home design: Single family residence; Residential property; One story; East-facing
- Construction: Block construction; Other roof type; Slab foundation; Built on one level
- Exterior features: Wood fencing; Other exterior features; No patio or porch listed
Interior
- Kitchen: Range; Refrigerator
- Bedrooms: 3 bedrooms
- Flooring: Carpet; Tile
- Bathrooms: 1 full bathroom
- Heating & cooling: Central heating; Central air conditioning
- Interior features: Living room and dining room combined; Family room; Inside utility
- Laundry & utility: Dedicated laundry room
Neighborhood map
What this means for you Summary
Snapshot
- This is a 3-bed/1.0-bath single-family listed at $225k.
Deal economics
- At list price, monthly cash flow is $276 ($3k/yr) — positive.
- The deal already cash-flows at list — no discount required.
- Meets the 1% rule at list price ($2k rent vs $225k).
- Cap rate 7.8% vs local median 2.7% in Safety Harbor — top-decile yield for the area; either an underpriced asset or a hidden risk that comps aren't pricing in. Stress-test before assuming the spread holds.
Location & tenants
- Location reads 87/100 on livability (#8 in FL, #296 nationally) — a professional / high-income tenant draw. Strengths: crime A+, commute A+, employment A+; Watch: amenities F.
- Pinellas (suburban): math 51% / reading 51% proficiency, ranked #31 of 73 in FL (top 42%) — acceptable for families but not a draw, mixed tenant base, ~2y average lease.
- Zoned schools: Safety Harbor Elementary School (math 63% / reading 66%, grade B, #525 of 2,144 statewide, top 26%, 657 students, 49% FRL); Countryside High School (math 25% / reading 45%, grade F, #379 of 667 statewide, top 58%, 1,741 students, 44% FRL) — zoned schools at 46% FRL track the district average.
- Market conditions: Rents rising fast (+7.3%/yr); 168 active listings in the ZIP; 21 comparable units currently listed for rent nearby; rentals at typical pace (median 19d on market — plan ~3-4 weeks tenant-placement turnaround); solid renter incomes; 2,676 units permitted in Pinellas County in 2024 (1,422 in 5+ unit buildings).
Forward outlook
- Local home prices are declining (-3.0%/yr); year-one equity from $2k of loan paydown is wiped out by about $7k of value loss. Plan a longer hold.
- Pinellas County population projected at +14% by 2050 — modest demand growth; plan on rents tracking national, not racing it.
- At projected returns (-3.0% appreciation + 7.3% rent growth), your $63k cash investment doubles in ~10 years — after that, you're playing with house money.
Negotiation context
- Only 7 days on market — expect competitive offers; lowballing is unlikely to land.
- 6 sale attempts since 16y ago with the ask held roughly flat each time — persistent listings suggest the price (not the market) is what's stuck; bring a comps-based counter.
- Current owner paid $73k; list at $225k implies a 206% gain — meaningful room to come down on a strong offer.
Risks & watch-outs
- Climate carrying-cost: severe wind risk, 99% chance of damaging wind over 30y; extreme-heat days projected 7→27/yr by 2055 (HVAC capex compounding) — expect insurance premiums to compound above CPI over the hold.
Questions for the listing agent
- Built in 1963 — when were the roof, HVAC, electrical panel, plumbing, and water heater last replaced?
- Is there a deadline driving the sale (1031 exchange, divorce, estate, relocation)? That informs how much negotiation room exists.
- Schools are B-rated — typically a magnet for longer-tenancy family renters. What's the average tenant stay here, and is there a school-zone premium baked into asking?
- What's the average days-on-market for RENTAL listings here right now (not sales)? A rising rental-DOM trend means longer vacancies and softer asking-rent achievability than the comps imply.
- What's the recent tenant-quality profile in this submarket — average credit score on applications, eviction rate, late-payment / NSF rate, and stable-employment percentage? A property-management company in the area should have these aggregated.
- How much new for-sale + rental construction is in the pipeline within 1–3 miles? Heavy new supply typically softens prices + rents 12–24 months out; constrained supply supports both.
Investment metrics
- 1% rule
- 1.02% ✓
- Cap rate
- 7.77%
- Cash-on-cash
- 5.26%
- DSCR
- 1.23
- GRM
- 8.2
CMA / ARV
- ARV (on-the-fly)
- $433,125
- Comps found
- 12
Show comp detail 12 sales within ~0.75 mi
| Address | Dist | Beds/Ba | Sqft | Sold | Price | $/sf | Match |
|---|---|---|---|---|---|---|---|
| 1145 7th St N | 0.08mi | 3/1.0 | 1,125 (0%) | 4mo | $215,000 | $191 | 92 |
| 1135 7th St N | 0.09mi | 3/1.0 | 1,175 (+4%) | 13mo | $230,000 | $196 | 78 |
| 660 11th Ave N | 0.11mi | 2/1.0 (-1) | 1,186 (+5%) | 10mo | $265,000 | $223 | 73 |
| 1140 3rd St N | 0.29mi | 2/1.0 (-1) | 1,084 (-4%) | 6mo | $250,000 | $231 | 71 |
| 650 Palm Pl | 0.47mi | 3/2.0 | 1,132 (+1%) | 12mo | $300,000 | $265 | 63 |
| 321 11th Ave S | 0.50mi | 2/2.0 (-1) | 1,095 (-3%) | 1mo | $460,000 | $420 | 62 |
| 348 2nd St S | 0.72mi | 3/1.0 | 1,158 (+3%) | 10mo | $446,196 | $385 | 53 |
| 1404 Oak Haven Dr | 0.64mi | 3/1.0 | 1,000 (-11%) | 2mo | $379,900 | $380 | 50 |
| 1004 7th St S | 0.70mi | 3/2.0 | 1,066 (-5%) | 7mo | $419,000 | $393 | 49 |
| 416 2nd St S | 0.70mi | 2/1.0 (-1) | 1,102 (-2%) | 13mo | $480,000 | $436 | 48 |
| 1145 Withlacoochee St | 0.21mi | 2/1.0 (-1) | 960 (-15%) | 17mo | $389,999 | $406 | 46 |
| 821 6th St S | 0.68mi | 3/2.0 | 1,074 (-4%) | 13mo | $415,000 | $386 | 46 |
Match score weights: distance 35% · size 25% · config 20% · recency 20%. Top-matched comps best support the ARV.
Projected returns pro-forma
-3.0% appreciation · 7.34% rent growth · sell at horizon
- IRR
- -3.4%
- Equity multiple
- 0.87×
- Total profit
- $-8,399
- Equity at exit
- $33,548
- IRR
- 10.6%
- Equity multiple
- 1.99×
- Total profit
- $62,324
- Equity at exit
- $19,454
Cash invested: $63,000 (down + closing). Projections, not guarantees.
Landlord ↔ Tenant lean methodology
- Overall (STATE)
- 87 Strongly Landlord-Friendly
- State Florida
- 87 Strongly Landlord-Friendly · R+3
- County
- — inherits STATE
- City
- — inherits STATE
ZIP-level market 34695
- Home prices YoY
- -30.2%
- Rents YoY
- 7.3%
- Active inventory
- 168
- Price-to-rent
- 8.2×
Monthly cashflow live
- Estimated rent
- $2,293 high interval (Pro) →
- Mortgage (P&I)
- −$1,180
- Tax from tax record
- −$261 /mo · $3,135/yr
- Insurance
- −$94
- HOA
- −$0
- Vacancy / Maint / Mgmt
- −$481
- Net cashflow
- $276
Break-even live
Sensitivity live
| Price | -10% $404 | -5% $340 | +0% $276 | +5% $212 | +10% $149 |
|---|---|---|---|---|---|
| Rent | -10% $95 | -5% $186 | +0% $276 | +5% $367 | +10% $457 |
| Rate | -1.0pp $389 | -0.5pp $333 | base $276 | +0.5pp $218 | +1.0pp $159 |
UW: 25.0% down · 7.5% · 30yr · 1.5% tax · 5.0% vac · 8.0% maint · 8.0% mgmt
Financing live
Cash to close
- Down payment
- $56,250
- Closing costs
- $6,750
- Reserves months
- —
- Total cash needed
- —
Loan-product check · same deal, 3 products live
Conventional
25% down · 7.5% · 30yr
- Down + closing
- —
- Monthly P&I
- —
- Monthly cashflow
- —
- DSCR
- —
- Eligible?
- —
Personal DTI + credit; lowest rate.
DSCR
20% down · 8.5% · 30yr
- Down + closing
- —
- Monthly P&I
- —
- Monthly cashflow
- —
- DSCR
- —
- Eligible?
- —
No personal income docs; deal must DSCR.
Hard money
10% down · 12.0% · 12mo
- Down + closing
- —
- Monthly P&I
- —
- Monthly cashflow
- —
- DSCR
- —
- Eligible?
- —
Short-term bridge; refi at stabilization.
Rent comps 21 comps
| Address | Beds | Baths | Sqft | Rent | $/sqft | DOM | Units | Dist |
|---|---|---|---|---|---|---|---|---|
| 1135 7th St N Safety Harbor, FL | 3.0 | 1.0 | 1125 | $2,195 | $1.95 | 14d | 1 | 0.09mi |
| 1275 Wooddell Dr Safety Harbor, FL | 2.0 | 2.0 | 1223 | $3,700 | $3.03 | 4d | 1 | 0.55mi |
| 625 4th Ave N Safety Harbor, FL | 2.0 | 1.0 | 786 | $2,000 | $2.54 | 25d | 1 | 0.56mi |
| 337 McMullen Booth Rd Clearwater, FL | 2.0 | 1.0 | 1087 | $1,800 | $1.66 | 8d | 1 | 0.56mi |
| 310 7th St N Unit A Safety Harbor, FL | 2.0 | 2.0 | 1250 | $2,250 | $1.80 | 25d | 1 | 0.58mi |
| 500 9th Ave S Apt C1 Safety Harbor, FL | 3.0 | 2.0 | 1182 | $2,195 | $1.86 | 25d | 1 | 0.60mi |
| 500 9th Ave S Apt B3 Safety Harbor, FL | 2.0 | 2.0 | 893 | $1,795 | $2.01 | 25d | 1 | 0.60mi |
| 247 Short St Safety Harbor, FL | 2.0 | 1.0 | 808 | $1,900 | $2.35 | 4d | 1 | 0.71mi |
| 380 3rd St S Unit 4A Safety Harbor, FL | 2.0 | 1.0 | 700 | $2,395 | $3.42 | 18d | 1 | 0.75mi |
| 600 Summerhill Ct Unit A Safety Harbor, FL | 2.0 | 2.0 | 1060 | $2,450 | $2.31 | 25d | 1 | 0.90mi |
| 1066 Philippe Pkwy Unit 2 Safety Harbor, FL | 2.0 | 1.0 | 700 | $1,595 | $2.28 | 24d | 1 | 0.94mi |
| 285 Rogers Ct Safety Harbor, FL | 2.0 | 2.0 | 1013 | $1,795 | $1.77 | 25d | 1 | 1.04mi |
| 1135 Dover Ct Safety Harbor, FL | 2.0 | 2.0 | 1013 | $2,290 | $2.26 | 14d | 1 | 1.04mi |
| 2035 Philippe Pkwy Safety Harbor, FL | 1.0–2.0 | 1.0–2.0 | 718 | $1,920 | $2.67 | 4d | 11 | 1.10mi |
| 313 Bay Pl Safety Harbor, FL | 2.0 | 1.0 | 939 | $1,695 | $1.81 | 11d | 1 | 1.10mi |
| 1155 Thayer St Safety Harbor, FL | 2.0 | 2.0 | 1013 | $2,050 | $2.02 | 17d | 1 | 1.10mi |
| 300 Kent Pl Safety Harbor, FL | 2.0 | 1.0 | 939 | $1,795 | $1.91 | 20d | 1 | 1.13mi |
| 1003 S Bayshore Blvd #103 Safety Harbor, FL | 2.0 | 2.0 | 900 | $2,300 | $2.56 | 25d | 1 | 1.17mi |
| 115 Coral Dr Safety Harbor, FL | 3.0 | 2.0 | 1241 | $3,000 | $2.42 | 5d | 1 | 1.22mi |
| 3021 State Road 590 Clearwater, FL | 1.0–3.0 | 1.0–2.0 | 977 | $2,107 | $2.16 | 2d | 28 | 1.31mi |
| 2973 Feather Dr Clearwater, FL | 2.0 | 1.0 | 812 | $1,450 | $1.79 | 25d | 1 | 1.34mi |
Listing history 7 events
-
2026-06-17remarks 630-char remark
-
2026-06-17status $225,000 Pending 7 DOM
-
2026-06-16days on market $225,000 Active 7 DOM
-
2026-06-15days on market $225,000 Active 6 DOM
-
2026-06-13days on market $225,000 Active 4 DOM
-
2026-06-10remarks 590-char remark
-
2026-06-10$225,000 Active 1 DOM
ⓘ Source: listings_history table (triggers on properties + properties_extension) + one-shot
backfill from property_details.listing_events for pre-trigger history.
Tax reassessment forecast FL · Resets to sale price
- Current annual tax
- $3,135 · $261/mo
- Projected year-2 tax
- $3,135 · $261/mo
- Expected delta
- $0/yr ($0/mo · 0.0%)
ⓘ Screening estimate from a state-policy table — verify with the county assessor before closing.
Climate risk First Street
- Flood 3/10 Moderate FEMA zone X (unshaded) · 12% chance over 30 yrs
- Wildfire 1/10 Low
- Heat 10/10 Extreme 7 d/yr ≥107°F today · 27 d/yr by 30 yrs out
- Wind 10/10 Extreme 99% chance of damaging wind over 30 yrs
- Air quality 3/10 Moderate 3 unhealthy d/yr today · 3 by 30 yrs out
Nearby sold comps map
Loading sold comps map…
Walkable amenities ~0.75 mi
Loading nearby amenities…
Taxation est. · year 1
- Rental income
- $27,511
- − Mortgage interest
- −$12,603
- − Property taxes
- −$3,135
- − Insurance
- −$1,125
- − Repairs & maintenance
- −$2,201
- − Management
- −$2,201
- − Depreciation
- −$6,545
- Taxable loss
- −$300
- Est. tax savings @ 24.0%
- +$72
- After-tax cash flow
- $3,386/yr
For passive investors: Depreciation is non-cash, so a rental often shows a tax loss while cash-flowing — sheltering income. Rental losses are passive: they offset passive income freely, and up to $25,000/yr can offset ordinary (W-2) income if you actively participate and your MAGI is under $100k (phasing out to $0 by $150k); unused losses carry forward. On sale, claimed depreciation is recaptured at up to 25%, and gains may owe capital-gains tax (a 1031 exchange can defer both). Figures are a year-1 estimate at your 24.0% rate — not tax advice; consult a CPA.
Schools (NCES district)
- District
- Pinellas
- NCES district ID
- 1201560
- Math proficiency
- 51% ▼ -5.00%
- Reading proficiency
- 51% ▼ -3.00%
- Median HH income
- $46,270
- Composite
- 43.27/100
- National rank
- #3046
- State rank
- #31 of 73 in FL
Livability — Safety Harbor
- Score
- 87/100
- State rank
- #8
- US rank
- #296
Category grades
Schools grade is shown separately in the Schools card above.
Census & demographics
- Census place
- Safety Harbor, FL
- County
- Pinellas County · 939,478 people
- City population
- 18,098
- Metro
- Tampa-St. Petersburg-Clearwater, FL
- Population (ZIP)
- 18,098
- Household income
- $95,238
- Rent vs Own
- Severe rent burden
- 103.0
Population outlook (Pinellas County) Hauer SSP2
- Today (2025)
- 1,027,532 people
- By 2030
- 1,063,586 · +3.5%
- By 2040
- 1,125,020 · +9.5%
- By 2050
- 1,168,637 · +13.7%
- By 2075
- 1,265,188 · +23.1%
- By 2100
- 1,260,357 · +22.7%
Race, ethnicity, and origin ACS 2023
- Neighborhood character
- Predominantly White (75%)
- Race & ethnicity
- White 75% Hispanic / Latino 11% Black 7% Two or more races 7% Asian 2%
- Hispanic origin (detail)
- Puerto Rican 4% Cuban 3%
- Common ancestry
- Romanian 4% Lithuanian 3% Slovak 2%
- Foreign-born
- 10% · Canada, Jamaica, Vietnam
- Languages at home
- 91% English-only · Spanish 6% Other Indo-European 1% German/W. Germanic 1%
Political lean MEDSL · Pinellas
- 2024 margin
- Lean R (+5.2) · D 46.9% · R 52.1%
- 2008→2024 swing
- -13.5pp toward R · 2008: 8.3pp · 2024: -5.2pp
- All cycles
- 2024: R+5.2 2020: D+0.2 2016: R+1.1 2012: D+5.6 2008: D+8.3
Not yet ingested
- Civics
- —
Market trends
- HPI YoY
- ▼ -144.72%
- Current HPI
- 335.0437
- Rent YoY
- ▲ 7.34%
- Metro
- Tampa-St. Petersburg-Clearwater, FL
- State GDP YoY
- ▲ 3.28%
- F500 in state
- 36
Industry mix (Fortune 500 HQ in FL)
| Industry | F500 HQs | Revenue |
|---|---|---|
| Industrial Technology | 2 | $29B |
|
||
| Insurance | 2 | $17B |
|
||
| Retail | 1 | $60B |
|
||
| Technology Distribution | 1 | $58B |
|
||
| Homebuilding | 1 | $35B |
|
||
| Technology Manufacturing | 1 | $35B |
|
||
Price history
+108.3% since first listed15 events — show timeline
- 2026-06-09 Listed $225,000 Stellar MLS as Distributed by MLS Grid
- 2026-06-07 Rental Removed $2,179 Tricon
- 2026-06-03 Price Changed $2,179 Tricon
- 2026-05-28 Price Changed $2,239 Tricon
- 2026-05-21 Price Changed $2,299 Tricon
- 2026-05-14 Price Changed $2,349 Tricon
- 2026-05-01 Listed for Rent $2,399 Tricon
- 2014-04-11 Sold (MLS) $73,450 Stellar MLS as Distributed by MLS Grid
- 2013-09-16 Listed $74,900 Stellar MLS as Distributed by MLS Grid
- 2013-09-07 Listing Removed — Stellar MLS as Distributed by MLS Grid
- 2013-07-02 Listed $39,500 Stellar MLS as Distributed by MLS Grid
- 2012-05-16 Listing Removed — Stellar MLS as Distributed by MLS Grid
- 2011-06-08 Listed $29,900 Stellar MLS as Distributed by MLS Grid
- 2010-10-13 Listed $48,000 Stellar MLS as Distributed by MLS Grid
- 2004-10-25 Sold (Public Records) $108,000 Public Records
Property tax history
+8.6%/yrLatest (2025): $3,135 · +1.5% YoY. Source: county tax records.
Cash-flow waterfall
monthlySold comps — $/sqft
last 12 mo · ≤1 miLoading sold comps…