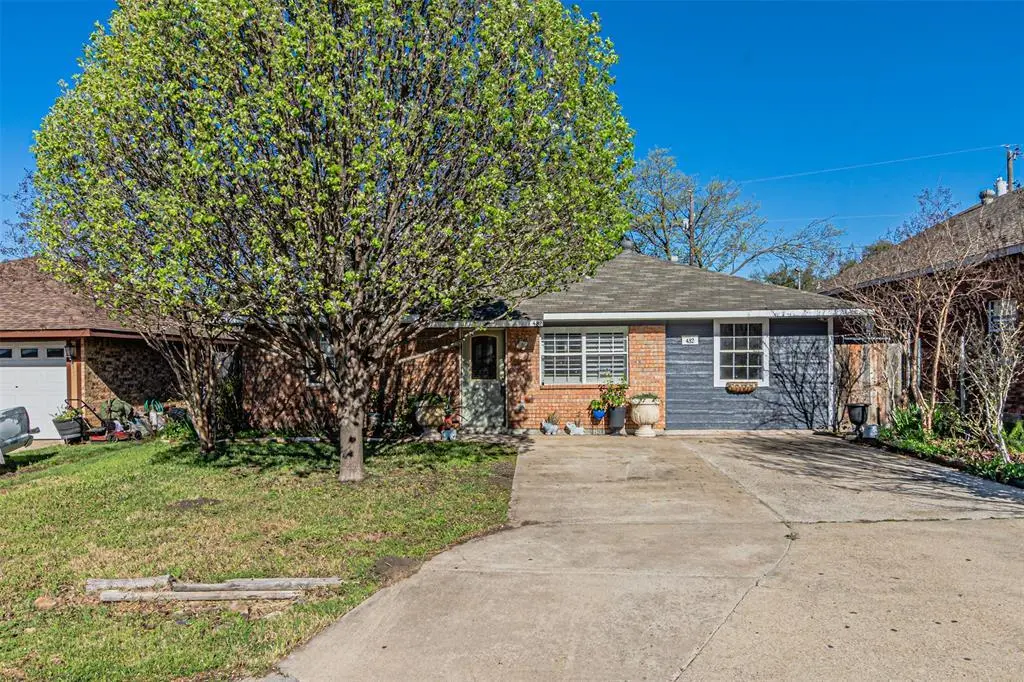
482 Perch Rd · Rockwall, TX
Flood risk 1/10 · Minimal
- FEMA flood zone
- X (unshaded)
- Chance of flooding over 30 yrs
- 0.0%
- Est. flood insurance / yr
- $507 – $1,088
Fire risk 4/10 · Minor
- Est. fire insurance / yr
- $1,222 – $2,270
Heat risk 8/10 · Major
- Hot days now (above 109°F)
- 7 days/yr
- Hot days in 30 yrs
- 25 days/yr
Wind risk 6/10 · Moderate
- Chance of severe wind over 30 yrs
- 27.0%
Air-quality risk 2/10 · Minimal
- Unhealthy air days now
- 2 days/yr
- Unhealthy air days in 30 yrs
- 2 days/yr
Risk factors via First Street. Map © Google.
Why this score? — see what drove the C- grade
The composite is a weighted blend of 9 inputs, each scored 0–100. Each bar is that input's sub-score; the figure is the points it added to the 100-point composite (weight × sub-score).
- Cash flow +16.2/30.0
- ARV discount +14.6/15.0
- DSCR +5.0/10.0
- Schools +5.0/10.0
- 1% rule +4.8/10.0
- Livability +3.9/5.0
- Rent growth +2.9/5.0
- Condition / age +2.5/5.0
- Appreciation +0.0/10.0
$205,000
🖨 Deal sheet 📄 Offer letter ✓ Due diligence
Listing remarks MLS
Welcome to this cozy, very well-maintained home featuring 3 bedrooms and 1 bathroom, located near shopping centers and the freeway. The bathroom has been remodeled, the roof was recently replaced, the water heater was recently replaced, and the home has a new air conditioner.
Key facts
- Remodeled bathroom
- New air conditioner
- Near freeway
Tags
Neighborhood map
What this means for you Summary
Snapshot
- This is a 2-bed/1.0-bath single-family listed at $205k.
Deal economics
- At list price, monthly cash flow is $107 ($1k/yr) — positive.
- The deal already cash-flows at list — no discount required.
- To meet the 1% rule (rent ≥ 1% of price), the offer needs to be $202k (1.7% below list).
- Recommended offer: $187k (9.0% below list) — sets the bar for market timing.
- Cap rate 6.9% vs local median 2.9% in Rockwall — top-decile yield for the area; either an underpriced asset or a hidden risk that comps aren't pricing in. Stress-test before assuming the spread holds.
Location & tenants
- Location reads 77/100 on livability (#86 in TX, #3,043 nationally) — a middle-class / working-renter tenant base. Strengths: employment A+, housing A+, crime A-; Watch: amenities F, commute F.
- Rockwall ISD (suburban): math 54% / reading 54% proficiency, ranked #83 of 826 in TX (top 10%) — acceptable for families but not a draw, mixed tenant base, ~2y average lease.
- Market conditions: Rents rising (+1.5%/yr); 966 active listings in the ZIP; 24 comparable units currently listed for rent nearby; rentals at typical pace (median 18d on market — plan ~3-4 weeks tenant-placement turnaround); high-income renter base; 1,810 units permitted in Rockwall County in 2024 (0 in 5+ unit buildings).
- This rent is only 18% of the median local income ($136k/yr) — well below the 30% rent-burden line; pricing power to push rent on renewal without tenant pushback.
Forward outlook
- Local home prices are declining (-3.0%/yr); year-one equity from $1k of loan paydown is wiped out by about $6k of value loss. Plan a longer hold.
- Rockwall County population projected at +56% by 2050 — long-run rental-demand tailwind backs the buy-and-hold thesis.
Negotiation context
- It's been on market 96 days — a 9% lower offer ($187k) is reasonable based on typical stale-listing flexibility.
Risks & watch-outs
- Climate carrying-cost: major wind risk, 27% chance of damaging wind over 30y; extreme-heat days projected 7→25/yr by 2055 (HVAC capex compounding) — expect insurance premiums to compound above CPI over the hold.
Questions for the listing agent
- It's been on market 96 days. Have you received any prior offers? Is the seller open to a 9% concession, seller financing, or rate buy-down credit?
- Why hasn't it sold? Are there any deal-killer items the seller is aware of (foundation, flood, title, zoning, code violations)?
- Is there a deadline driving the sale (1031 exchange, divorce, estate, relocation)? That informs how much negotiation room exists.
- Schools are B-rated — typically a magnet for longer-tenancy family renters. What's the average tenant stay here, and is there a school-zone premium baked into asking?
- What's the average days-on-market for RENTAL listings here right now (not sales)? A rising rental-DOM trend means longer vacancies and softer asking-rent achievability than the comps imply.
- What's the recent tenant-quality profile in this submarket — average credit score on applications, eviction rate, late-payment / NSF rate, and stable-employment percentage? A property-management company in the area should have these aggregated.
- How much new for-sale + rental construction is in the pipeline within 1–3 miles? Heavy new supply typically softens prices + rents 12–24 months out; constrained supply supports both.
Investment metrics
- 1% rule
- 0.98% ✗
- Cap rate
- 6.92%
- Cash-on-cash
- 2.24%
- DSCR
- 1.10
- GRM
- 8.5
CMA / ARV
- ARV (median comp)
- $243,317
- List price
- $205,000
- Delta
- -15.75%
- Verdict
- UNDERPRICED
- Comps
- 20 within 1.0 mi
Show comp detail 12 sales within ~0.75 mi
| Address | Dist | Beds/Ba | Sqft | Sold | Price | $/sf | Match |
|---|---|---|---|---|---|---|---|
| 410 Lakeside Dr | 0.23mi | 3/1.0 (+1) | 1,188 (-1%) | 3mo | $194,900 | $164 | 80 |
| 630 Trout St | 0.08mi | 3/2.0 (+1) | 1,288 (+7%) | 12mo | $289,000 | $224 | 66 |
| 101 Brockway Dr | 0.47mi | 3/2.0 (+1) | 1,183 (-1%) | 4mo | $275,000 | $232 | 63 |
| 791 Lakeside Dr | 0.12mi | 3/2.0 (+1) | 1,286 (+7%) | 15mo | $280,000 | $218 | 61 |
| 148 Pinion Ln | 0.26mi | 3/2.0 (+1) | 1,261 (+5%) | 14mo | $285,000 | $226 | 58 |
| 226 Rockwall Pkwy | 0.59mi | 3/2.0 (+1) | 1,183 (-1%) | 7mo | $225,000 | $190 | 55 |
| 2937 Goldenwave | 0.57mi | 3/2.0 (+1) | 1,263 (+5%) | 1mo | $315,795 | $250 | 55 |
| 207 Overbrook Ct | 0.52mi | 3/2.0 (+1) | 1,272 (+6%) | 5mo | $199,000 | $156 | 53 |
| 230 Rockwall Pkwy | 0.57mi | 3/2.0 (+1) | 1,251 (+4%) | 11mo | $230,000 | $184 | 48 |
| 2977 Firewheel Dr | 0.56mi | 3/2.0 (+1) | 1,252 (+4%) | 12mo | $279,900 | $224 | 48 |
| 201 Parkway Ct | 0.49mi | 3/2.0 (+1) | 1,312 (+9%) | 7mo | $275,000 | $210 | 47 |
| 3817 Sycamore Ln | 0.32mi | 3/2.0 (+1) | 1,370 (+14%) | 14mo | $318,000 | $232 | 41 |
Match score weights: distance 35% · size 25% · config 20% · recency 20%. Top-matched comps best support the ARV.
Projected returns pro-forma
-3.0% appreciation · 1.47% rent growth · sell at horizon
- IRR
- -14.5%
- Equity multiple
- 0.49×
- Total profit
- $-29,375
- Equity at exit
- $30,566
- IRR
- -8.6%
- Equity multiple
- 0.50×
- Total profit
- $-28,656
- Equity at exit
- $17,725
Cash invested: $57,400 (down + closing). Projections, not guarantees.
Landlord ↔ Tenant lean methodology
- Overall (STATE)
- 87 Strongly Landlord-Friendly
- State Texas
- 87 Strongly Landlord-Friendly · R+5
- County
- — inherits STATE
- City
- — inherits STATE
ZIP-level market 75032
- Home prices YoY
- -22.9%
- Rents YoY
- 1.5%
- Active inventory
- 966
- Price-to-rent
- 8.5×
Monthly cashflow live
- Estimated rent
- $2,016 high interval (Pro) →
- Mortgage (P&I)
- −$1,075
- Tax from tax record
- −$325 /mo · $3,898/yr
- Insurance
- −$85
- HOA
- −$0
- Vacancy / Maint / Mgmt
- −$423
- Net cashflow
- $107
Break-even live
UW: 25.0% down · 7.5% · 30yr · 1.5% tax · 5.0% vac · 8.0% maint · 8.0% mgmt
Financing live
Cash to close
- Down payment
- $51,250
- Closing costs
- $6,150
- Reserves months
- —
- Total cash needed
- —
Loan-product check · same deal, 3 products live
Conventional
25% down · 7.5% · 30yr
- Down + closing
- —
- Monthly P&I
- —
- Monthly cashflow
- —
- DSCR
- —
- Eligible?
- —
Personal DTI + credit; lowest rate.
DSCR
20% down · 8.5% · 30yr
- Down + closing
- —
- Monthly P&I
- —
- Monthly cashflow
- —
- DSCR
- —
- Eligible?
- —
No personal income docs; deal must DSCR.
Hard money
10% down · 12.0% · 12mo
- Down + closing
- —
- Monthly P&I
- —
- Monthly cashflow
- —
- DSCR
- —
- Eligible?
- —
Short-term bridge; refi at stabilization.
Rent comps 24 comps
| Address | Beds | Baths | Sqft | Rent | $/sqft | DOM | Units | Dist |
|---|---|---|---|---|---|---|---|---|
| 552 Trout St Rockwall, TX | 3.0 | 2.0 | 1415 | $2,195 | $1.55 | 7d | 1 | 0.03mi |
| 552 Trout St Rockwall, TX | 3.0 | 2.0 | 1415 | $2,195 | $1.55 | 18d | 1 | 0.03mi |
| 112 Walnut Ln Rockwall, TX | 3.0 | 2.0 | 1491 | $1,895 | $1.27 | 17d | 1 | 0.20mi |
| 152 Pinion Ln Rockwall, TX | 3.0 | 2.0 | 1349 | $1,950 | $1.45 | 7d | 1 | 0.28mi |
| 185 Trout St Rockwall, TX | 3.0 | 2.0 | 1229 | $1,619 | $1.32 | 17d | 1 | 0.33mi |
| 133 Brockway Dr Rockwall, TX | 3.0 | 2.0 | 1358 | $1,799 | $1.32 | 44d | 1 | 0.37mi |
| 140 Trout St Rockwall, TX | 3.0 | 2.0 | 1480 | $1,950 | $1.32 | 22d | 1 | 0.38mi |
| 109 Brockway Dr Rockwall, TX | 3.0 | 2.0 | 1286 | $1,950 | $1.52 | 24d | 1 | 0.42mi |
| 128 Overbrook Dr Rockwall, TX | 3.0 | 2.0 | 1368 | $3,000 | $2.19 | 3d | 1 | 0.44mi |
| 149 Brockway Dr Rockwall, TX | 3.0 | 2.0 | 1358 | $2,100 | $1.55 | 44d | 1 | 0.45mi |
| 151 Brockway Dr Rockwall, TX | 3.0 | 2.0 | 1274 | $1,949 | $1.53 | 44d | 1 | 0.46mi |
| 202 Mapleridge Dr Rockwall, TX | 3.0 | 2.0 | 1156 | $1,965 | $1.70 | 5d | 1 | 0.48mi |
| 336 Cresthaven Dr Rockwall, TX | 3.0 | 2.0 | 1233 | $1,950 | $1.58 | 5d | 1 | 0.60mi |
| 2825 Beverly Dr Rockwall, TX | 3.0 | 2.0 | 1379 | $1,985 | $1.44 | 44d | 1 | 0.67mi |
| 2500 Summer Lee Dr Rockwall, TX | 2.0 | 1.0–2.5 | 902 | $2,330 | $2.58 | 2d | 20 | 1.04mi |
| 2400 Summer Lee Dr Rockwall, TX | 2.0 | 1.0–2.0 | 918 | $2,388 | $2.60 | 1d | 28 | 1.18mi |
| 1452 Hickory Creek Ln Rockwall, TX | 3.0 | 2.0 | 1498 | $1,995 | $1.33 | 24d | 1 | 1.31mi |
| 1476 Hickory Creek Ln Rockwall, TX | 3.0 | 2.0 | 1498 | $1,855 | $1.24 | 20d | 1 | 1.36mi |
| 923 W Yellowjacket Ln Rockwall, TX | 1.0–3.0 | 1.0–2.0 | 970 | $1,674 | $1.73 | 2d | 20 | 1.36mi |
| 1031 Signal Ridge Pl #1031 Rockwall, TX | 1.0 | 1.0 | 827 | $1,285 | $1.55 | 7d | 1 | 1.43mi |
| 1912 Signal Ridge Pl Rockwall, TX | 2.0 | 2.0 | 1222 | $2,200 | $1.80 | 44d | 1 | 1.43mi |
| 2600 Lakefront Trl Rockwall, TX | 2.0 | 1.0–2.0 | 952 | $3,539 | $3.72 | 2d | 23 | 1.45mi |
| 295 I-30 Rockwall, TX | 1.0 | 1.0 | 718 | $873 | $1.22 | 44d | 1 | 1.49mi |
| 1121 Signal Ridge Pl Rockwall, TX | 1.0 | 1.0 | 864 | $1,350 | $1.56 | 44d | 1 | 1.50mi |
Listing history 21 events
-
2026-06-18days on market $205,000 Active 96 DOM
-
2026-06-17days on market $205,000 Active 95 DOM
-
2026-06-16days on market $205,000 Active 94 DOM
-
2026-06-15days on market $205,000 Active 93 DOM
-
2026-06-13days on market $205,000 Active 91 DOM
-
2026-06-13days on market $205,000 Active 90 DOM
-
2026-06-09days on market $205,000 Active 87 DOM
-
2026-06-08days on market $205,000 Active 86 DOM
-
2026-06-07days on market $205,000 Active 85 DOM
-
2026-06-04days on market $205,000 Active 82 DOM
-
2026-06-03days on market $205,000 Active 81 DOM
-
2026-06-02days on market $205,000 Active 80 DOM
-
2026-06-01days on market $205,000 Active 79 DOM
-
2026-05-31days on market $205,000 Active 78 DOM
-
2026-05-06price $205,000 276-char remark
Show marketing remark (276 chars)
Welcome to this cozy, very well-maintained home featuring 3 bedrooms and 1 bathroom, located near shopping centers and the freeway. The bathroom has been remodeled, the roof was recently replaced, the water heater was recently replaced, and the home has a new air conditioner.
-
2026-04-16price $218,000 276-char remark
Show marketing remark (276 chars)
Welcome to this cozy, very well-maintained home featuring 3 bedrooms and 1 bathroom, located near shopping centers and the freeway. The bathroom has been remodeled, the roof was recently replaced, the water heater was recently replaced, and the home has a new air conditioner.
-
2026-03-14$235,900 Active 276-char remark
Show marketing remark (276 chars)
Welcome to this cozy, very well-maintained home featuring 3 bedrooms and 1 bathroom, located near shopping centers and the freeway. The bathroom has been remodeled, the roof was recently replaced, the water heater was recently replaced, and the home has a new air conditioner.
-
2021-11-08soldstatus
-
2020-07-28soldstatus
-
2018-05-01soldstatus
-
1998-05-18soldstatus
ⓘ Source: listings_history table (triggers on properties + properties_extension) + one-shot
backfill from property_details.listing_events for pre-trigger history.
Tax reassessment forecast TX · Resets to sale price
- Current annual tax
- $3,898 · $325/mo
- Projected year-2 tax
- $3,898 · $325/mo
- Expected delta
- $0/yr ($0/mo · 0.0%)
ⓘ Screening estimate from a state-policy table — verify with the county assessor before closing.
Climate risk First Street
- Flood 1/10 Low FEMA zone X (unshaded) · 0% chance over 30 yrs
- Wildfire 4/10 Moderate
- Heat 8/10 Severe 7 d/yr ≥109°F today · 25 d/yr by 30 yrs out
- Wind 6/10 Major 27% chance of damaging wind over 30 yrs
- Air quality 2/10 Low 2 unhealthy d/yr today · 2 by 30 yrs out
Nearby sold comps map
Loading sold comps map…
Walkable amenities ~0.75 mi
Loading nearby amenities…
Taxation est. · year 1
- Rental income
- $24,190
- − Mortgage interest
- −$11,483
- − Property taxes
- −$3,898
- − Insurance
- −$1,025
- − Repairs & maintenance
- −$1,935
- − Management
- −$1,935
- − Depreciation
- −$5,964
- Taxable loss
- −$2,050
- Est. tax savings @ 24.0%
- +$492
- After-tax cash flow
- $1,779/yr
For passive investors: Depreciation is non-cash, so a rental often shows a tax loss while cash-flowing — sheltering income. Rental losses are passive: they offset passive income freely, and up to $25,000/yr can offset ordinary (W-2) income if you actively participate and your MAGI is under $100k (phasing out to $0 by $150k); unused losses carry forward. On sale, claimed depreciation is recaptured at up to 25%, and gains may owe capital-gains tax (a 1031 exchange can defer both). Figures are a year-1 estimate at your 24.0% rate — not tax advice; consult a CPA.
Schools (NCES district)
- District
- Rockwall ISD
- NCES district ID
- 4837650
- Math proficiency
- 54% ▼ -13.00%
- Reading proficiency
- 54% ▼ -8.00%
- Median HH income
- $88,800
- Composite
- 49.82/100
- National rank
- #1952
- State rank
- #83 of 826 in TX
Livability — Rockwall
- Score
- 77/100
- State rank
- #86
- US rank
- #3043
Category grades
Schools grade is shown separately in the Schools card above.
Census & demographics
- Census place
- Rockwall, TX
- County
- Rockwall County · 132,930 people
- City population
- 84,191
- Metro
- Dallas-Fort Worth-Arlington, TX
- Population (ZIP)
- 39,865
- Household income
- $135,742
- Rent vs Own
- Severe rent burden
- 636.0
Population outlook (Rockwall County) Hauer SSP2
- Today (2025)
- 118,396 people
- By 2030
- 132,209 · +11.7%
- By 2040
- 159,538 · +34.7%
- By 2050
- 185,299 · +56.5%
- By 2075
- 243,489 · +105.7%
- By 2100
- 277,814 · +134.6%
Race, ethnicity, and origin ACS 2023
- Neighborhood character
- Predominantly White (67%)
- Race & ethnicity
- White 67% Hispanic / Latino 17% Two or more races 9% Black 9% Asian 3%
- Hispanic origin (detail)
- Mexican 11% Puerto Rican 1%
- Common ancestry
- Slovak 3% Lithuanian 2% Italian 2%
- Foreign-born
- 10% · Canada
- Languages at home
- 84% English-only · Spanish 10% Other Indo-European 2% Arabic 1%
Political lean MEDSL · Rockwall
- 2024 margin
- Solid R (+40.9) · D 29.1% · R 70.0%
- 2008→2024 swing
- +5.3pp toward D · 2008: -46.2pp · 2024: -40.9pp
- All cycles
- 2024: R+40.9 2020: R+37.7 2016: R+47.5 2012: R+53.3 2008: R+46.2
Not yet ingested
- Civics
- —
Market trends
- HPI YoY
- ▼ -61.97%
- Current HPI
- 209.0229
- Rent YoY
- ▲ 1.47%
- Metro
- Dallas-Fort Worth-Arlington, TX
- State GDP YoY
- ▲ 3.95%
- F500 in state
- 110
Industry mix (Fortune 500 HQ in TX)
| Industry | F500 HQs | Revenue |
|---|---|---|
| Energy | 16 | $1,198B |
|
||
| Technology | 5 | $198B |
|
||
| Engineering / Construction | 4 | $72B |
|
||
| Energy Services | 3 | $60B |
|
||
| Utilities | 3 | $41B |
|
||
| Healthcare | 2 | $330B |
|
||
Price history
-13.1% since first listed7 events — show timeline
- 2026-05-06 Price Changed $205,000 NTREIS
- 2026-04-16 Price Changed $218,000 NTREIS
- 2026-03-14 Listed $235,900 NTREIS
- 2021-11-08 Sold (Public Records) — Public Records
- 2020-07-28 Sold (Public Records) — Public Records
- 2018-05-01 Sold (Public Records) — Public Records
- 1998-05-18 Sold (Public Records) — Public Records
Property tax history
+7.3%/yrLatest (2025): $3,898 · -2.0% YoY. Source: county tax records.
Cash-flow waterfall
monthlySold comps — $/sqft
last 12 mo · ≤1 miLoading sold comps…