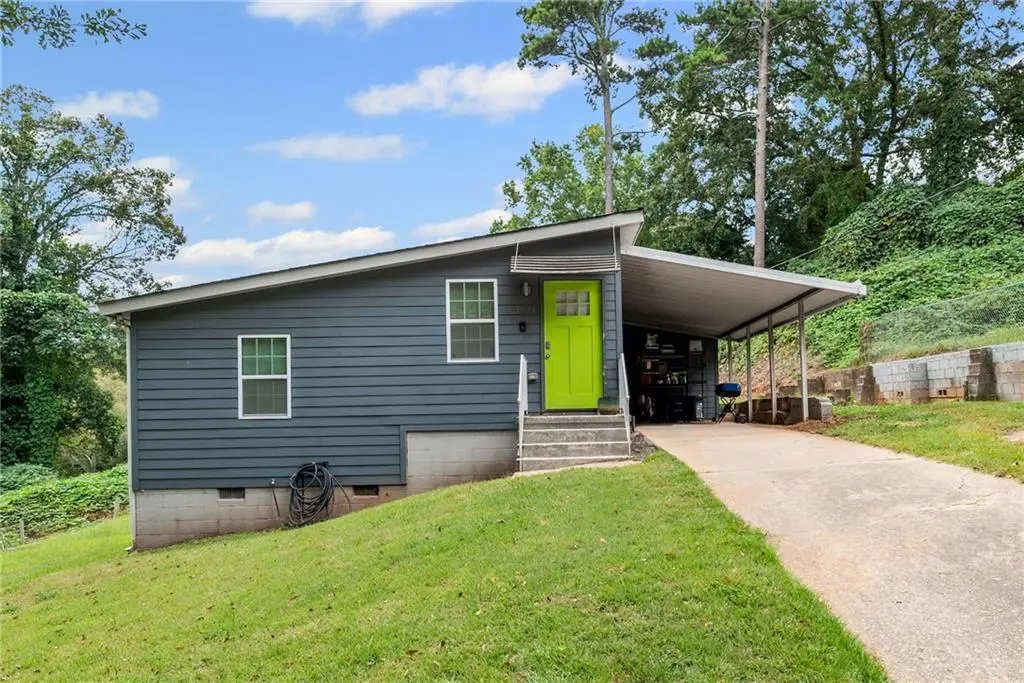
1621 Abner Ter NW · Atlanta, GA
Flood risk 1/10 · Minimal
- FEMA flood zone
- X (unshaded)
- Chance of flooding over 30 yrs
- 0.0%
- Est. flood insurance / yr
- $473 – $860
Fire risk 2/10 · Minimal
- Est. fire insurance / yr
- $963 – $1,789
Heat risk 5/10 · Moderate
- Hot days now (above 104°F)
- 6 days/yr
- Hot days in 30 yrs
- 15 days/yr
Wind risk 4/10 · Minor
- Chance of severe wind over 30 yrs
- 21.0%
Air-quality risk 4/10 · Minor
- Unhealthy air days now
- 3 days/yr
- Unhealthy air days in 30 yrs
- 5 days/yr
Risk factors via First Street. Map © Google.
Why this score? — see what drove the D grade
The composite is a weighted blend of 9 inputs, each scored 0–100. Each bar is that input's sub-score; the figure is the points it added to the 100-point composite (weight × sub-score).
- Cash flow +12.0/30.0
- ARV discount +9.6/15.0
- Livability +4.2/5.0
- DSCR +3.5/10.0
- Rent growth +3.3/5.0
- 1% rule +2.8/10.0
- Schools +2.7/10.0
- Condition / age +2.5/5.0
- Appreciation +0.0/10.0
$250,000
🖨 Deal sheet (PDF) 📄 Offer letter ✓ Due diligence
Listing remarks MLS
This is your first home or investment property! Incredible value in the city for a 3 bedroom 2 bathroom with carport and spacious backyard. The kitchen boasts stainless steel appliances, granite countertops and ample cabinet storage. The rooms offer cozy vibes with two full bathrooms! This is perfect for your first home (with several down payment assistance options) or your STR investment property right before the World Cup in 2026! This home qualifies for up $50,000 down payment assistance and a 6.5 or 6.625% interest rate! This can become your home for as little as $1500 of your own funds.
Key facts
- Spacious backyard
- Granite countertops
- 8,664 sq ft lot
Tags
Neighborhood map
What this means for you Summary
Snapshot
- This is a 3-bed/2.0-bath single-family listed at $250k.
Deal economics
- At list price, monthly cash flow is $-61 ($-738/yr) — negative.
- To cash-flow at today's rent, offer at most $239k (4.3% below list).
- To meet the 1% rule (rent ≥ 1% of price), the offer needs to be $195k (22.0% below list).
- Recommended offer: $195k (22.0% below list) — sets the bar for 1% rule.
- Cap rate 6.0% vs local median 3.1% in Atlanta — top-decile yield for the area; either an underpriced asset or a hidden risk that comps aren't pricing in. Stress-test before assuming the spread holds.
Location & tenants
- Location reads 83/100 on livability (#6 in GA, #919 nationally) — a professional / high-income tenant draw. Strengths: amenities A+, commute A+, housing A+; Watch: schools C-, cost of living C-.
- Atlanta Public Schools (urban): math 28% / reading 35% proficiency, ranked #80 of 174 in GA (top 46%) — families likely to look elsewhere, expect single-tenant / working-renter base with shorter leases; 71% free/reduced lunch — lower-income household profile, screen leases tightly.
- Market conditions: Rents rising (+3.3%/yr); 732 active listings in the ZIP; 40 comparable units currently listed for rent nearby; rentals at typical pace (median 15d on market — plan ~3-4 weeks tenant-placement turnaround); solid renter incomes; 11,565 units permitted in Fulton County in 2024 (8,159 in 5+ unit buildings).
Forward outlook
- Local home prices are declining (-3.0%/yr); year-one equity from $2k of loan paydown is wiped out by about $8k of value loss. Plan a longer hold.
- Fulton County population projected at +38% by 2050 — long-run rental-demand tailwind backs the buy-and-hold thesis.
Negotiation context
- It's been on market 73 days — a 6% lower offer ($235k) is reasonable based on typical stale-listing flexibility.
- 9 sale attempts since 7y ago with the ask held roughly flat each time — persistent listings suggest the price (not the market) is what's stuck; bring a comps-based counter.
- Current owner paid $175k; 43% above their basis — modest negotiation headroom, anchor on the comps not their cost.
Risks & watch-outs
- Climate carrying-cost: extreme-heat days projected 6→15/yr by 2055 (HVAC capex compounding) — expect insurance premiums to compound above CPI over the hold.
Questions for the listing agent
- What do current leases actually rent for vs. the listed asking? Can we see a recent rent roll and the last 12 months of T-12 income?
- It's been on market 73 days. Have you received any prior offers? Is the seller open to a 22% concession, seller financing, or rate buy-down credit?
- Built in 1961 — when were the roof, HVAC, electrical panel, plumbing, and water heater last replaced?
- Why hasn't it sold? Are there any deal-killer items the seller is aware of (foundation, flood, title, zoning, code violations)?
- Is there a deadline driving the sale (1031 exchange, divorce, estate, relocation)? That informs how much negotiation room exists.
- The area grade is low — what's the realistic commute time and amenity access for the typical tenant pool here? Any planned neighborhood developments (good or bad) we should know about?
- What's the average days-on-market for RENTAL listings here right now (not sales)? A rising rental-DOM trend means longer vacancies and softer asking-rent achievability than the comps imply.
- What's the recent tenant-quality profile in this submarket — average credit score on applications, eviction rate, late-payment / NSF rate, and stable-employment percentage? A property-management company in the area should have these aggregated.
- How much new for-sale + rental construction is in the pipeline within 1–3 miles? Heavy new supply typically softens prices + rents 12–24 months out; constrained supply supports both.
Investment metrics
- 1% rule
- 0.78% ✗
- Cap rate
- 6.00%
- Cash-on-cash
- -1.05%
- DSCR
- 0.95
- GRM
- 10.7
CMA / ARV
- ARV (median comp)
- $262,426
- List price
- $250,000
- Delta
- -4.74%
- Verdict
- FAIR
- Comps
- 20 within 1.0 mi
Show comp detail 11 sales within ~0.75 mi
| Address | Dist | Beds/Ba | Sqft | Sold | Price | $/sf | Match |
|---|---|---|---|---|---|---|---|
| 2246 Abner Pl NW | 0.21mi | 3/1.0 | 1,169 (-5%) | 1mo | $155,000 | $133 | 76 |
| 1585 Abner Ter NW | 0.08mi | 3/1.5 | 1,049 (-15%) | 8mo | $275,000 | $262 | 63 |
| 2383 Perry Blvd NW | 0.38mi | 3/2.0 | 1,200 (-3%) | 18mo | $110,000 | $92 | 63 |
| 1705 NW Mary George Ave | 0.14mi | 4/2.0 (+1) | 1,100 (-11%) | 12mo | $275,000 | $250 | 61 |
| 1956 Main St NW | 0.68mi | 2/2.0 (-1) | 1,242 (+1%) | 4mo | $419,900 | $338 | 59 |
| 1943 Main St NW | 0.63mi | 3/2.0 | 1,195 (-3%) | 13mo | $439,000 | $367 | 55 |
| 1639 Bridgeport Dr NW | 0.71mi | 3/2.0 | 1,150 (-7%) | 4mo | $156,000 | $136 | 52 |
| 2323 Abner Pl NW | 0.14mi | 4/2.0 (+1) | 1,400 (+14%) | 20mo | $270,000 | $193 | 49 |
| 1920 Main St NW | 0.56mi | 3/2.0 | 1,367 (+11%) | 8mo | $284,500 | $208 | 48 |
| 1595 Mccallie Blvd | 0.36mi | 3/1.0 | 1,093 (-11%) | 20mo | $165,000 | $151 | 44 |
| 2432 Brantley St NW | 0.74mi | 3/2.0 | 1,330 (+8%) | 21mo | $430,000 | $323 | 35 |
Match score weights: distance 35% · size 25% · config 20% · recency 20%. Top-matched comps best support the ARV.
Projected returns pro-forma
-3.0% appreciation · 3.26% rent growth · sell at horizon
- IRR
- -17.8%
- Equity multiple
- 0.37×
- Total profit
- $-43,963
- Equity at exit
- $37,276
- IRR
- -9.5%
- Equity multiple
- 0.41×
- Total profit
- $-41,408
- Equity at exit
- $21,615
Cash invested: $70,000 (down + closing). Projections, not guarantees.
Landlord ↔ Tenant lean methodology
- Overall (STATE)
- 90 Strongly Landlord-Friendly
- State Georgia
- 90 Strongly Landlord-Friendly · R+3
- County
- — inherits STATE
- City
- — inherits STATE
ZIP-level market 30318
- Rents YoY
- 3.3%
- Active inventory
- 732
- Price-to-rent
- 10.7×
Monthly cashflow live
- Estimated rent
- $1,950 high interval (Pro) →
- Mortgage (P&I)
- −$1,311
- Tax from tax record
- −$187 /mo · $2,245/yr
- Insurance
- −$104
- HOA
- −$0
- Vacancy / Maint / Mgmt
- −$410
- Net cashflow
- $-61
Break-even live
Sensitivity live
| Price | -10% $80 | -5% $9 | +0% $-61 | +5% $-132 | +10% $-203 |
|---|---|---|---|---|---|
| Rent | -10% $-216 | -5% $-139 | +0% $-61 | +5% $16 | +10% $93 |
| Rate | -1.0pp $64 | -0.5pp $2 | base $-61 | +0.5pp $-126 | +1.0pp $-192 |
UW: 25.0% down · 7.5% · 30yr · 1.5% tax · 5.0% vac · 8.0% maint · 8.0% mgmt
Financing live
Cash to close
- Down payment
- $62,500
- Closing costs
- $7,500
- Reserves months
- —
- Total cash needed
- —
Loan-product check · same deal, 3 products live
Conventional
25% down · 7.5% · 30yr
- Down + closing
- —
- Monthly P&I
- —
- Monthly cashflow
- —
- DSCR
- —
- Eligible?
- —
Personal DTI + credit; lowest rate.
DSCR
20% down · 8.5% · 30yr
- Down + closing
- —
- Monthly P&I
- —
- Monthly cashflow
- —
- DSCR
- —
- Eligible?
- —
No personal income docs; deal must DSCR.
Hard money
10% down · 12.0% · 12mo
- Down + closing
- —
- Monthly P&I
- —
- Monthly cashflow
- —
- DSCR
- —
- Eligible?
- —
Short-term bridge; refi at stabilization.
Rent comps 40 comps
| Address | Beds | Baths | Sqft | Rent | $/sqft | DOM | Units | Dist |
|---|---|---|---|---|---|---|---|---|
| 1648 Mary George Ave NW Atlanta, GA | 3.0 | 2.0 | 1056 | $1,950 | $1.85 | 12d | 1 | 0.08mi |
| 1725 Church St NW Atlanta, GA | 4.0 | 2.0 | 1274 | $2,013 | $1.58 | 0d | 1 | 0.32mi |
| 2430 Perry Blvd NW Atlanta, GA | 2.0 | 1.0 | 800 | $1,500 | $1.88 | 25d | 1 | 0.39mi |
| 1620 Hollywood Rd NW Atlanta, GA | 3.0 | 1.0 | 937 | $1,199 | $1.28 | 4d | 1 | 0.40mi |
| 2265 Perry Blvd NW Atlanta, GA | 3.0 | 1.0 | 645 | $1,580 | $2.45 | 0d | 25 | 0.42mi |
| 2431 Saint Paul Ave NW Atlanta, GA | 3.0 | 2.0 | 1134 | $2,045 | $1.80 | 3d | 1 | 0.71mi |
| 1647 Bridgeport Dr NW Atlanta, GA | 4.0 | 2.0 | 1250 | $2,100 | $1.68 | 5d | 1 | 0.72mi |
| 2019 Claude St NW Atlanta, GA | 3.0 | 1.5 | 925 | $1,900 | $2.05 | 25d | 1 | 0.72mi |
| 2625 Peyton Rd NW Atlanta, GA | 3.0 | 2.0 | 1100 | $2,300 | $2.09 | 19d | 1 | 0.80mi |
| 2075 Claude St NW Atlanta, GA | 3.0 | 1.0 | 925 | $1,750 | $1.89 | 25d | 1 | 0.84mi |
| 10 Smith St NW Atlanta, GA | 2.0 | 2.0 | 1008 | $2,395 | $2.38 | 0d | 1 | 0.84mi |
| 10 Smith St NW Atlanta, GA | 2.0 | 2.0 | 1008 | $2,395 | $2.38 | 15d | 1 | 0.84mi |
| 2284 Alvin Dr NW Unit B 1 Atlanta, GA | 3.0 | 1.0 | 875 | $1,025 | $1.17 | 0d | 1 | 0.85mi |
| 2284 Alvin Dr NW Unit B 1 Atlanta, GA | 3.0 | 1.0 | 875 | $1,025 | $1.17 | 4d | 1 | 0.85mi |
| 2284 Alvin Dr NW Unit D Atlanta, GA | 2.0 | 1.0 | 868 | $995 | $1.15 | 0d | 1 | 0.85mi |
| 2284 Alvin Dr NW Unit D Atlanta, GA | 2.0 | 1.0 | 868 | $995 | $1.15 | 4d | 1 | 0.85mi |
| 2145 Bolton Rd NW Atlanta, GA | 1.0–2.0 | 1.0 | 800 | $1,249 | $1.56 | 3d | 2 | 0.99mi |
| 2862 Argyle Dr NW Atlanta, GA | 3.0 | 1.0 | 816 | $1,700 | $2.08 | 6d | 1 | 1.02mi |
| 2000 James Jackson Pkwy NW Atlanta, GA | 1.0–2.0 | 1.0–2.0 | 909 | $2,240 | $2.46 | 0d | 10 | 1.02mi |
| 1315 Northwest Dr NW Atlanta, GA | 3.0 | 1.0–2.0 | 908 | $2,415 | $2.66 | 0d | 34 | 1.03mi |
| 1212 James Jackson Pkwy NW Atlanta, GA | 3.0 | 2.0 | 1211 | $1,782 | $1.47 | 16d | 1 | 1.07mi |
| 1110 Cato St NW Atlanta, GA | 3.0 | 1.0 | 1050 | $1,400 | $1.33 | 25d | 1 | 1.11mi |
| 2130 Main St NW Atlanta, GA | 2.0 | 1.0 | 768 | $1,900 | $2.47 | 25d | 1 | 1.12mi |
| 2888 Parrott Ave NW Unit A Atlanta, GA | 2.0 | 1.0 | 1020 | $1,650 | $1.62 | 21d | 1 | 1.20mi |
| 1970 Sumter St NW Atlanta, GA | 3.0 | 1.0 | 958 | $1,795 | $1.87 | 22d | 1 | 1.21mi |
| 38 Hollywood Dr NW Atlanta, GA | 4.0 | 2.0 | 1400 | $2,200 | $1.57 | 25d | 1 | 1.23mi |
| 1400 Northwest Dr NW Unit A Atlanta, GA | 3.0 | 2.0 | 1228 | $2,600 | $2.12 | 25d | 1 | 1.23mi |
| 991 Ada Ave NW Atlanta, GA | 4.0 | 2.0 | 1458 | $2,450 | $1.68 | 25d | 1 | 1.27mi |
| 1006 Hightower Rd NW Atlanta, GA | 3.0 | 2.0 | 1320 | $2,065 | $1.56 | 15d | 1 | 1.32mi |
| 1910 La Dawn Ln NW Atlanta, GA | 3.0 | 1.0 | 1247 | $2,200 | $1.76 | 0d | 1 | 1.32mi |
| 1910 La Dawn Ln NW Atlanta, GA | 3.0 | 1.0 | 1247 | $2,200 | $1.76 | 25d | 1 | 1.32mi |
| 2595 Elliott St NW Atlanta, GA | 4.0 | 2.0 | 1101 | $1,900 | $1.73 | 12d | 1 | 1.34mi |
| 929 N Grand Ave NW Atlanta, GA | 3.0 | 2.0 | 1100 | $2,500 | $2.27 | 25d | 1 | 1.35mi |
| 1026 Sims Ave NW Unit B Atlanta, GA | 4.0 | 3.0 | 1492 | $2,842 | $1.90 | 25d | 1 | 1.37mi |
| 2355 Hill St NW Atlanta, GA | 3.0 | 3.0 | 1320 | $1,700 | $1.29 | 25d | 1 | 1.37mi |
| 2232 Dunseath Ave NW Atlanta, GA | 2.0 | 1.5 | 950 | $1,800 | $1.89 | 6d | 1 | 1.41mi |
| 1804 Sumter St NW Atlanta, GA | 2.0 | 1.0 | 1072 | $2,450 | $2.29 | 25d | 1 | 1.41mi |
| 2232 Dunseath Ave NW #404 Atlanta, GA | 2.0 | 1.5 | 950 | $1,950 | $2.05 | 23d | 1 | 1.42mi |
| 2232 Dunseath Ave NW #108 Atlanta, GA | 2.0 | 1.5 | 950 | $1,750 | $1.84 | 6d | 1 | 1.42mi |
| 874 Center Hill Ave NW Atlanta, GA | 3.0 | 2.0 | 1176 | $1,695 | $1.44 | 25d | 1 | 1.44mi |
Listing history 37 events
-
2026-06-21days on market $250,000 Active 73 DOM
-
2026-06-18days on market $250,000 Active 70 DOM
-
2026-06-17days on market $250,000 Active 69 DOM
-
2026-06-16days on market $250,000 Active 68 DOM
-
2026-06-15days on market $250,000 Active 67 DOM
-
2026-06-13days on market $250,000 Active 65 DOM
-
2026-06-13days on market $250,000 Active 64 DOM
-
2026-06-09days on market $250,000 Active 61 DOM
-
2026-06-08days on market $250,000 Active 60 DOM
-
2026-06-07days on market $250,000 Active 59 DOM
-
2026-06-04days on market $250,000 Active 56 DOM
-
2026-06-03days on market $250,000 Active 55 DOM
-
2026-06-02days on market $250,000 Active 54 DOM
-
2026-06-01days on market $250,000 Active 53 DOM
-
2026-05-31days on market $250,000 Active 52 DOM
-
2026-04-09$250,000 Active 598-char remark
Show marketing remark (598 chars)
This is your first home or investment property! Incredible value in the city for a 3 bedroom 2 bathroom with carport and spacious backyard. The kitchen boasts stainless steel appliances, granite countertops and ample cabinet storage. The rooms offer cozy vibes with two full bathrooms! This is perfect for your first home (with several down payment assistance options) or your STR investment property right before the World Cup in 2026! This home qualifies for up $50,000 down payment assistance and a 6.5 or 6.625% interest rate! This can become your home for as little as $1500 of your own funds.
-
2026-03-30$250,000 New 598-char remark
Show marketing remark (598 chars)
This is your first home or investment property! Incredible value in the city for a 3 bedroom 2 bathroom with carport and spacious backyard. The kitchen boasts stainless steel appliances, granite countertops and ample cabinet storage. The rooms offer cozy vibes with two full bathrooms! This is perfect for your first home (with several down payment assistance options) or your STR investment property right before the World Cup in 2026! This home qualifies for up $50,000 down payment assistance and a 6.5 or 6.625% interest rate! This can become your home for as little as $1500 of your own funds.
-
2026-02-16historical
-
2026-02-16historical
-
2025-10-02$275,000 Active
-
2025-09-12$275,000 New
-
2024-05-06status Active
-
2024-05-06historical
-
2024-04-07status Pending
-
2024-04-03historical Active Under Contract
-
2024-03-29$279,000 Active
-
2019-07-30soldstatus $175,000 Closed
-
2019-07-30soldstatus $175,000 Sold
-
2019-07-30soldstatus $175,000
-
2019-05-25status Under Contract
-
2019-05-25status Pending
-
2019-05-10price $176,000
-
2019-05-09price $176,000
-
2019-04-18$179,000 Active
-
2019-04-18$179,000 New
-
2019-04-18$176,000
-
2018-08-09soldstatus $50,000
ⓘ Source: listings_history table (triggers on properties + properties_extension) + one-shot
backfill from property_details.listing_events for pre-trigger history.
Tax reassessment forecast GA · Resets to sale price
- Current annual tax
- $2,245 · $187/mo
- Projected year-2 tax
- $2,300 · $192/mo
- Expected delta
- +$55/yr (+$5/mo · 2.4%)
ⓘ Screening estimate from a state-policy table — verify with the county assessor before closing.
Climate risk First Street
- Flood 1/10 Low FEMA zone X (unshaded) · 0% chance over 30 yrs
- Wildfire 2/10 Low
- Heat 5/10 Major 6 d/yr ≥104°F today · 15 d/yr by 30 yrs out
- Wind 4/10 Moderate 21% chance of damaging wind over 30 yrs
- Air quality 4/10 Moderate 3 unhealthy d/yr today · 5 by 30 yrs out
Nearby sold comps map
Loading sold comps map…
Walkable amenities ~0.75 mi
Loading nearby amenities…
Taxation est. · year 1
- Rental income
- $23,405
- − Mortgage interest
- −$14,004
- − Property taxes
- −$2,245
- − Insurance
- −$1,250
- − Repairs & maintenance
- −$1,872
- − Management
- −$1,872
- − Depreciation
- −$7,273
- Taxable loss
- −$5,112
- Est. tax savings @ 24.0%
- +$1,227
- After-tax cash flow
- $489/yr
For passive investors: Depreciation is non-cash, so a rental often shows a tax loss while cash-flowing — sheltering income. Rental losses are passive: they offset passive income freely, and up to $25,000/yr can offset ordinary (W-2) income if you actively participate and your MAGI is under $100k (phasing out to $0 by $150k); unused losses carry forward. On sale, claimed depreciation is recaptured at up to 25%, and gains may owe capital-gains tax (a 1031 exchange can defer both). Figures are a year-1 estimate at your 24.0% rate — not tax advice; consult a CPA.
Schools (NCES district)
- District
- Atlanta Public Schools
- NCES district ID
- 1300120
- Math proficiency
- 28% ▼ -6.00%
- Reading proficiency
- 35% ▼ -2.00%
- Median HH income
- $48,306
- Composite
- 27.27/100
- National rank
- #7006
- State rank
- #80 of 174 in GA
Livability — Atlanta
- Score
- 83/100
- State rank
- #6
- US rank
- #919
Category grades
Schools grade is shown separately in the Schools card above.
Census & demographics
- Census place
- Atlanta, GA
- County
- Fulton County · 1,094,430 people
- City population
- 629,525
- Metro
- Atlanta-Sandy Springs-Alpharetta, GA
- Population (ZIP)
- 59,609
- Household income
- $83,116
- Rent vs Own
- Severe rent burden
- 4182.0
Population outlook (Fulton County) Hauer SSP2
- Today (2025)
- 1,203,707 people
- By 2030
- 1,299,706 · +8.0%
- By 2040
- 1,488,256 · +23.6%
- By 2050
- 1,664,580 · +38.3%
- By 2075
- 2,036,072 · +69.2%
- By 2100
- 2,222,402 · +84.6%
Race, ethnicity, and origin ACS 2023
- Neighborhood character
- Diverse neighborhood (Simpson 0.63)
- Race & ethnicity
- Black 49% White 35% Hispanic / Latino 7% Two or more races 6% Asian 5%
- Hispanic origin (detail)
- Mexican 2% Puerto Rican 1%
- Common ancestry
- Lithuanian 2% Slovak 2% Romanian 1%
- Foreign-born
- 8% · Canada, China, South Korea
- Languages at home
- 88% English-only · Spanish 4% Other Indo-European 2% Other Asian/Pacific 1%
Political lean MEDSL · Fulton
- 2024 margin
- Solid D (+44.9) · D 71.9% · R 27.0% · Other 1.1%
- 2008→2024 swing
- +9.8pp toward D · 2008: 35.0pp · 2024: 44.9pp
- All cycles
- 2024: D+44.9 2020: D+46.4 2016: D+42.1 2012: D+29.6 2008: D+35.0
Not yet ingested
- Civics
- —
Market trends
- HPI YoY
- ▼ -470.82%
- Current HPI
- 224.1493
- Rent YoY
- ▲ 3.26%
- Metro
- Atlanta-Sandy Springs-Alpharetta, GA
- State GDP YoY
- ▲ 2.66%
- F500 in state
- 28
Industry mix (Fortune 500 HQ in GA)
| Industry | F500 HQs | Revenue |
|---|---|---|
| Paper / Packaging | 2 | $29B |
|
||
| Retail | 1 | $160B |
|
||
| Transportation / Logistics | 1 | $91B |
|
||
| Airlines | 1 | $62B |
|
||
| Consumer Goods | 1 | $47B |
|
||
| Utilities | 1 | $25B |
|
||
Price history
+400.0% since first listed22 events — show timeline
- 2026-04-09 Listed $250,000 FMLS
- 2026-03-30 Listed $250,000 GAMLS
- 2026-02-16 Listing Removed — GAMLS
- 2026-02-16 Listing Removed — FMLS
- 2025-10-02 Listed $275,000 FMLS
- 2025-09-12 Listed $275,000 GAMLS
- 2024-05-06 Relisted — FMLS
- 2024-05-06 Listing Removed — FMLS
- 2024-04-07 Pending — FMLS
- 2024-04-03 Contingent — FMLS
- 2024-03-29 Listed $279,000 FMLS
- 2019-07-30 Sold (MLS) $175,000 SBOR
- 2019-07-30 Sold (MLS) $175,000 GAMLS
- 2019-07-30 Sold (MLS) $175,000 FMLS
- 2019-05-25 Pending — GAMLS
- 2019-05-25 Pending — FMLS
- 2019-05-10 Price Changed $176,000 GAMLS
- 2019-05-09 Price Changed $176,000 FMLS
- 2019-04-18 Listed $176,000 SBOR
- 2019-04-18 Listed $179,000 GAMLS
- 2019-04-18 Listed $179,000 FMLS
- 2018-08-09 Sold (Public Records) $50,000 Public Records
Property tax history
+2.4%/yrLatest (2025): $2,245 · +6.0% YoY. Source: county tax records.
Cash-flow waterfall
monthlySold comps — $/sqft
last 12 mo · ≤1 miLoading sold comps…