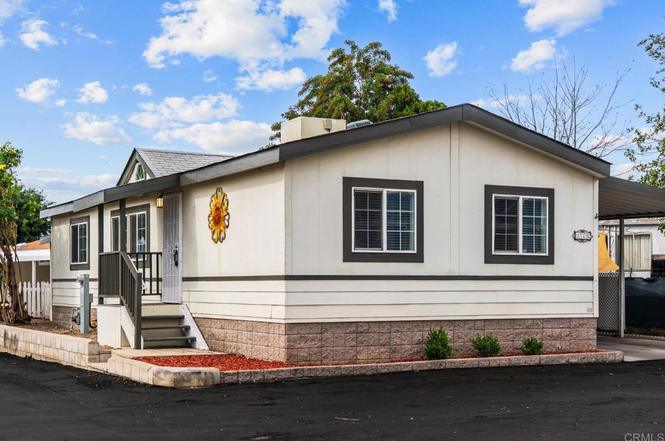
351 E Bradley Ave Spc 135 · Bostonia, CA
Flood risk 1/10 · Minimal
- FEMA flood zone
- X (unshaded)
- Chance of flooding over 30 yrs
- 0.0%
- Est. flood insurance / yr
- $507 – $1,088
Fire risk 1/10 · Minimal
- Est. fire insurance / yr
- $659 – $1,223
Heat risk 5/10 · Moderate
- Hot days now (above 99°F)
- 5 days/yr
- Hot days in 30 yrs
- 14 days/yr
Wind risk 1/10 · Minimal
- Chance of severe wind over 30 yrs
- —
Air-quality risk 3/10 · Minor
- Unhealthy air days now
- 4 days/yr
- Unhealthy air days in 30 yrs
- 4 days/yr
Risk factors via First Street. Map © Google.
Why this score? — see what drove the C grade
The composite is a weighted blend of 9 inputs, each scored 0–100. Each bar is that input's sub-score; the figure is the points it added to the 100-point composite (weight × sub-score).
- Cash flow +28.0/30.0
- DSCR +9.9/10.0
- 1% rule +6.5/10.0
- Schools +4.0/10.0
- Livability +3.2/5.0
- Condition / age +2.5/5.0
- Rent growth +2.3/5.0
- ARV discount +0.0/15.0
- Appreciation +0.0/10.0
$219,000
🖨 Deal sheet (PDF) 📄 Offer letter ✓ Due diligence
Listing remarks
Welcome to 351 E. Bradley an all-ages park offering comfort, convenience, and community. This charming 3 bed / 2 bath home features an open layout, an electric fireplace, and a bright kitchen that flows into the living area. Enjoy being a corner unit with extra privacy and a spacious parking area perfect for multiple cars. Located in a well-kept, all-ages community close to shopping, schools, and freeway access this is an affordable opportunity you don’t want to miss. Come see it today!
Key facts
- Bright kitchen
- Close to schools
- Electric fireplace
Tags
Property features AI
Finance
- Other: Lot size category: 0-1 unit/acre; Lot and living area info from public records
- HOA & community: Land lease: $1,605
Exterior
- Parking: Two total parking spaces; Two carport spaces
- Home design: Single-story property; Front entry
- Construction: One story
- Exterior features: Community pool; Curbs
Interior
- Bathrooms: Two full bathrooms
- Heating & cooling: Central cooling; High-efficiency cooling
- Interior features: All bedrooms on ground level; Front entry; Single-level home
- Laundry & utility: Laundry in closet
Neighborhood map
What this means for you Summary
Snapshot
- This is a 3-bed/2.0-bath manufactured listed at $219k.
Deal economics
- At list price, monthly cash flow is $681 ($8k/yr) — positive.
- The deal already cash-flows at list — no discount required.
- Meets the 1% rule at list price ($3k rent vs $219k).
- Recommended offer: $193k (12.0% below list) — sets the bar for market timing.
- Cap rate 10.0% vs local median 6.0% in Bostonia — top-decile yield for the area; either an underpriced asset or a hidden risk that comps aren't pricing in. Stress-test before assuming the spread holds.
Location & tenants
- Location reads 65/100 on livability (#383 in CA) — a middle-class / working-renter tenant base. Strengths: commute A+, housing B+; Watch: schools D, crime F, amenities F.
- Grossmont Union High (suburban): math 31% / reading 60% proficiency, ranked #173 of 517 in CA (top 34%) — families likely to look elsewhere, expect single-tenant / working-renter base with shorter leases; only 17% free/reduced lunch — higher-income household profile.
- Market conditions: Rents soft (-0.8%/yr); 244 active listings in the ZIP; 40 comparable units currently listed for rent nearby; rentals leasing fast (median 0d on market — plan ~1-2 weeks tenant-placement turnaround); 11,759 units permitted in San Diego County in 2024 (7,244 in 5+ unit buildings).
- This rent runs 41% of the median local income ($74k/yr) — at the standard rent-burdened threshold; future hikes will face affordability resistance.
Forward outlook
- Local home prices are declining (-3.0%/yr); year-one equity from $2k of loan paydown is wiped out by about $7k of value loss. Plan a longer hold.
- San Diego County population projected at +20% by 2050 — long-run rental-demand tailwind backs the buy-and-hold thesis.
Negotiation context
- It's been on market 127 days — a 12% lower offer ($193k) is reasonable based on typical stale-listing flexibility.
- 4 sale attempts since 2y ago with the ask held roughly flat each time — persistent listings suggest the price (not the market) is what's stuck; bring a comps-based counter.
Risks & watch-outs
- Climate carrying-cost: extreme-heat days projected 5→14/yr by 2055 (HVAC capex compounding) — expect insurance premiums to compound above CPI over the hold.
Questions for the listing agent
- It's been on market 127 days. Have you received any prior offers? Is the seller open to a 12% concession, seller financing, or rate buy-down credit?
- Why hasn't it sold? Are there any deal-killer items the seller is aware of (foundation, flood, title, zoning, code violations)?
- Is there a deadline driving the sale (1031 exchange, divorce, estate, relocation)? That informs how much negotiation room exists.
- Schools are D-rated, which usually means shorter tenancies and higher turnover. Who's the typical renter profile here, and what's been the actual vacancy rate?
- Crime grade is F in this area — have there been break-ins, vandalism, or insurance claims at this property in the last 3 years? What carrier currently insures it and at what premium?
- What's the average days-on-market for RENTAL listings here right now (not sales)? A rising rental-DOM trend means longer vacancies and softer asking-rent achievability than the comps imply.
- What's the recent tenant-quality profile in this submarket — average credit score on applications, eviction rate, late-payment / NSF rate, and stable-employment percentage? A property-management company in the area should have these aggregated.
- How much new for-sale + rental construction is in the pipeline within 1–3 miles? Heavy new supply typically softens prices + rents 12–24 months out; constrained supply supports both.
Investment metrics
- 1% rule
- 1.15% ✓
- Cap rate
- 10.03%
- Cash-on-cash
- 13.33%
- DSCR
- 1.59
- GRM
- 7.2
CMA / ARV
- ARV (on-the-fly)
- $149,760
- Comps found
- 12
Show comp detail 12 sales within ~0.75 mi
| Address | Dist | Beds/Ba | Sqft | Sold | Price | $/sf | Match |
|---|---|---|---|---|---|---|---|
| 255 E Bradley Ave #119 | 0.09mi | 3/1.5 | 950 (-1%) | 4mo | $121,000 | $127 | 88 |
| 351 E Bradley Ave Spc 125 | 0.16mi | 3/2.0 | 960 (0%) | 10mo | $150,000 | $156 | 84 |
| 351 E Bradley Ave #45 | 0.00mi | 2/2.0 (-1) | 960 (0%) | 15mo | $135,000 | $141 | 83 |
| 255 E Bradley Ave #13 | 0.10mi | 2/2.0 (-1) | 960 (0%) | 14mo | $165,000 | $172 | 79 |
| 400 Greenfield Dr Spc 123 | 0.20mi | 2/2.0 (-1) | 960 (0%) | 11mo | $107,000 | $111 | 77 |
| 255 E Bradley Ave Spc 116 | 0.10mi | 3/2.0 | 1,040 (+8%) | 7mo | $180,000 | $173 | 76 |
| 351 E Bradley Ave Spc 109 | 0.00mi | 2/2.0 (-1) | 1,056 (+10%) | 12mo | $140,000 | $133 | 68 |
| 351 E Bradley Ave Spc 164 | 0.00mi | 3/2.0 | 1,100 (+15%) | 11mo | $165,000 | $150 | 67 |
| 351 E BRADLEY #147 | 0.00mi | 2/2.0 (-1) | 1,041 (+8%) | 19mo | $170,000 | $163 | 65 |
| 260 E Bradley Ave #66 | 0.23mi | 3/2.0 | 1,040 (+8%) | 20mo | $225,000 | $216 | 59 |
| 351 E Bradley Ave #91 | 0.16mi | 3/1.0 | 880 (-8%) | 20mo | $140,000 | $159 | 58 |
| 450 E Bradley Ave #121 | 0.31mi | 2/2.0 (-1) | 1,088 (+13%) | 15mo | $124,900 | $115 | 46 |
Match score weights: distance 35% · size 25% · config 20% · recency 20%. Top-matched comps best support the ARV.
Projected returns pro-forma
-3.0% appreciation · 0.0% rent growth · sell at horizon
- IRR
- 0.2%
- Equity multiple
- 1.01×
- Total profit
- $434
- Equity at exit
- $32,654
- IRR
- 6.8%
- Equity multiple
- 1.45×
- Total profit
- $27,374
- Equity at exit
- $18,935
Cash invested: $61,320 (down + closing). Projections, not guarantees.
Landlord ↔ Tenant lean methodology
- Overall (STATE)
- 18 Strongly Tenant-Friendly
- State California
- 18 Strongly Tenant-Friendly · D+13
- County
- — inherits STATE
- City
- — inherits STATE
ZIP-level market 92021
- Rents YoY
- -0.8%
- Active inventory
- 244
- Price-to-rent
- 7.2×
Monthly cashflow live
- Estimated rent
- $2,517 high interval (Pro) →
- Mortgage (P&I)
- −$1,148
- Tax from tax record
- −$68 /mo · $814/yr
- Insurance
- −$91
- HOA
- −$0
- Vacancy / Maint / Mgmt
- −$529
- Net cashflow
- $681
Break-even live
Sensitivity live
| Price | -10% $805 | -5% $743 | +0% $681 | +5% $619 | +10% $557 |
|---|---|---|---|---|---|
| Rent | -10% $482 | -5% $582 | +0% $681 | +5% $781 | +10% $880 |
| Rate | -1.0pp $792 | -0.5pp $737 | base $681 | +0.5pp $624 | +1.0pp $567 |
UW: 25.0% down · 7.5% · 30yr · 1.5% tax · 5.0% vac · 8.0% maint · 8.0% mgmt
Financing live
Cash to close
- Down payment
- $54,750
- Closing costs
- $6,570
- Reserves months
- —
- Total cash needed
- —
Loan-product check · same deal, 3 products live
Conventional
25% down · 7.5% · 30yr
- Down + closing
- —
- Monthly P&I
- —
- Monthly cashflow
- —
- DSCR
- —
- Eligible?
- —
Personal DTI + credit; lowest rate.
DSCR
20% down · 8.5% · 30yr
- Down + closing
- —
- Monthly P&I
- —
- Monthly cashflow
- —
- DSCR
- —
- Eligible?
- —
No personal income docs; deal must DSCR.
Hard money
10% down · 12.0% · 12mo
- Down + closing
- —
- Monthly P&I
- —
- Monthly cashflow
- —
- DSCR
- —
- Eligible?
- —
Short-term bridge; refi at stabilization.
Rent comps 40 comps
| Address | Beds | Baths | Sqft | Rent | $/sqft | DOM | Units | Dist |
|---|---|---|---|---|---|---|---|---|
| 425 E Bradley Ave El Cajon, CA | 1.0–2.0 | 1.0 | 771 | $2,350 | $3.05 | 0d | 13 | 0.16mi |
| 1261 Victor Ave Unit 9 El Cajon, CA | 2.0 | 2.0 | 810 | $2,195 | $2.71 | 0d | 1 | 0.21mi |
| 1237 Graves Ave El Cajon, CA | 1.0–2.0 | 1.0–2.0 | 775 | $2,565 | $3.31 | 0d | 15 | 0.29mi |
| 310 E Bradley Ave El Cajon, CA | 1.0–2.0 | 1.0 | 664 | $2,050 | $3.09 | 0d | 1 | 0.29mi |
| 745 E Bradley Ave Unit 46 El Cajon, CA | 3.0 | 1.0 | 806 | $2,298 | $2.85 | 25d | 1 | 0.31mi |
| 360 E Bradley Ave El Cajon, CA | 3.0 | 2.0 | 1116 | $2,974 | $2.66 | 0d | 4 | 0.33mi |
| 1294 N Mollison Ave El Cajon, CA | 1.0–2.0 | 1.0 | 750 | $2,112 | $2.82 | 0d | 6 | 0.34mi |
| 1521 Graves Ave El Cajon, CA | 1.0–2.0 | 1.0–2.0 | 730 | $2,613 | $3.58 | 0d | 7 | 0.40mi |
| 1696 Buckeye Dr El Cajon, CA | 3.0 | 1.0 | 942 | $2,900 | $3.08 | 3d | 1 | 0.47mi |
| 1430 Diamond Ln El Cajon, CA | 2.0 | 1.0 | 863 | $2,695 | $3.12 | 3d | 1 | 0.52mi |
| 1314 5 D Dr Unit 1318 El Cajon, CA | 3.0 | 1.0 | 960 | $2,600 | $2.71 | 24d | 1 | 0.57mi |
| 1005 N Mollison Ave El Cajon, CA | 2.0 | 1.0 | 750 | $2,195 | $2.93 | 0d | 1 | 0.58mi |
| 989 Peach Ave El Cajon, CA | 1.0–3.0 | 1.0–2.0 | 845 | $2,741 | $3.24 | 0d | 11 | 0.79mi |
| 798 McClure St Unit 14 El Cajon, CA | 3.0 | 1.0 | 916 | $2,295 | $2.51 | 0d | 1 | 0.80mi |
| 716 Ballantyne St Unit 12 El Cajon, CA | 2.0 | 2.0 | 900 | $2,100 | $2.33 | 0d | 1 | 0.81mi |
| 700 Ballantyne St El Cajon, CA | 1.0–2.0 | 1.0 | 800 | $2,095 | $2.62 | 0d | 2 | 0.82mi |
| 1019 Peach Ave El Cajon, CA | 1.0–2.0 | 1.0–2.0 | 700 | $2,161 | $3.09 | 0d | 7 | 0.83mi |
| 359 Cascade Rd El Cajon, CA | 2.0 | 1.0 | 765 | $2,875 | $3.76 | 8d | 1 | 0.83mi |
| 1038 Peach Ave El Cajon, CA | 2.0 | 1.5 | 850 | $1,908 | $2.25 | 0d | 2 | 0.84mi |
| 1050 Peach Ave El Cajon, CA | 2.0 | 2.0 | 850 | $3,460 | $4.07 | 6d | 1 | 0.85mi |
| 1221 Oro St El Cajon, CA | 2.0 | 1.5 | 1020 | $2,575 | $2.52 | 0d | 1 | 0.98mi |
| 205 Beech St El Cajon, CA | 2.0 | 1.5 | 850 | $2,480 | $2.92 | 0d | 1 | 0.98mi |
| 8527 Graves Ave Santee, CA | 1.0–2.0 | 1.0–2.0 | 505 | $2,000 | $3.96 | 0d | 1 | 0.99mi |
| 534 Jeffree St El Cajon, CA | 3.0 | 2.0 | 1118 | $3,895 | $3.48 | 4d | 1 | 1.03mi |
| 534 Jeffree St El Cajon, CA | 3.0 | 2.0 | 1118 | $3,895 | $3.48 | 11d | 1 | 1.03mi |
| 390 E Madison Ave Unit E El Cajon, CA | 2.0 | 1.5 | 1034 | $2,300 | $2.22 | 5d | 1 | 1.03mi |
| 303 E Madison Ave El Cajon, CA | 2.0 | 1.0 | 875 | $1,995 | $2.28 | 0d | 1 | 1.07mi |
| 545 N Mollison Ave El Cajon, CA | 2.0 | 1.0 | 700 | $2,028 | $2.90 | 0d | 11 | 1.07mi |
| 545 N Mollison Ave El Cajon, CA | 2.0 | 1.0 | 700 | $2,000 | $2.86 | 8d | 9 | 1.07mi |
| 505 E Madison Ave #89 El Cajon, CA | 2.0 | 1.5 | 975 | $2,350 | $2.41 | 3d | 1 | 1.08mi |
| 455 Ballantyne St El Cajon, CA | 2.0 | 1.5 | 925 | $2,195 | $2.37 | 0d | 1 | 1.08mi |
| 453 Graves Ave El Cajon, CA | 2.0 | 2.0 | 840 | $2,150 | $2.56 | 3d | 1 | 1.12mi |
| 458 Ballantyne St Unit 15 El Cajon, CA | 2.0 | 1.0 | 760 | $2,100 | $2.76 | 0d | 1 | 1.12mi |
| 917 E Madison Ave El Cajon, CA | 2.0 | 1.0 | 750 | $2,195 | $2.93 | 0d | 1 | 1.15mi |
| 340 Wells Ave El Cajon, CA | 2.0 | 2.0 | 1000 | $2,775 | $2.77 | 0d | 2 | 1.16mi |
| 432 Dominguez Way Unit 13 El Cajon, CA | 2.0 | 1.5 | 952 | $2,195 | $2.31 | 21d | 1 | 1.19mi |
| 589 N Johnson Ave El Cajon, CA | 2.0 | 1.0–2.0 | 889 | $2,112 | $2.37 | 0d | 1 | 1.20mi |
| 1072 E Madison Ave El Cajon, CA | 2.0 | 1.0 | 770 | $1,995 | $2.59 | 0d | 1 | 1.22mi |
| 437 E Park Ave El Cajon, CA | 1.0–2.0 | 1.0 | 647 | $2,183 | $3.37 | 0d | 6 | 1.24mi |
| 8729 Graves Ave Santee, CA | 2.0 | 1.0 | 865 | $2,368 | $2.74 | 0d | 7 | 1.28mi |
Listing history 23 events
-
2026-06-21days on market $219,000 Active 127 DOM
-
2026-06-18days on market $219,000 Active 124 DOM
-
2026-06-17days on market $219,000 Active 123 DOM
-
2026-06-16days on market $219,000 Active 122 DOM
-
2026-06-15days on market $219,000 Active 121 DOM
-
2026-06-13days on market $219,000 Active 119 DOM
-
2026-06-13days on market $219,000 Active 118 DOM
-
2026-06-09days on market $219,000 Active 115 DOM
-
2026-06-08days on market $219,000 Active 114 DOM
-
2026-06-07days on market $219,000 Active 113 DOM
-
2026-06-04days on market $219,000 Active 110 DOM
-
2026-06-03days on market $219,000 Active 109 DOM
-
2026-06-02days on market $219,000 Active 108 DOM
-
2026-06-01days on market $219,000 Active 107 DOM
-
2026-05-31days on market $219,000 Active 106 DOM
-
2026-02-05$219,000 Active
-
2025-01-01historical
-
2024-12-02status Active
-
2024-11-01historical
-
2024-09-24price $185,000
-
2024-09-06price $195,000
-
2024-06-28status Active
-
2024-06-11$200,000 Active
ⓘ Source: listings_history table (triggers on properties + properties_extension) + one-shot
backfill from property_details.listing_events for pre-trigger history.
Tax reassessment forecast CA · Resets to sale price
- Current annual tax
- $814 · $68/mo
- Projected year-2 tax
- $1,664 · $139/mo
- Expected delta
- +$850/yr (+$71/mo · 104.5%)
ⓘ Screening estimate from a state-policy table — verify with the county assessor before closing.
Climate risk First Street
- Flood 1/10 Low FEMA zone X (unshaded) · 0% chance over 30 yrs
- Wildfire 1/10 Low
- Heat 5/10 Major 5 d/yr ≥99°F today · 14 d/yr by 30 yrs out
- Wind 1/10 Low
- Air quality 3/10 Moderate 4 unhealthy d/yr today · 4 by 30 yrs out
Nearby sold comps map
Loading sold comps map…
Walkable amenities ~0.75 mi
Loading nearby amenities…
Taxation est. · year 1
- Rental income
- $30,209
- − Mortgage interest
- −$12,267
- − Property taxes
- −$814
- − Insurance
- −$1,095
- − Repairs & maintenance
- −$2,417
- − Management
- −$2,417
- − Depreciation
- −$6,371
- Taxable income
- $4,828
- Est. tax owed @ 24.0%
- −$1,159
- After-tax cash flow
- $7,016/yr
For passive investors: Depreciation is non-cash, so a rental often shows a tax loss while cash-flowing — sheltering income. Rental losses are passive: they offset passive income freely, and up to $25,000/yr can offset ordinary (W-2) income if you actively participate and your MAGI is under $100k (phasing out to $0 by $150k); unused losses carry forward. On sale, claimed depreciation is recaptured at up to 25%, and gains may owe capital-gains tax (a 1031 exchange can defer both). Figures are a year-1 estimate at your 24.0% rate — not tax advice; consult a CPA.
Schools (NCES district)
- District
- Grossmont Union High
- NCES district ID
- 0616230
- Math proficiency
- 31% ▼ -1.00%
- Reading proficiency
- 60% ▲ 5.00%
- Median HH income
- $61,801
- Composite
- 40.07/100
- National rank
- #3810
- State rank
- #173 of 517 in CA
Livability — Bostonia
- Score
- 65/100
- State rank
- #383
- US rank
- #13065
Category grades
Schools grade is shown separately in the Schools card above.
Census & demographics
- Census place
- Bostonia, CA
- County
- San Diego County · 3,178,799 people
- Metro
- San Diego-Chula Vista-Carlsbad, CA
- Population (ZIP)
- 70,501
- Household income
- $74,013
- Rent vs Own
- Severe rent burden
- 4178.0
Population outlook (San Diego County) Hauer SSP2
- Today (2025)
- 3,678,185 people
- By 2030
- 3,856,546 · +4.8%
- By 2040
- 4,171,407 · +13.4%
- By 2050
- 4,421,607 · +20.2%
- By 2075
- 4,831,599 · +31.4%
- By 2100
- 4,832,502 · +31.4%
Race, ethnicity, and origin ACS 2023
- Neighborhood character
- Diverse neighborhood (Simpson 0.62)
- Race & ethnicity
- White 54% Hispanic / Latino 28% Two or more races 14% Black 6% Asian 5% Native American 2%
- Hispanic origin (detail)
- Mexican 24%
- Common ancestry
- Arab 6% Italian 2% Lithuanian 2%
- Foreign-born
- 22% · Canada
- Languages at home
- 65% English-only · Spanish 18% Arabic 7% Other Indo-European 3%
Political lean MEDSL · San Diego
- 2024 margin
- D (+16.8) · D 56.9% · R 40.1% · Other 2.9%
- 2008→2024 swing
- +6.6pp toward D · 2008: 10.2pp · 2024: 16.8pp
- All cycles
- 2024: D+16.8 2020: D+22.8 2016: D+17.8 2012: D+5.1 2008: D+10.2
Not yet ingested
- Civics
- —
Market trends
- HPI YoY
- ▼ -654.88%
- Current HPI
- 335.0617
- Rent YoY
- ▼ -0.83%
- Metro
- San Diego-Chula Vista-Carlsbad, CA
- State GDP YoY
- ▲ 3.21%
- F500 in state
- 116
Industry mix (Fortune 500 HQ in CA)
| Industry | F500 HQs | Revenue |
|---|---|---|
| Technology | 27 | $1,492B |
|
||
| Financial Services | 3 | $174B |
|
||
| Retail | 3 | $44B |
|
||
| Insurance | 3 | $26B |
|
||
| Media / Entertainment | 2 | $115B |
|
||
| Pharmaceuticals / Biotech | 2 | $62B |
|
||
Price history
+9.5% since first listed8 events — show timeline
- 2026-02-05 Listed $219,000 CRMLS
- 2025-01-01 Listing Removed — CRMLS
- 2024-12-02 Relisted — CRMLS
- 2024-11-01 Listing Removed — CRMLS
- 2024-09-24 Price Changed $185,000 CRMLS
- 2024-09-06 Price Changed $195,000 CRMLS
- 2024-06-28 Relisted — CRMLS
- 2024-06-11 Listed $200,000 CRMLS
Property tax history
+3.2%/yrLatest (2013): $814 · +5.6% YoY. Source: county tax records.
Cash-flow waterfall
monthlySold comps — $/sqft
last 12 mo · ≤1 miLoading sold comps…